. 2023 Jul 20;14(1):4373.
doi: 10.1038/s41467-023-39958-5.

Multi-omics analysis of human mesenchymal stem cells shows cell aging that alters immunomodulatory activity through the downregulation of PD-L1

Affiliations

Multi-omics analysis of human mesenchymal stem cells shows cell aging that alters immunomodulatory activity through the downregulation of PD-L1

Yuchen Gao et al. Nat Commun. .

Abstract

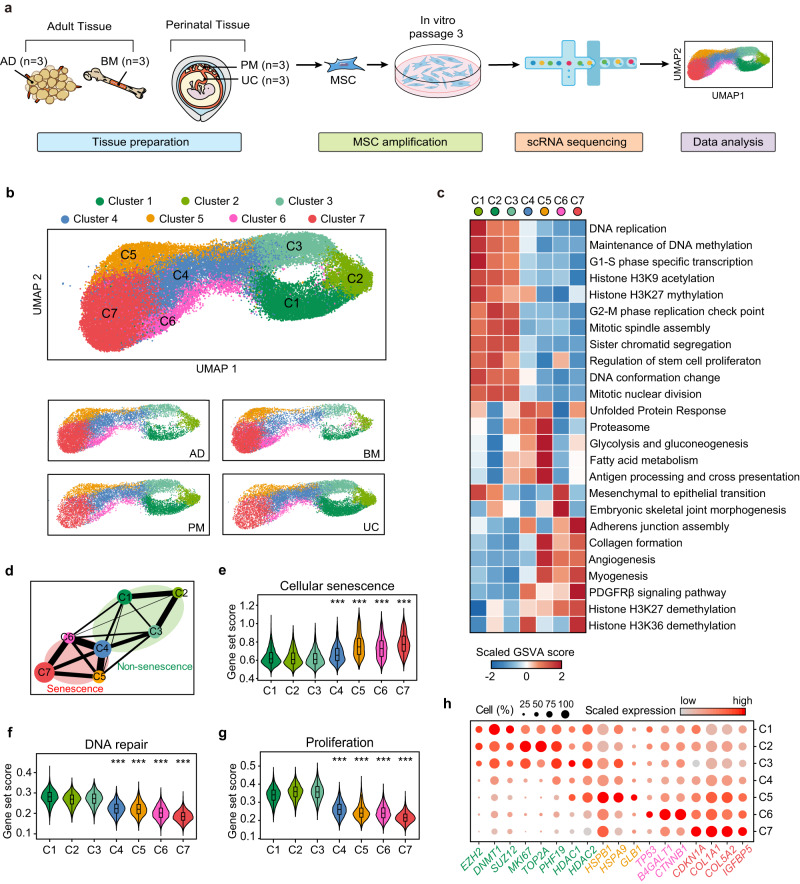
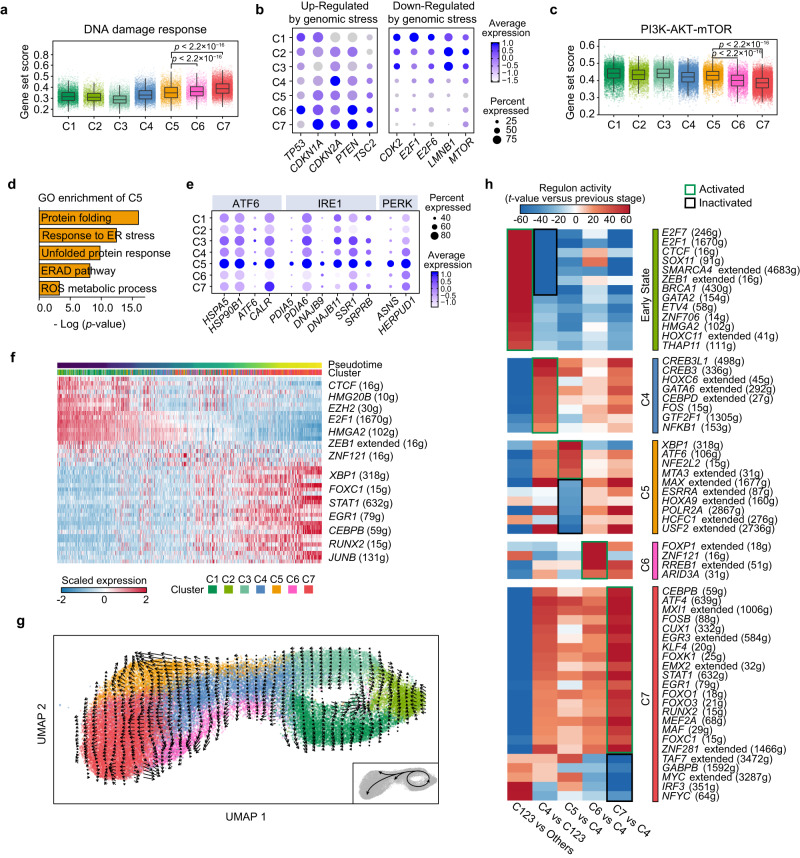
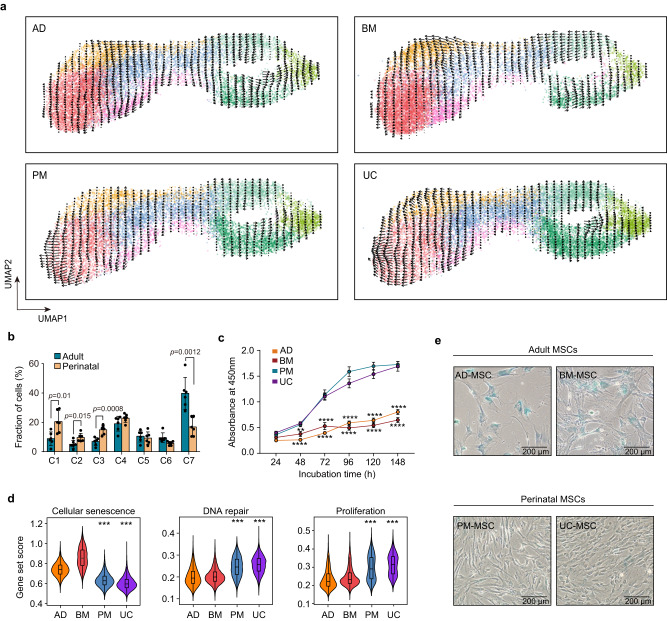
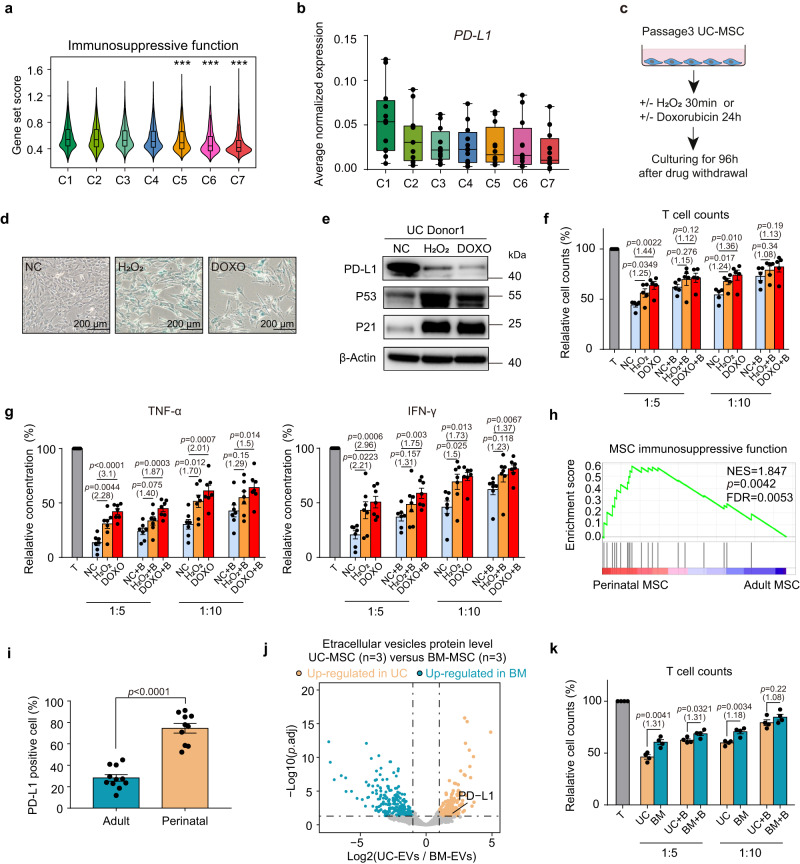
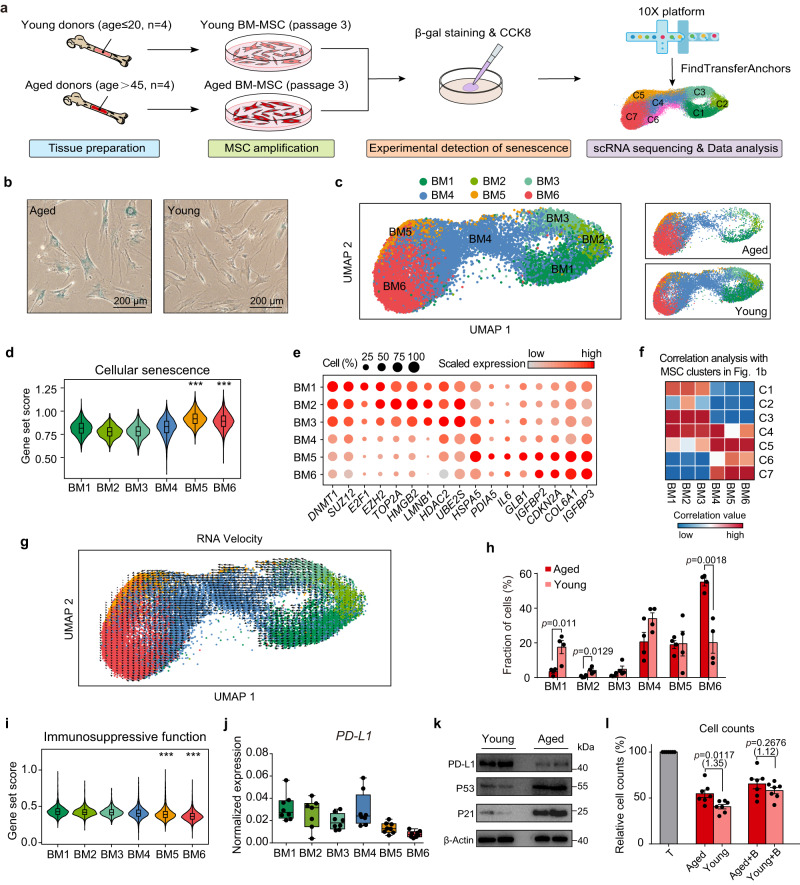
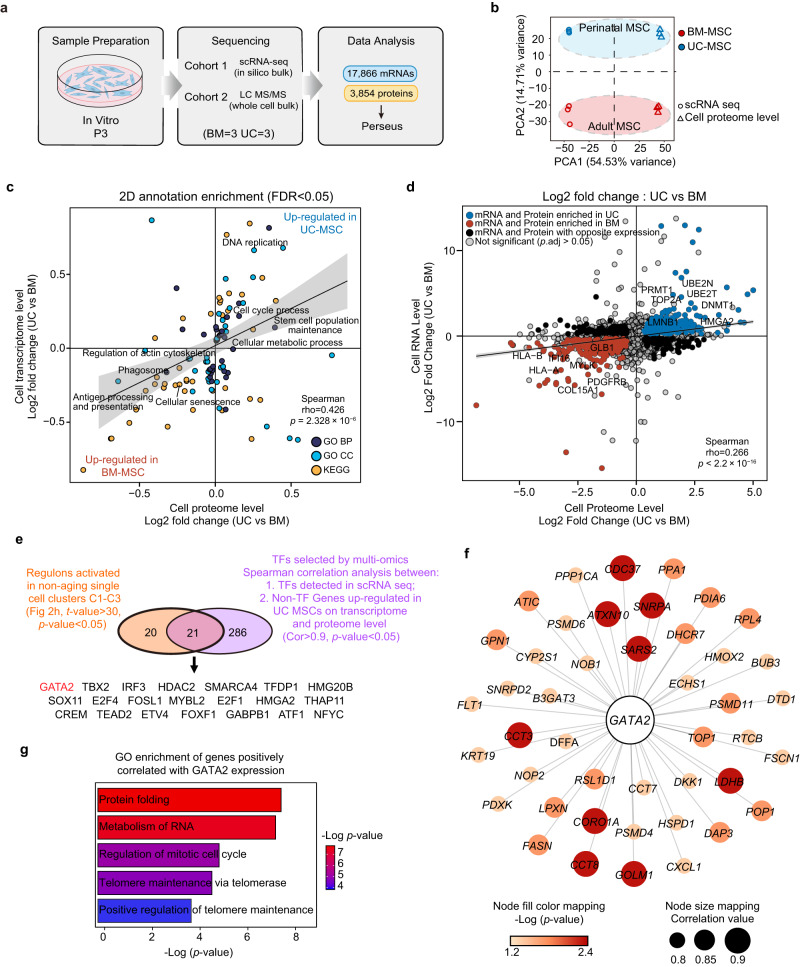
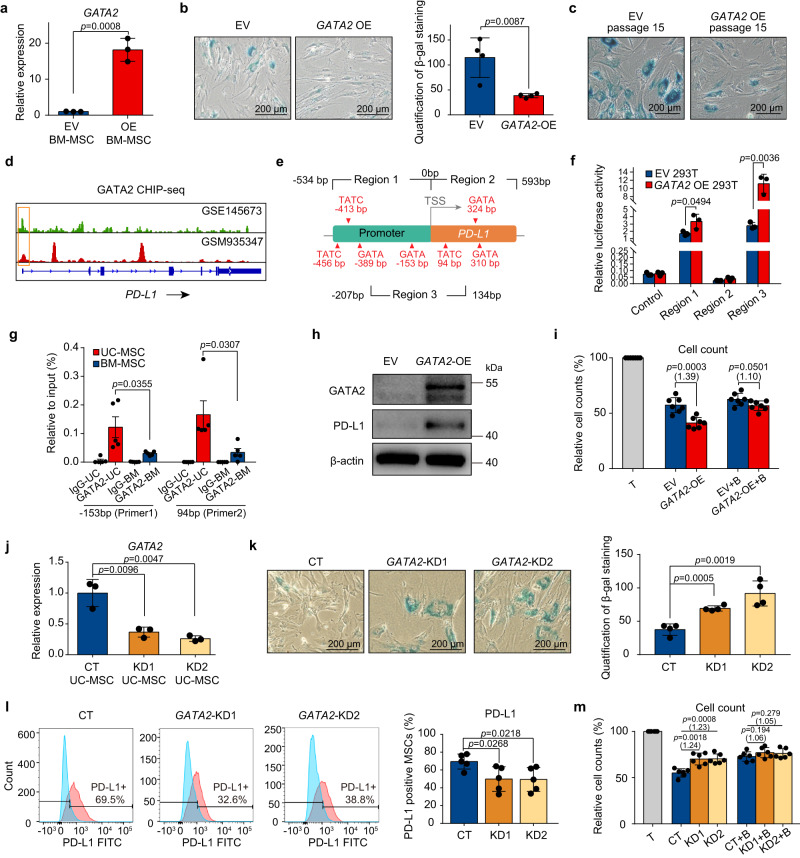
Mesenchymal stem cells (MSCs) possess potent immunomodulatory activity and have been extensively investigated for their therapeutic potential in treating inflammatory disorders. However, the mechanisms underlying the immunosuppressive function of MSCs are not fully understood, hindering the development of standardized MSC-based therapies for clinical use. In this study, we profile the single-cell transcriptomes of MSCs isolated from adipose tissue (AD), bone marrow (BM), placental chorionic membrane (PM), and umbilical cord (UC). Our results demonstrate that MSCs undergo a progressive aging process and that the cellular senescence state influences their immunosuppressive activity by downregulating PD-L1 expression. Through integrated analysis of single-cell transcriptomic and proteomic data, we identify GATA2 as a regulator of MSC senescence and PD-L1 expression. Overall, our findings highlight the roles of cell aging and PD-L1 expression in modulating the immunosuppressive efficacy of MSCs and implicating perinatal MSC therapy for clinical applications in inflammatory disorders.


Conflict of interest statement

The authors declare no competing interests.

Figures

Fig. 1
Fig. 1. Single-cell transcriptomic atlas of human MSCs reconstructs a progressive cellular senescence process.
a Schematic representation of the study design and experimental procedure. b UMAP showing seven subpopulations of MSCs from adipose tissue, bone marrow, placenta membrane and umbilical cord. MSCs were projected together by UMAP (top) and displayed separately by tissue origin (bottom). c Heatmap displaying differences in pathway activity calculated by GSVA in distinct cell subclusters. d PAGA analysis of each MSC cluster. Nodes represent subsets, and thicker edges indicate stronger connectedness between subsets. e–g Violin plots showing average expression of cellular senescence genes, DNA repair genes and proliferation genes for each cluster. Box plot within each violin plot indicate median values, and the 25th to 75th percentiles. Asterisks on specific group represent there were statistical differences compared with cluster C1, C2 and C3. The p values were generated by two-sided one-way ANOVA with Tukey’s multiple comparisons test. (***p < 2.2 × 10−16, n = 45,955 biologically independent cells) h Dot plots showing the expression values of representative senescence-related genes for each cluster. Color represents the scaled expression values from Seurat RNA assay. The displayed values were non-batch corrected.
Fig. 2
Fig. 2. Biochemical processes underpinning senescence progress in MSC.
a Box plot showing average normalized expression value of genes related with DNA damage response pathway. b Dot plot showing selected feature genes from each cluster. Including genes down-regulated and up-regulated in DNA damage response. c Box plot showing average normalized expression value of genes related with mTOR signaling. d Representative Gene Ontology pathways showing enriched expression in Cluster 5. e Dot plot showing the proportion of MSCs expressing and the expression level of representative genes associated with ATF6 signaling, IRE1 signaling and PERK signaling. f Heatmap displaying the activities of regulons in each cell ordered across pseudotime trajectory generated by monocle, with regulons labels at right. g RNA velocity analysis revealing the direction of transformation and the inter-relationship of MSC subpopulations. h Heatmap showing the t-values of regulon activity derived by the generalized linear model (GLM, see methods), t-values representing activity change between the current developmental stage and the previous one. Only regulons with at least one absolute t-value > 20 are showed. Regulons are clustered based on their activation (green box) or inactivation (black box) pattern. For the box plots in a and c, each single cell was used as an individual sample and annotated in the figure with the color represented by each MSC cluster, the plot center, box and whiskers corresponding to median, IQR and 1.5 × IQR, respectively. In the dot plots, color represents the scaled expression values from Seurat RNA assay, the displayed values were non-batch corrected. For a and c, p values were determined by two-tailed Wilcoxon rank-sum test (n = 4621 biologically independent cells in C5; n = 3409 biologically independent cells in C6; n = 13,105 biologically independent cells in C7).
Fig. 3
Fig. 3. Perinatal MSCs has less senescent cells as compared to adult MSCs.
a RNA velocity analysis of MSCs from adult and perinatal tissues. b Fractions of subpopulations in six adult versus six perinatal MSC samples (Error bar: means ± SD), p values were generated by two-tailed t-test with Welch’s correction (n = 6 independent samples per group). c Proliferation of MSCs from 4 tissue origins assessed by CCK-8 assay. Data are means ± SEM and representative of one independent experiment. The p values were generated by two-sided one-way ANOVA with Tukey’s multiple comparisons test. Asterisks on adult group represent there were statistical differences compared with perinatal group. (**p < 0.0038; ****p < 0.0001; n = 15 independent samples each group) d Violin plots of the cellular senescence score, DNA repair score and proliferation score of cells from each tissue origin. Box plots within each violin plot indicate median values and the 25th to 75th percentiles. Asterisks on specific groups represent significant differences compared with cells derived from AD and BM. The p values were generated by two-sided one-way ANOVA with Tukey’s multiple comparisons test. (***p < 2.2 × 10−16; n = 45,955 biologically independent cells) e SA-β-gal staining in human MSCs derived from adipose tissue, bone marrow, placenta membrane and umbilical cord. Data are representative of one independent experiment. Scale bar, 200 µm. Source data are provided as a Source Data file.
Fig. 4
Fig. 4. Cellular senescence status determines the PD-L1 expression and immunosuppressive function of human MSCs.
a Violin plots showing the average expression of immunosuppressive functional genes for each cluster. Asterisks on specific groups represent significant differences compared with clusters C1, C2 and C3, p values were generated by two-sided one-way ANOVA with Tukey’s multiple comparisons test. (***p < 2.2 × 10−16, n = 45,955 biologically independent cells) b Box plot showing the average expression of PD-L1 in each cell cluster of all samples (n = 12 independent samples per group). Each dot represents the average normalized expression value of PD-L1 from Seurat RNA assay. c Experimental design. d SA-β-gal staining in MSCs. Scale bar, 200 µm. Data represent one independent experiment. e Western blot analysis of PD-L1, P53 and P21 protein in MSCs, represent one independent experiment. f Bar plots represent cell counts of CD4+ T cells cocultured with normal control (NC), H2O2-treated or doxorubicin-treated MSCs (n = 5 independent experiments). g ELISA of TNF-α (left) and IFN-γ (right) levels in the coculture supernatant. Data represent 5 independent experiments (n = 7 independent samples each group). h GSEA indicating the significantly enriched immunosuppressive function of perinatal MSCs. The p-value was determined by one-sided permutation test, comparing observed NES with a null distribution. FDR was controlled using the Benjamini-Hochberg method. i Flow cytometry analysis showing PD-L1 expression among adult (nAD = 6 independent samples; nBM = 5 independent samples) and perinatal MSCs (nPM = 5 independent samples, nUC = 5 independent samples). j Volcano plot showing the differentially expressed proteins in UC- and BM-EVs (Log-transformed fold change >1; p.adj <0.05). k Cell counts of CD4+ T cells cocultured with BM- or UC-MSCs (n = 4 independent experiments). All box plots indicate median values, and the 25th to 75th percentiles. All bar plots represent the means ± SEM. For f, g and k, CD4+ T cells cocultured with MSCs at a 5:1 or 10:1 ratio in the presence of isotype or PD-L1 blocking antibody (+ B), multiples of the mean values between the two groups are marked in parentheses below the p-values. For f, g, i and k, p-values were determined by two-tailed unpaired Student’s t-test. Source data are provided as a Source Data file.
Fig. 5
Fig. 5. Cellular senescence reduced the immunomodulatory capacity of BM-MSCs derived from aged donors.
a Experimental design. b SA-β-gal staining in young and aged BM-MSCs, representative of one independent experiment. Scale bar, 200 µm. c UMAP showing six clusters of BM-MSCs. MSCs were projected together by UMAP (left) and displayed separately by age of donors (right). d Violin plots showing average expression of cellular senescence genes for each cluster. e Dot plots showing the scaled expression of representative senescent-related genes for each cluster. Color represents the scaled expression values from Seurat RNA assay. f Correlation matrices showing the Pearson correlation coefficients of the 6 BM-MSC clusters and 7 MSC clusters as shown in Fig. 1b. g RNA velocity analysis of BM-MSCs from young and aged donors. h Fractions of subpopulations in aged and young MSC samples, p values were generated by two-tailed t-test with Welch’s correction (n = 4 independent samples each group). i Violin plots showing average expression of immunosuppressive function genes for each cluster. j Box plot showing the pseudobulk PD-L1 expression in each cell cluster (n = 8 independent samples per cluster). Each dot represents the average normalized expression value of PD-L1 from Seurat RNA assay. k Western blot analysis of PD-L1, P53 and P21 protein in young (n = 2) and aged (n = 2) BM-MSCs, represent one independent experiment. l Cell counts of CD4+ T cells cocultured with young and aged BM-MSCs in the presence of isotype or PD-L1 blocking antibody (+ B). Data are representative of 3 independent experiments (n = 7 independent samples each group). The p values were generated by two-tailed unpaired Student’s t-test. Multiples of the mean values between the two groups are marked in parentheses under the p-values. All box plots indicate median values, and the 25th to 75th percentiles. All bar plots represent the means ± SEM. For d and i, p values were generated by two-sided one-way ANOVA with Tukey’s multiple comparisons test, asterisks on specific group represent there were statistical differences compared with cluster BM1, BM2 and BM3. (***p < 2.2 × 10−16; n = 31,907 biologically independent cells). Source data are provided as a Source Data file.
Fig. 6
Fig. 6. Integrated analysis of single-cell transcriptomic and proteomic data identifies GATA2 as a key regulator of MSC senescence.
a Experimental workflow used to analyze the transcriptome and proteome of MSCs. b In silico bulk (scRNA-seq) data were merged with proteome data (mass spectrometry) and subjected to principal component analysis. The first principal component shows clustering by data modality. The second principal component separates perinatal and adult MSCs across two data modalities. c Scatter plot showing the result of the two-dimensional annotation enrichment analysis based on fold changes in the proteome (x-axis) and transcriptome (y-axis). The significant positive correlation of both datasets was calculated by Spearman’s test, p values were computed using two-sided algorithm AS 89 (n = 114 pathways; Supplementary Data 11). d Scatter plot showing the results of differential expression analysis based on fold changes in the proteome (x-axis) and transcriptome (y-axis). The differential expressed genes or proteins were calculated by two-tailed Wald test and adjusted using Benjamini-Hochberg FDR correction (n = 3 independent samples for each group). The significant positive correlation of both datasets was calculated by Spearman’s test, p values were computed using two-sided asymptotic t approximation (n = 3,664 genes; Supplementary Data 10). e Venn diagram showing the overlap of TFs between the top activated regulons in clusters C1-C3 (t-value > 30; p value < 0.05) and TFs significantly correlated with upregulated proteins in UC-MSCs (Cor > 0.9, p value < 0.05). f Protein–protein interaction (PPI) network representing GATA2 positively correlated non-TF genes, which were upregulated in UC-MSCs on both transcriptome and proteome level. The color of the nodes represents -Log(p-value) and the size of the nodes represents correlation value. g Bar plot representing enriched GO pathways of the GATA2 positively correlated non-TF genes.
Fig. 7
Fig. 7. GATA2 enhance the anti-senescence ability of MSC and restore their immunosuppressive function.
a qPCR analysis of GATA2 expression in BM-MSCs upon lentivirus-mediated gene overexpression (n = 3 independent experiments). b (left) SA-β-gal staining in BM-MSCs, represent one independent experiment. Scale bar, 200 µm. (right) Quantification of SA-β-gal-positive MSCs, represent three independent experiments (n = 4 independent samples per group). c SA-β-gal staining in EV or GATA2-OE BM-MSCs cultured to passage 15. Scale bar, 200 µm. Data represent one independent experiment. d Representative GATA2 occupancy plots of PD-L1 genes from the ChIP-seq datasets. e Experimental design. f Bar plot showing the luciferase activity of 293 T cells co-transfected with dual-luciferase reporter, as well as EV or GATA2 (n = 3 independent experiments). g qPCR results were used to quantify enrichment of GATA2 at the PD-L1 promoter using ChIP-assay, pooled from three independent experiments. (n = 5 independent samples each group). h Western blot analysis of GATA2 and PD-L1 protein in EV and GATA2-OE BM-MSCs, represent one independent experiment. i Cell counts of CD4+ T cells cocultured with EV or GATA2-OE MSCs (n = 7 independent samples each group). j qPCR analysis of GATA2 expression in UC-MSCs after transfection with scramble- or GATA2-shRNA. (n = 3 independent experiments). k (left) SA-β-gal staining in UC-MSCs, representative of one independent experiment. Scale bar, 200 µm. (right) Quantification of SA-β-gal-positive MSCs are shown in the bar plot, represent three independent experiments (n = 4 independent samples each group). l (left) Representative flow cytometry plots. (right) Bar plot showing PD-L1 expression on CT or GATA2-KD UC-MSCs, pooled from three independent experiments (n = 5 independent samples each group). m Cell counts of CD4+ T cells cocultured with CT or GATA2-KD MSCs (n = 6 independent samples each group). For g, bar plots represent the means ± SEM. All other bar plots represent the means ± SD. For i and m, data represent three independent experiments, T cells were co-cultured with MSCs in the presence of isotype or PD-L1 blocking antibody (+ B), multiples of the mean values between the two groups are marked in parentheses. All p-values were generated by two-tailed unpaired Student’s t-test. Source data are provided as a Source Data file.

References

    1. Friedenstein AJ, et al. Precursors for fibroblasts in different populations of hematopoietic cells as detected by the in vitro colony assay method. Exp. Hematol. 1974;2:83–92. - PubMed
    1. Bianco P, Robey PG, Simmons PJ. Mesenchymal stem cells: revisiting history, concepts, and assays. Cell Stem Cell. 2008;2:313–319. doi: 10.1016/j.stem.2008.03.002. - DOI - PMC - PubMed
    1. Shi Y, et al. Immunoregulatory mechanisms of mesenchymal stem and stromal cells in inflammatory diseases. Nat. Rev. Nephrol. 2018;14:493–507. doi: 10.1038/s41581-018-0023-5. - DOI - PubMed
    1. Le Blanc K, et al. Treatment of severe acute graft-versus-host disease with third party haploidentical mesenchymal stem cells. Lancet (Lond., Engl.) 2004;363:1439–1441. doi: 10.1016/S0140-6736(04)16104-7. - DOI - PubMed
    1. Serrero M, et al. Long-term Safety and Efficacy of Local Microinjection Combining Autologous Microfat and Adipose-Derived Stromal Vascular Fraction for the Treatment of Refractory Perianal Fistula in Crohn’s Disease. Gastroenterology. 2019;156:2335–2337.e2332. doi: 10.1053/j.gastro.2019.01.032. - DOI - PubMed

Publication types