. 2023 Jul 20;14(1):4399.
doi: 10.1038/s41467-023-40078-3.

Neural signatures of social inferences predict the number of real-life social contacts and autism severity

Affiliations

Neural signatures of social inferences predict the number of real-life social contacts and autism severity

Anita Tusche et al. Nat Commun. .

Abstract

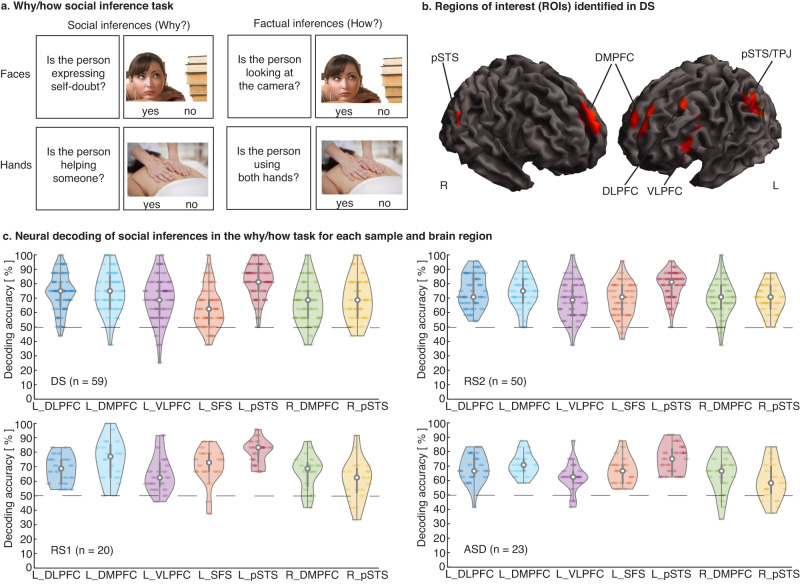
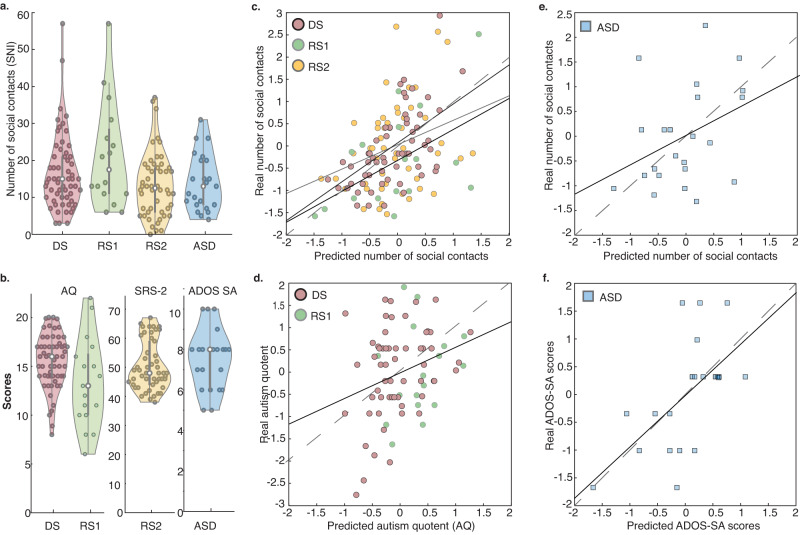
We regularly infer other people's thoughts and feelings from observing their actions, but how this ability contributes to successful social behavior and interactions remains unknown. We show that neural activation patterns during social inferences obtained in the laboratory predict the number of social contacts in the real world, as measured by the social network index, in three neurotypical samples (total n = 126) and one sample of autistic adults (n = 23). We also show that brain patterns during social inference generalize across individuals in these groups. Cross-validated associations between brain activations and social inference localize selectively to the right posterior superior temporal sulcus and were specific for social, but not nonsocial, inference. Activation within this same brain region also predicts autism-like trait scores from questionnaires and autism symptom severity. Thus, neural activations produced while thinking about other people's mental states predict variance in multiple indices of social functioning in the real world.


Conflict of interest statement

The authors declare no competing interests.

Figures

Fig. 1
Fig. 1. Measuring social inference processing in the brain.
a Why/how social inference task (fMRI). In each task block, participants respond to yes/no questions that require either social inferences about other people’s internal states (why? high level of inference; left column) or factual inferences (how? low level of inference; right column). The task uses two stimulus sets (emotional facial expressions, top row; intentional hand actions, bottom row). An additional condition using nonsocial stimuli to elicit why/how inferences is not displayed (implemented for the replication samples 1 and 2 (RS1, RS2) and the autism spectrum disorder (ASD) group). b Brain regions from which social inference could be decoded in the neurotypical discovery sample (DS; why vs. how; p < 0.05, FWE whole-brain corrected at the voxel level; simple t test of whole-brain decoding accuracy maps at the group level implemented in SPM12; see Table 2 for details and full names of abbreviated brain areas). These clusters served as regions of interest (ROIs) for the neural prediction of real-world social behavior in all four participant samples. c Activation patterns in the ROIs (identified in the DS group) also decoded participants’ engagement in social inferences (why vs. how) in RS1, RS2, and ASD groups, verifying the ROIs selected based on results in DS. For each ROI and participant sample, decoding accuracies are shown for each individual (circles within violin plots; n biologically independent samples: DS = 59, RS1 = 20, RS2 = 50, ASD = 23). Dotted lines illustrate the chance level of the prediction (50%). Central white marks of boxplots (gray bars within violin plots) indicate ROI-based median accuracies, which were well above chance in each ROI and sample (all p’s < 0.05, permutation tests, FDR-corrected). Edges of boxplots indicate the 25th–75th percentiles and whiskers of boxplots illustrate minima and maxima. Decoding accuracies of social inferences were comparable across ASD and the matched RS1 groups (two-sample t tests, p’s > 0.52, FDR corrected). Source data are provided as a Source Data file, for exact p values see Table S8.
Fig. 2
Fig. 2. Neural prediction of real-world social functioning.
a Violin plots of the number of real-life social contacts (SNI scores of social network size) in the neurotypical Discovery Sample (DS, n = 59), neurotypical Replication Samples 1 and 2 (RS1, n = 17; RS2, n = 50), and Autism Spectrum Disorder group (ASD, n = 23). b Violin plots of autism-like traits in neurotypical samples (Autism Quotient, AQ in DS [n = 59] and RS1 [n = 17]; Social Responsiveness Scale-2 in SRS-2, n = 50) and autism symptom severity in the social affective domain in the ASD group (ADOS SA, n = 21). Circles within violin plots represent participants; gray bars indicate the 25th–75th percentiles; box plot whiskers illustrate the minima and maxima; white dots indicate the median. c Illustration of the match of predicted and actual number of real-life social contacts (SNI, z scored) from brain activation in the right pSTS (DS: r = 0.46 [−0.38, 0.26], R2 = 0.21, p = 0.004; RS1: r = 0.52 [−0.49, 0.48], R2 = 0.27, p = 0.036; RS2: r = 0.30 [−0.39, 0.28], R2 = 0.09, p = 0.043; Pearson correlations, p values derived from non-parametric permutation tests; leave-one-participant-out-cross-validation). Solid lines indicate trend lines for each sample; dashed lines are for reference and indicate the theoretical perfect correspondence of values on both axes (predicted = real scores). d Neural prediction of autism-like trait scores (Autism Quotient, AQ, z scored for comparability across behavioral measures) in the community samples (DS, RS1) from activation patterns in the right pSTS (r = 0.29 [−0.34, 0.24], R2 = 0.09, p = 0.021, Pearson correlation, permutation test). e Neural activation patterns the pSTS from all three neurotypical samples predict the number of social contacts (SNI scores, r = 0.38 [−0.35, 0.35], R2 = 0.14, p = 0.037) and f symptom severity (ADOS SA scores) in the ASD group (r = 0.60 [−0.36, 0.36], R2 = 0.36, p = 0.001; Pearson correlations, permutation tests; cross-sample prediction: train on data of all neurotypical individuals, test on data of the ASD group). Higher ADOS SA scores indicate more severe symptoms in the social affective domain. Source data are provided as a Source Data file.

References

    1. Cacioppo JT, Cacioppo S. Social relationships and health: the toxic effects of perceived social isolation. Soc. Personal. Psychol. Compass. 2014;8:58–72. doi: 10.1111/spc3.12087. - DOI - PMC - PubMed
    1. Smith KP, Christakis NA. Social networks and health. Annu. Rev. Sociol. 2008;34:405–429. doi: 10.1146/annurev.soc.34.040507.134601. - DOI
    1. Barnes LL, De Leon CM, Wilson RS, Bienias JL, Evans DA. Social resources and cognitive decline in a population of older African Americans and whites. Neurology. 2004;63:2322–2326. doi: 10.1212/01.WNL.0000147473.04043.B3. - DOI - PubMed
    1. Cohen S, Doyle WJ, Skoner DP, Rabin BS, Gwaltney JM., Jr. Social ties and susceptibility to the common cold. JAMA. 1997;277:1940–1944. doi: 10.1001/jama.1997.03540480040036. - DOI - PubMed
    1. Dunbar RI. The social brain hypothesis. Evolut. Anthropol. 1998;6:178–190. doi: 10.1002/(SICI)1520-6505(1998)6:5<178::AID-EVAN5>3.0.CO;2-8. - DOI

Publication types