. 2023 Jul 20;13(1):11760.
doi: 10.1038/s41598-023-38858-4.

Predicting sepsis onset using a machine learned causal probabilistic network algorithm based on electronic health records data

Affiliations

Predicting sepsis onset using a machine learned causal probabilistic network algorithm based on electronic health records data

John Karlsson Valik et al. Sci Rep. .

Abstract

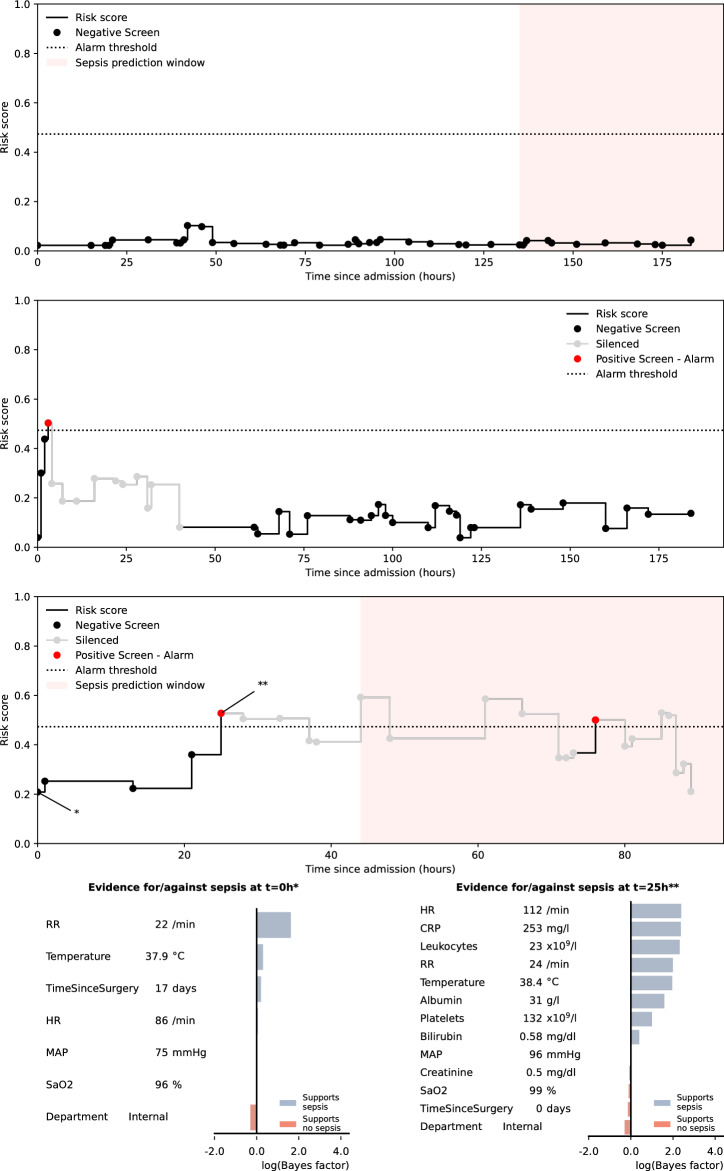
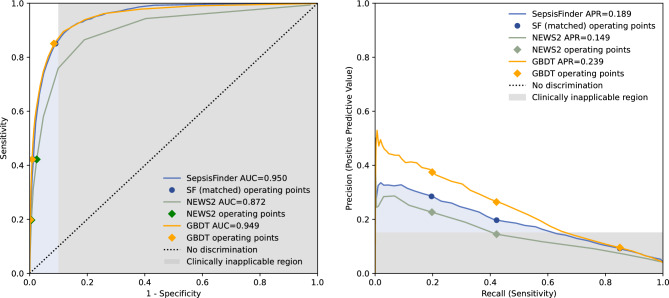
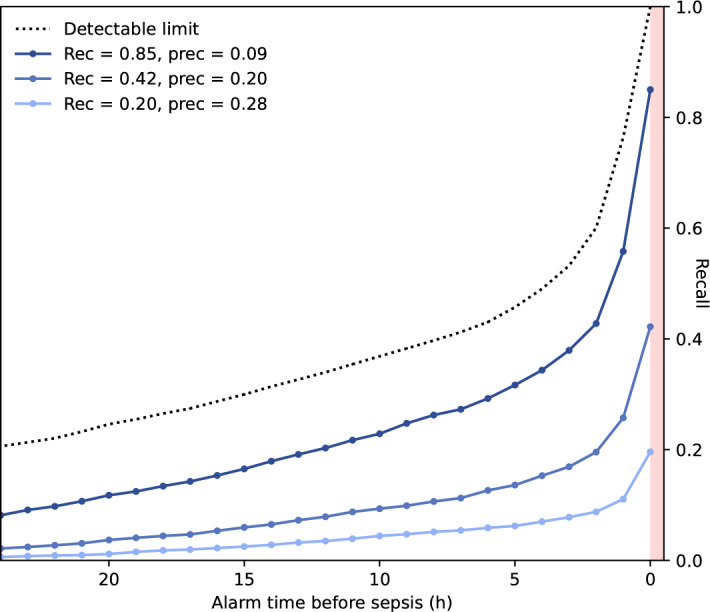
Sepsis is a leading cause of mortality and early identification improves survival. With increasing digitalization of health care data automated sepsis prediction models hold promise to aid in prompt recognition. Most previous studies have focused on the intensive care unit (ICU) setting. Yet only a small proportion of sepsis develops in the ICU and there is an apparent clinical benefit to identify patients earlier in the disease trajectory. In this cohort of 82,852 hospital admissions and 8038 sepsis episodes classified according to the Sepsis-3 criteria, we demonstrate that a machine learned score can predict sepsis onset within 48 h using sparse routine electronic health record data outside the ICU. Our score was based on a causal probabilistic network model-SepsisFinder-which has similarities with clinical reasoning. A prediction was generated hourly on all admissions, providing a new variable was registered. Compared to the National Early Warning Score (NEWS2), which is an established method to identify sepsis, the SepsisFinder triggered earlier and had a higher area under receiver operating characteristic curve (AUROC) (0.950 vs. 0.872), as well as area under precision-recall curve (APR) (0.189 vs. 0.149). A machine learning comparator based on a gradient-boosting decision tree model had similar AUROC (0.949) and higher APR (0.239) than SepsisFinder but triggered later than both NEWS2 and SepsisFinder. The precision of SepsisFinder increased if screening was restricted to the earlier admission period and in episodes with bloodstream infection. Furthermore, the SepsisFinder signaled median 5.5 h prior to antibiotic administration. Identifying a high-risk population with this method could be used to tailor clinical interventions and improve patient care.


Conflict of interest statement

LW and MLM are employees of Treat Systems ApS (Aalborg, Denmark) and owns shares in the company. Treat Systems produces medical decision support systems for antimicrobial and microbiological diagnostic stewardship, however SepsisFinder is currently not used for the purpose of sepsis screening. The other authors declare no competing interests.

Figures

Figure 1
Figure 1
The concept of the sepsis prediction algorithm. The black line represents the SepsisFinder model with predictions marked by black dots. The red dot represents positive alarms. The grey line and dots illustrate silencing 48 h after positive alarms. The alarm threshold is illustrated by the dotted line. The red shaded area represents the time window for considering true positive alarms or false negative predictions. All predictions crossing the alarm threshold outside of the red shaded area were considered false positives. Predictions occurring below the alarm threshold and outside of the red shaded area represent true negative predictions. The upper panel represents a hospital episode with sepsis, but without any positive predictions and only a false negative prediction in the red shaded area. The middle panel shows an episode without sepsis, but with one false positive prediction and several true negative predictions. The lower panel represents a hospital episode with sepsis where both one false positive alarm and one true positive alarm were registered, with model explanations shown below the risk score trace at two selected points: the lowest score in the episode and the first alarm. The explanation plots show the Bayes Factor contributions of the evidence available at the respective times. In the model explanation plots, the blue bars show the degree to which a measurement increases the risk score, while the red bars show the degree to which the risk score is reduced. The Bayes Factor is defined as the ratio of the posterior and prior odds ratios e.g. B=P(x|ε)/P(y|ε)P(x)/P(y) where x is the hypothesis (e.g. sepsis), y is the alternative hypothesis (e.g. no sepsis) and ε is the evidence, or a subset thereof. Respiratory rate (RR), heart rate (HR), mean arterial pressure (MAP), c-reactive protein (CRP).
Figure 2
Figure 2
The discriminative performance of the algorithms in the validation set. The left panel shows a receiver operating characteristic curve, and the right panel shows a precision recall curve for the prediction of sepsis within 48 h using SepsisFinder (blue line), the NEWS2 (green line) and the GBDT model (yellow line). Operating alarm thresholds corresponding to NEWS2 equal to 5 and 7 points have been marked for both scores. For SepsisFinder and GBDT, an additional alarm threshold corresponding to approximately 85% sensitivity has been marked. The blue shaded area illustrates the suggested clinically applicable region, and the grey shaded area illustrates the suggested clinically inapplicable region (specificity < 90% and precision < 15%) of model performance. SepsisFinder (SF), Area Under Receiver Operating Characteristic curve (AUC), Area Under Precision Recall curve (APR), National Early Warning Score 2 (NEWS2), and gradient-boosting decision tree (GBDT).
Figure 3
Figure 3
Performance of SepsisFinder in episodes where a sepsis event occurred based on fixed time points 24 h before sepsis onset for three operationalized alarm thresholds. The alarm thresholds were chosen based on sensitivity (recall) matched to NEWS2 equal to 5 points (sensitivity 20%) and 7 points (sensitivity 42%) as well as sensitivity 85%. Since sepsis occurred at all times from admission to discharge, and predictions were only based on data from the current hospital episode, a dotted line has been added to represents the detectable limit for sepsis onset. National Early Warning Score 2 (NEWS2), Recall (Rec), Hours (h), Precision/positive predictive value (Prec).

References

    1. Rudd KE, et al. Global, regional, and national sepsis incidence and mortality, 1990–2017: Analysis for the global burden of disease study. Lancet. 2020;395:200–211. doi: 10.1016/S0140-6736(19)32989-7. - DOI - PMC - PubMed
    1. Ferrer R, et al. Empiric antibiotic treatment reduces mortality in severe sepsis and septic shock from the first hour. Crit. Care Med. 2014;42:1749–1755. doi: 10.1097/CCM.0000000000000330. - DOI - PubMed
    1. Seymour CW, et al. Time to treatment and mortality during mandated emergency care for sepsis. N. Engl. J. Med. 2017;376:2235–2244. doi: 10.1056/NEJMoa1703058. - DOI - PMC - PubMed
    1. Van Heuverswyn J, et al. Association between time to appropriate antimicrobial treatment and 30-day mortality in patients with bloodstream infections: a retrospective cohort study. Clin. Infect. Dis. 2022 doi: 10.1093/cid/ciac727. - DOI - PMC - PubMed
    1. Evans L, et al. Surviving sepsis campaign: international guidelines for management of sepsis and septic shock 2021. Intensive Care Med. 2021;47:1181–1247. doi: 10.1007/s00134-021-06506-y. - DOI - PMC - PubMed

Publication types