. 2023 Jul 20;14(1):4394.
doi: 10.1038/s41467-023-40113-3.

Age-related self-DNA accumulation may accelerate arthritis in rats and in human rheumatoid arthritis

Affiliations

Age-related self-DNA accumulation may accelerate arthritis in rats and in human rheumatoid arthritis

Wei-Dan Luo et al. Nat Commun. .

Abstract

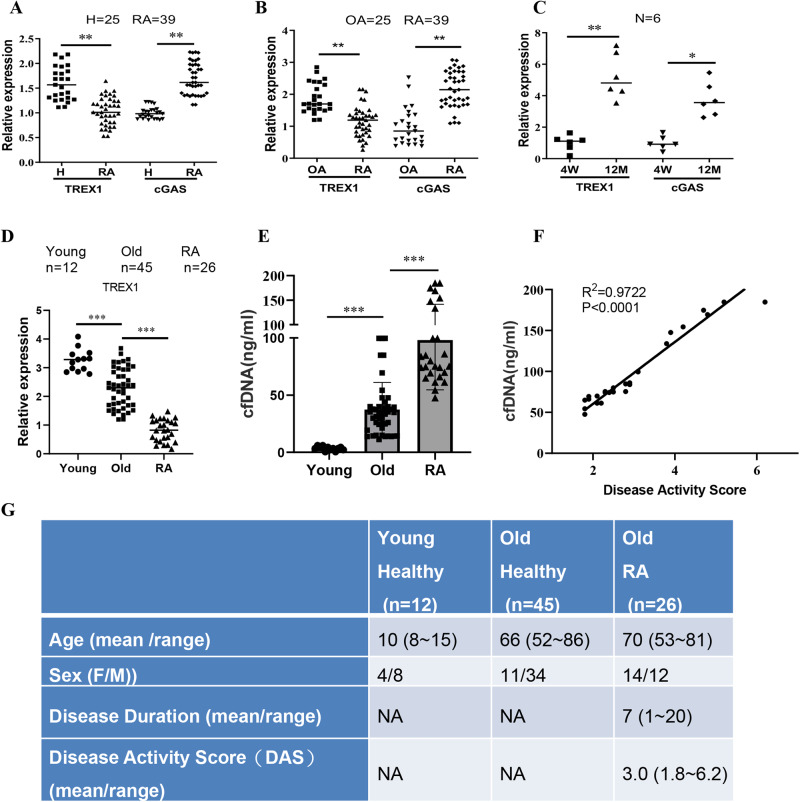
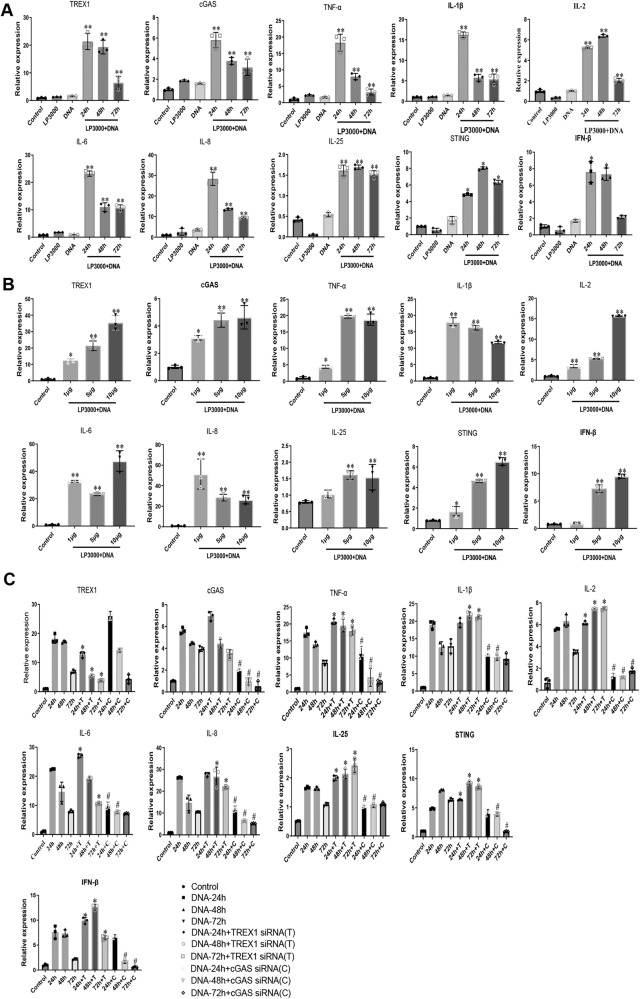
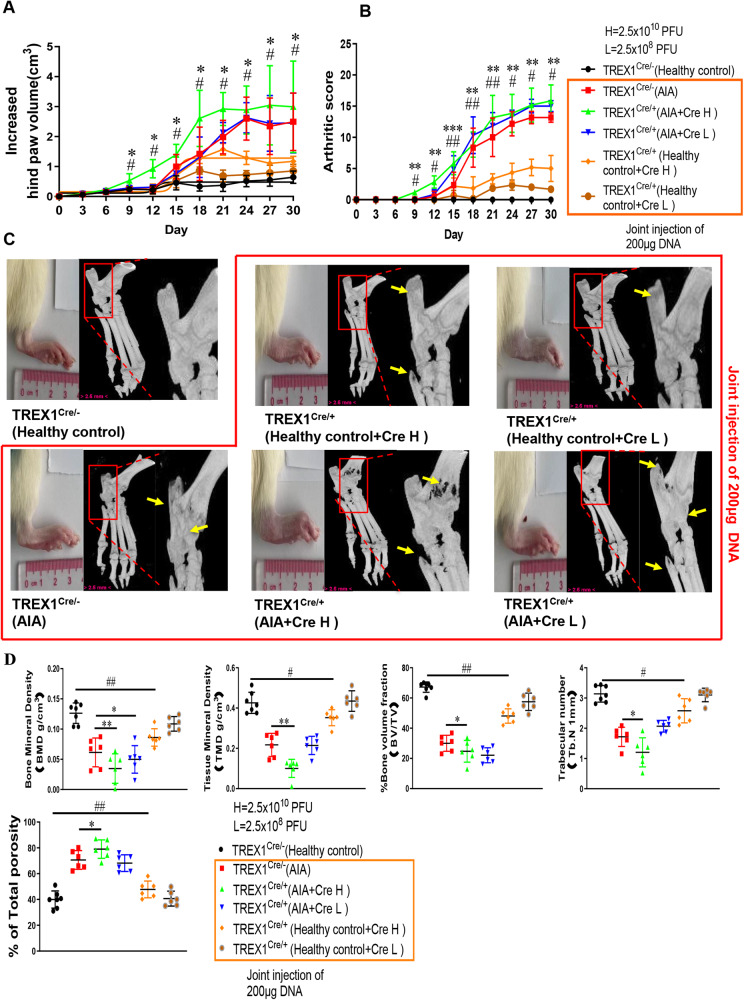
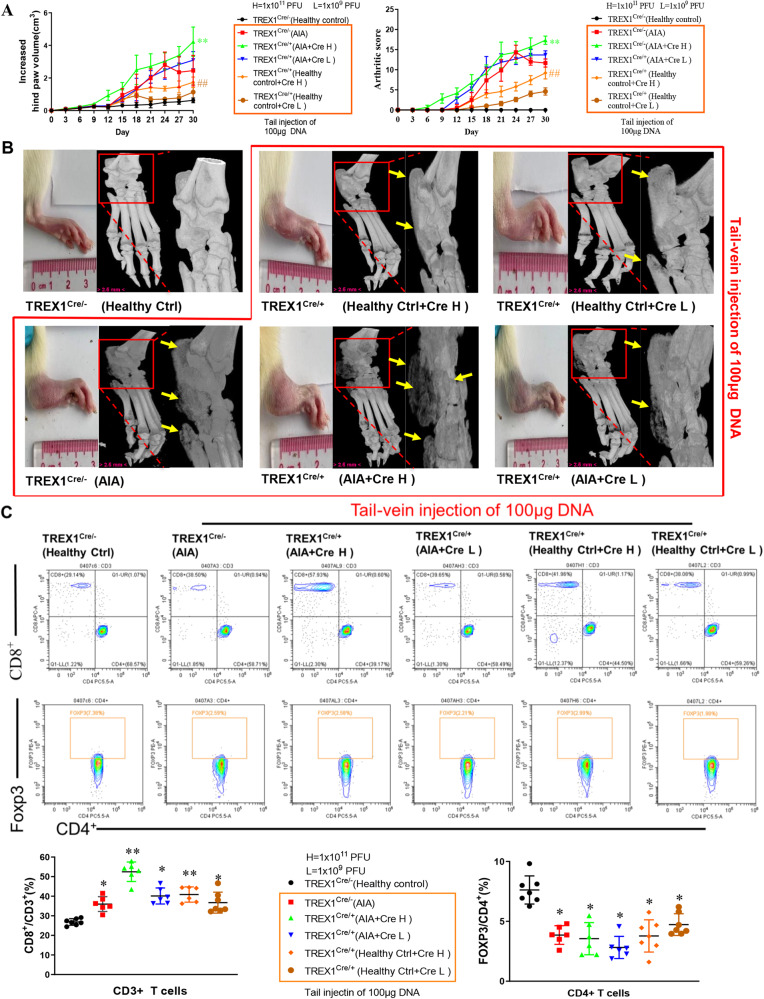
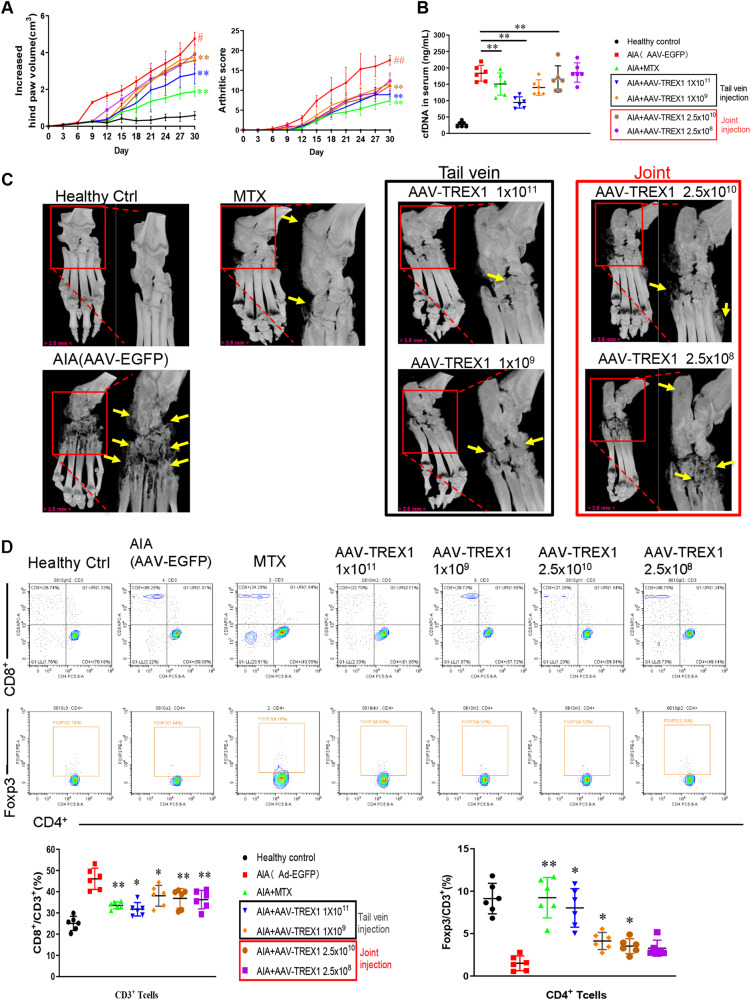
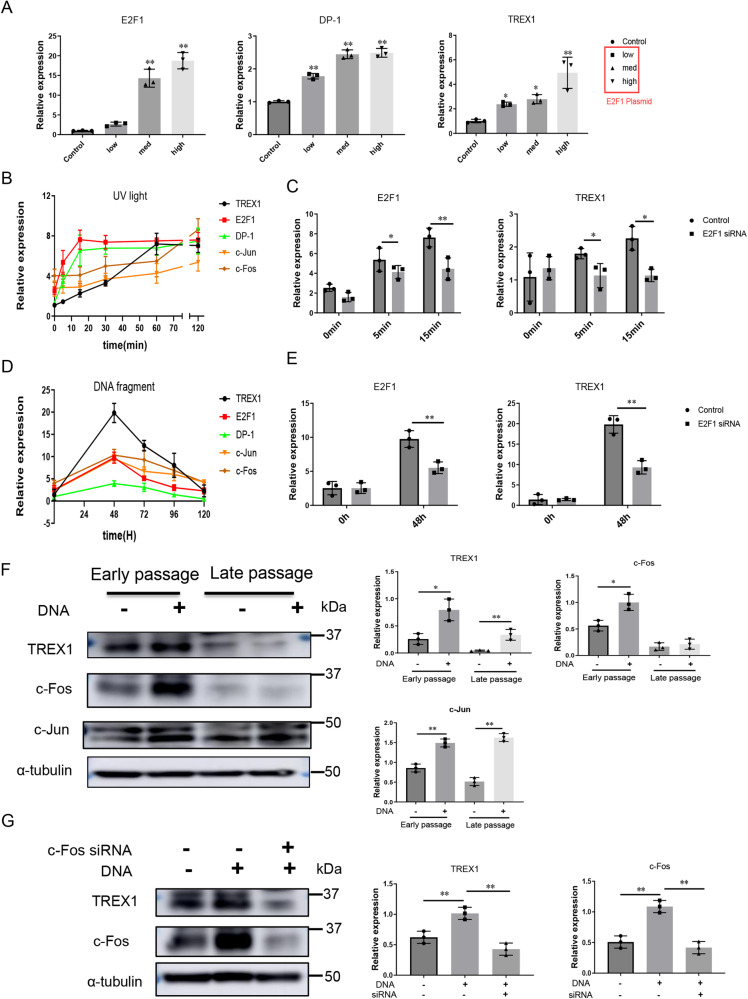
The incidence of rheumatoid arthritis (RA) is increasing with age. DNA fragments is known to accumulate in certain autoimmune diseases, but the mechanistic relationship among ageing, DNA fragments and RA pathogenesis remain unexplored. Here we show that the accumulation of DNA fragments, increasing with age and regulated by the exonuclease TREX1, promotes abnormal activation of the immune system in an adjuvant-induced arthritis (AIA) rat model. Local overexpression of TREX1 suppresses synovial inflammation in rats, while conditional genomic deletion of TREX1 in AIA rats result in higher levels of circulating free (cf) DNA and hence abnormal immune activation, leading to more severe symptoms. The dysregulation of the heterodimeric transcription factor AP-1, formed by c-Jun and c-Fos, appear to regulate both TREX1 expression and SASP induction. Thus, our results confirm that DNA fragments are inflammatory mediators, and TREX1, downstream of AP-1, may serve as regulator of cellular immunity in health and in RA.


Conflict of interest statement

The authors declare no competing interests.

Figures

Fig. 1
Fig. 1. Correlation of TREX1 and cGAS expression in the production of inflammatory cytokines in rheumatoid arthritis (RA) patients and RA-FLSs stimulated with DNA fragments.
A Gene expression levels of TREX1 and cGAS in healthy volunteers (n = 25) versus patients with RA (n = 39). B Gene expression levels of TREX1 and cGAS in patients with osteoarthritis (OA) (n = 25) versus patients with RA (n = 39). The values in the bar chart are the means ± s.e.m.; **P < 0.01. C Gene expression levels of TREX1 and cGAS in peripheral blood samples from young (4 weeks) and aged (>12 months) rats (n = 6). D The mRNA expression levels of TREX1 and (E) the cfDNA concentrations in the peripheral blood serum of healthy children (n = 12), healthy elderly (n = 45), and elderly patients with RA (n = 26). F Correlative analysis of disease activity scores (DAS) of elderly patients with RA and their serum cfDNA concentrations. In the correlative analysis, results shows a significant medium positive correlation between DAS and serum cfDNA concentrations in which the correlation coefficient was derived as 0.9722 and p < 0.0001. G Detailed information of clinical samples used in (D~F). All the samples are biologically independent, and in A-E, the statistical significance was calculated by t-test, **P < 0.01, ***P < 0.001. Data are presented as mean ± s.e.m.
Fig. 2
Fig. 2. Gene expression analysis of TREX1, cGAS and inflammatory cytokines in DNA-stimulated RA-FLSs transfected with or without TREX1 or cGAS siRNA.
A Time-dependent activation of the TREX1 and cGAS signalling pathways induced by DNA fragments. RA-FLSs were transfected with 5 μg of DNA fragments (sonicated DNA from RA-FLSs) for 24–72 h in the absence or presence of Lipofectamine 3000. Transfected RA-FLSs were then harvested for gene expression analysis of TREX1, cGAS and inflammatory cytokines using RT–PCR. All samples are biologically independent, and statistical significance was analyzed by one-way ANOVA, *P < 0.05, **P < 0.01 versus control groups. Data are presented as the mean ± s.e.m from three independent experiments. B Dose-dependent activation of the TREX1 and cGAS signaling pathways by DNA fragments. RA-FLSs were transfected with different amounts of DNA fragments (1 μg, 5 μg and 10 μg) in the presence of Lipofectamine 3000 for 24 h. Transfected RA-FLSs were then harvested for gene expression analysis of TREX1, cGAS and inflammatory cytokines using RT–PCR. All samples are biologically independent, and statistical significance was calculated by one-way ANOVA, *P < 0.05, **P < 0.01 versus control groups. Data are presented as the mean ± s.e.m. from three independent experiments. C Knockdown of TREX1 or cGAS reversed the time-dependent activation of the TREX1 and cGAS signalling pathways in DNA fragment-stimulated RA-FLSs. RA-FLSs were transfected with TREX1 siRNA or cGAS siRNA for knockdown of the corresponding gene 24 h prior to treatment with DNA fragments. Knockdown cells were then transfected with 5 μg of DNA fragments for 24–72 h. Transfected cells were then harvested and analysed by RT–PCR to determine the mRNA expression of inflammatory cytokines. All samples are biologically independent, and statistical significance was calculated by one-way ANOVA, *P < 0.05 for TREX1 knockdown cells compared with cells transfected with DNA fragments alone; #P < 0.05 for cGAS knockdown cells compared with cells transfected with DNA fragments alone. Data are presented as mean ± s.e.m. from three independent experiments. (T: TREX1 siRNA; C: cGAS siRNA).
Fig. 3
Fig. 3. The effect of joint injection of DNA fragments on exacerbating inflammation in the TREX1 conditional knockout (TREX1Cre) rat AIA model.
A, B Hind paw swelling and arthritis scores in DNA fragment-injected AIA model TREX1Cre rats. Rats in the three healthy control TREX1Cre groups and the three AIA model TREX1Cre groups were injected in the knee joint cavity with nucleic acid-free water or DNA fragments (200 μg), respectively, together with Cre adeno-associated virus (2.5 × 10⁸ PFU (Cre L) or 2.5 × 10¹⁰ PFU (Cre H)), and monitored for 30 days. Hind paw volumes (ml) and arthritis scores were determined every 3 days. Hind paw swelling was photographed on Day 30. All samples are biologically independent, and statistical significance was calculated by t-test, #P < 0.05, ##P < 0.01 for healthy control TREX1Cre/+ rats with CreH/DNA compared with healthy control TREX1Cre/- rats; *p < 0.05, **p < 0.01, ***p < 0.001 for AIA model TREX1Cre/+ rats with CreH/DNA compared with AIA model TREX1Cre/- rats. Data are presented as the mean ± s.e.m. (Healthy control: n = 7, other groups: n = 6). C 3D Micro-CT images of damaged swollen joints bone were reconstructed using Inveon Research Workplace with a resolution of 19 μm. Various degrees of bone destruction are shown in the red box with enlarged images. The yellow arrows indicate the region of bone destruction. D Micro-CT scores of the bone destruction extent were calculated from five disease‐related indices: bone mineral density (BMD), trabecular number (mm-1) (Tb. N), cortical bone tissue mineral density (g/cm3) (TMD), bone volume fraction (BV/TV), and total porosity (as a percentage of total area). All the samples are biologically independent, and statistical significance was calculated by one-way ANOVA, #p < 0.05, ##p < 0.01 for healthy control TREX1Cre/+ rats with CreH/DNA compared with healthy control TREX1Cre/- rats; *p < 0.05, **p < 0.01 for AIA model TREX1Cre/+ rats with CreH/DNA or CreL/DNA compared with AIA model TREX1Cre/- rats. Data are presented as the mean ± s.e.m. (Healthy control: n = 7, other groups: n = 6).
Fig. 4
Fig. 4. The effect of tail vein injection of DNA fragments on exacerbating inflammation in the TREX1Cre rat AIA model.
A Hind paw swelling and arthritis scores in AIA model TREX1Cre rats with tail vein injection of DNA fragments. All the samples are biologically independent, and statistical significance was calculated by t-test, ##P < 0.01 for healthy control+CreH group compared with the healthy control group; **P < 0.01 for AIA +CreH group compared with AIA group. Data are presented as the mean ± s.e.m. (Healthy control,Ctrl+Cre H, Ctrl+Cre L: n = 7,other groups: n = 6). B 3D Micro-CT images of damaged swollen joints’bone were reconstructed using Inveon Research Workplace with resolution of 19 μm. Various degrees of bone destruction are shown in the red box with enlarged images. The yellow arrows indicate the region of bone destruction (Healthy control, Ctrl+Cre H, Ctrl+Cre L: n = 7, other groups: n = 6). C Immunological effect of tail vein injection of DNA fragments in AIA model TREX1Cre rats. After the rats in the three healthy control TREX1Cre groups and the three AIA model TREX1Cre groups were injected via the tail vein with DNA fragments (100 μg) together with Cre adeno-associated virus (1 × 10⁹ PFU (Cre L) or 1 × 10¹¹ PFU (Cre H)) and monitored for 30 days, blood lymphocytes were harvested from these animals for flow cytometric analysis of T-cell activation using fluorescent antibodies against CD45, CD3, CD4, CD8, and Foxp3. Representative flow charts for the purification of CD8+ cells gated on CD3+ T lymphocytes and Foxp3 cells gated on CD4+ T lymphocytes from Peyer’s patches (PPs). The quantitative bar charts show the percentage of CD8+ T cells amsong CD3+ T cells and the percentage of Foxp3+ Treg cells among CD4+ T cells. All the samples are biologically independent, and statistical significance was calculated by one-way ANOVA, *p < 0.05, **p < 0.01 versus the healthy control group. Data are presented as the mean ± s.e.m. (Healthy control, Ctrl+Cre H, Ctrl+Cre L: n = 7, other groups: n = 6).
Fig. 5
Fig. 5. The anti-inflammatory role of TREX1 in AIA rats.
A Hind paw volumes and arthritis scores in AIA rats with AAV-mediated TREX1 overexpression. Healthy control and AIA rats were treated with vehicle control, the positive control drug (7.6 mg/kg/week MTX), AAV-TREX1 (1 × 1011 or 1 × 109 PFU) by tail vein injection 10 days before AIA induction or with AAV-TREX1 (2.5 × 1010 or 2.5 × 108 PFU) by joint injection 10 days before AIA induction. Arthritis scores and hind paw volumes were measured every 3 days. All the samples are biologically independent, and statistical significance was calculated by one-way ANOVA, **p < 0.01 versus the AIA group, #p < 0.05, ##p < 0.01 for the AIA group compared with the healthy control group. Data are presented as the mean ± s.e.m. (n = 6 in all groups). B Changes in the cfDNA concentration in the serum of AIA rats with AAV-mediated TREX1 overexpression. On Day 30, the amount of cfDNA in serum from all treatment groups was measured. The amount of cfDNA in each treatment group was quantified as well. All samples are biologically independent, and statistical significance was calculated by one-way ANOVA, **p < 0.01 versus the AIA group. Data are presented as the mean ± s.e.m. (All groups n = 6). C 3D Micro-CT images of damaged swollen joints’bone were reconstructed using Inveon Research Workplace with a resolution of 19 μm. Various degrees of bone destruction are shown in the red box with enlarged images. The yellow arrows indicate the region of bone destruction. D Immunomodulatory effect of TREX1 in AIA rats. For immunological analysis, blood lymphocytes were harvested from these animals for flow cytometric analysis of T-cell activation using fluorescent antibodies against CD45, CD3, CD4, CD8, and Foxp3. Representative flow charts for the purification of CD8+ cells gated on CD3+ T lymphocytes and Foxp3 cells gated on CD4+ T lymphocytes from Peyer’s patches (PPs). The quantitative bar charts show the percentage of CD8+ T cells among CD3+ T cells and the percentage of Foxp3+ Treg cells among CD4+ T cells. All samples are biologically independent, and statistical significance was calculated by one-way ANOVA, *p < 0.05, **p < 0.01 versus the AIA group. Data are presented as the mean ± s.e.m. (All groups n = 6).
Fig. 6
Fig. 6. Transcriptional regulation of TREX1 via E2F1 signalling and the balance of c-Jun/c-Fos.
A The expression levels of TREX1 and DP-1 in RA-FLSs overexpressing the transcription factor E2F1. RA-FLS were transfected with the E2F1 plasmid for 48 h. All samples are biologically independent, and statistical significance was calculated by one-way ANOVA, **P < 0.01 versus control groups. Data are presented as the mean ± s.e.m. from three independent experiments. B Gene expression profiles of TREX1, E2F1, DP-1, c-Jun and c-Fos in RA-FLSs exposed to UV light for different durations. C Role of E2F1 in the transcriptional regulation of TREX1 in UV-stimulated cells. RA-FLSs with siRNA-mediated E2F1 silencing were exposed to UV light for 0–15 min, and the gene expression levels of E2F1 and TREX1 were determined by RT–PCR. D Gene expression profiles of TREX1, E2F1, DP-1, c-Jun and c-Fos in RA-FLSs stimulated with DNA fragments. E Knockdown of E2F1 inhibited TREX1 activation in RA-FLSs transfected with DNA fragments. RA-FLSs with siRNA-mediated E2F1 silencing were transfected with 5 μg of DNA fragments for 48 h. F Presenescent RA-FLSs were rendered senescent by repeated passaging to late passages. Both early- and late-passage RA-FLSs were transfected with 5 μg of DNA fragments for 48 h. G Knockdown of c-Fos inhibited the activation of TREX1 in RA-FLSs transfected with DNA fragments. RA-FLSs with siRNA-mediated c-Fos silencing were transfected with 5 μg of DNA fragments for 48 h. In (B) and (D), all data were presented as the mean ± s.e.m. from three independent experiments. In (C) and (E), all samples are biologically independent, and statistical significance was calculated by t-test, *P < 0.05, **P < 0.01 between two groups. Data are presented as the mean ± s.e.m. from three independent experiments. In (F) and (G), the bar charts show the quantification of target protein expression relative to tubulin expression using ImageJ software. All samples are biologically independent, and statistical significance was calculated by t-test, **P < 0.01 between the two groups. Data are presented as the mean ± s.e.m. from three independent experiments. All samples are derived from the same experiment and the gels/blots were processed in parallel.

References

    1. Smolen JS, Aletaha D, McInnes IB. Rheumatoid arthritis. Lancet. 2016;388:2023–2038. doi: 10.1016/S0140-6736(16)30173-8. - DOI - PubMed
    1. Myasoedova E, Davis J, Matteson EL, Crowson CS. Is the epidemiology of rheumatoid arthritis changing? Results from a population-based incidence study, 1985-2014. Annals Rheumatic Dis. 2020;79:440–444. doi: 10.1136/annrheumdis-2019-216694. - DOI - PMC - PubMed
    1. Tchkonia T, Zhu Y, van Deursen J, Campisi J, Kirkland JL. Cellular senescence and the senescent secretory phenotype: therapeutic opportunities. J. Clin. Investig. 2013;123:966–972. doi: 10.1172/JCI64098. - DOI - PMC - PubMed
    1. Tchkonia T, Kirkland JL. Aging, cell senescence, and chronic disease emerging therapeutic strategies. J. Am. Med. Assoc. 2018;320:1319–1320. doi: 10.1001/jama.2018.12440. - DOI - PubMed
    1. Ferrucci L, Fabbri E. Inflammageing: chronic inflammation in ageing, cardiovascular disease, and frailty. Nat. Rev. Cardiol. 2018;15:505–522. doi: 10.1038/s41569-018-0064-2. - DOI - PMC - PubMed

Publication types

Substances