. 2023 Aug;24(8):1295-1307.
doi: 10.1038/s41590-023-01549-3. Epub 2023 Jul 20.

ThPOK is a critical multifaceted regulator of myeloid lineage development

Affiliations

ThPOK is a critical multifaceted regulator of myeloid lineage development

Jayati Basu et al. Nat Immunol. 2023 Aug.

Abstract

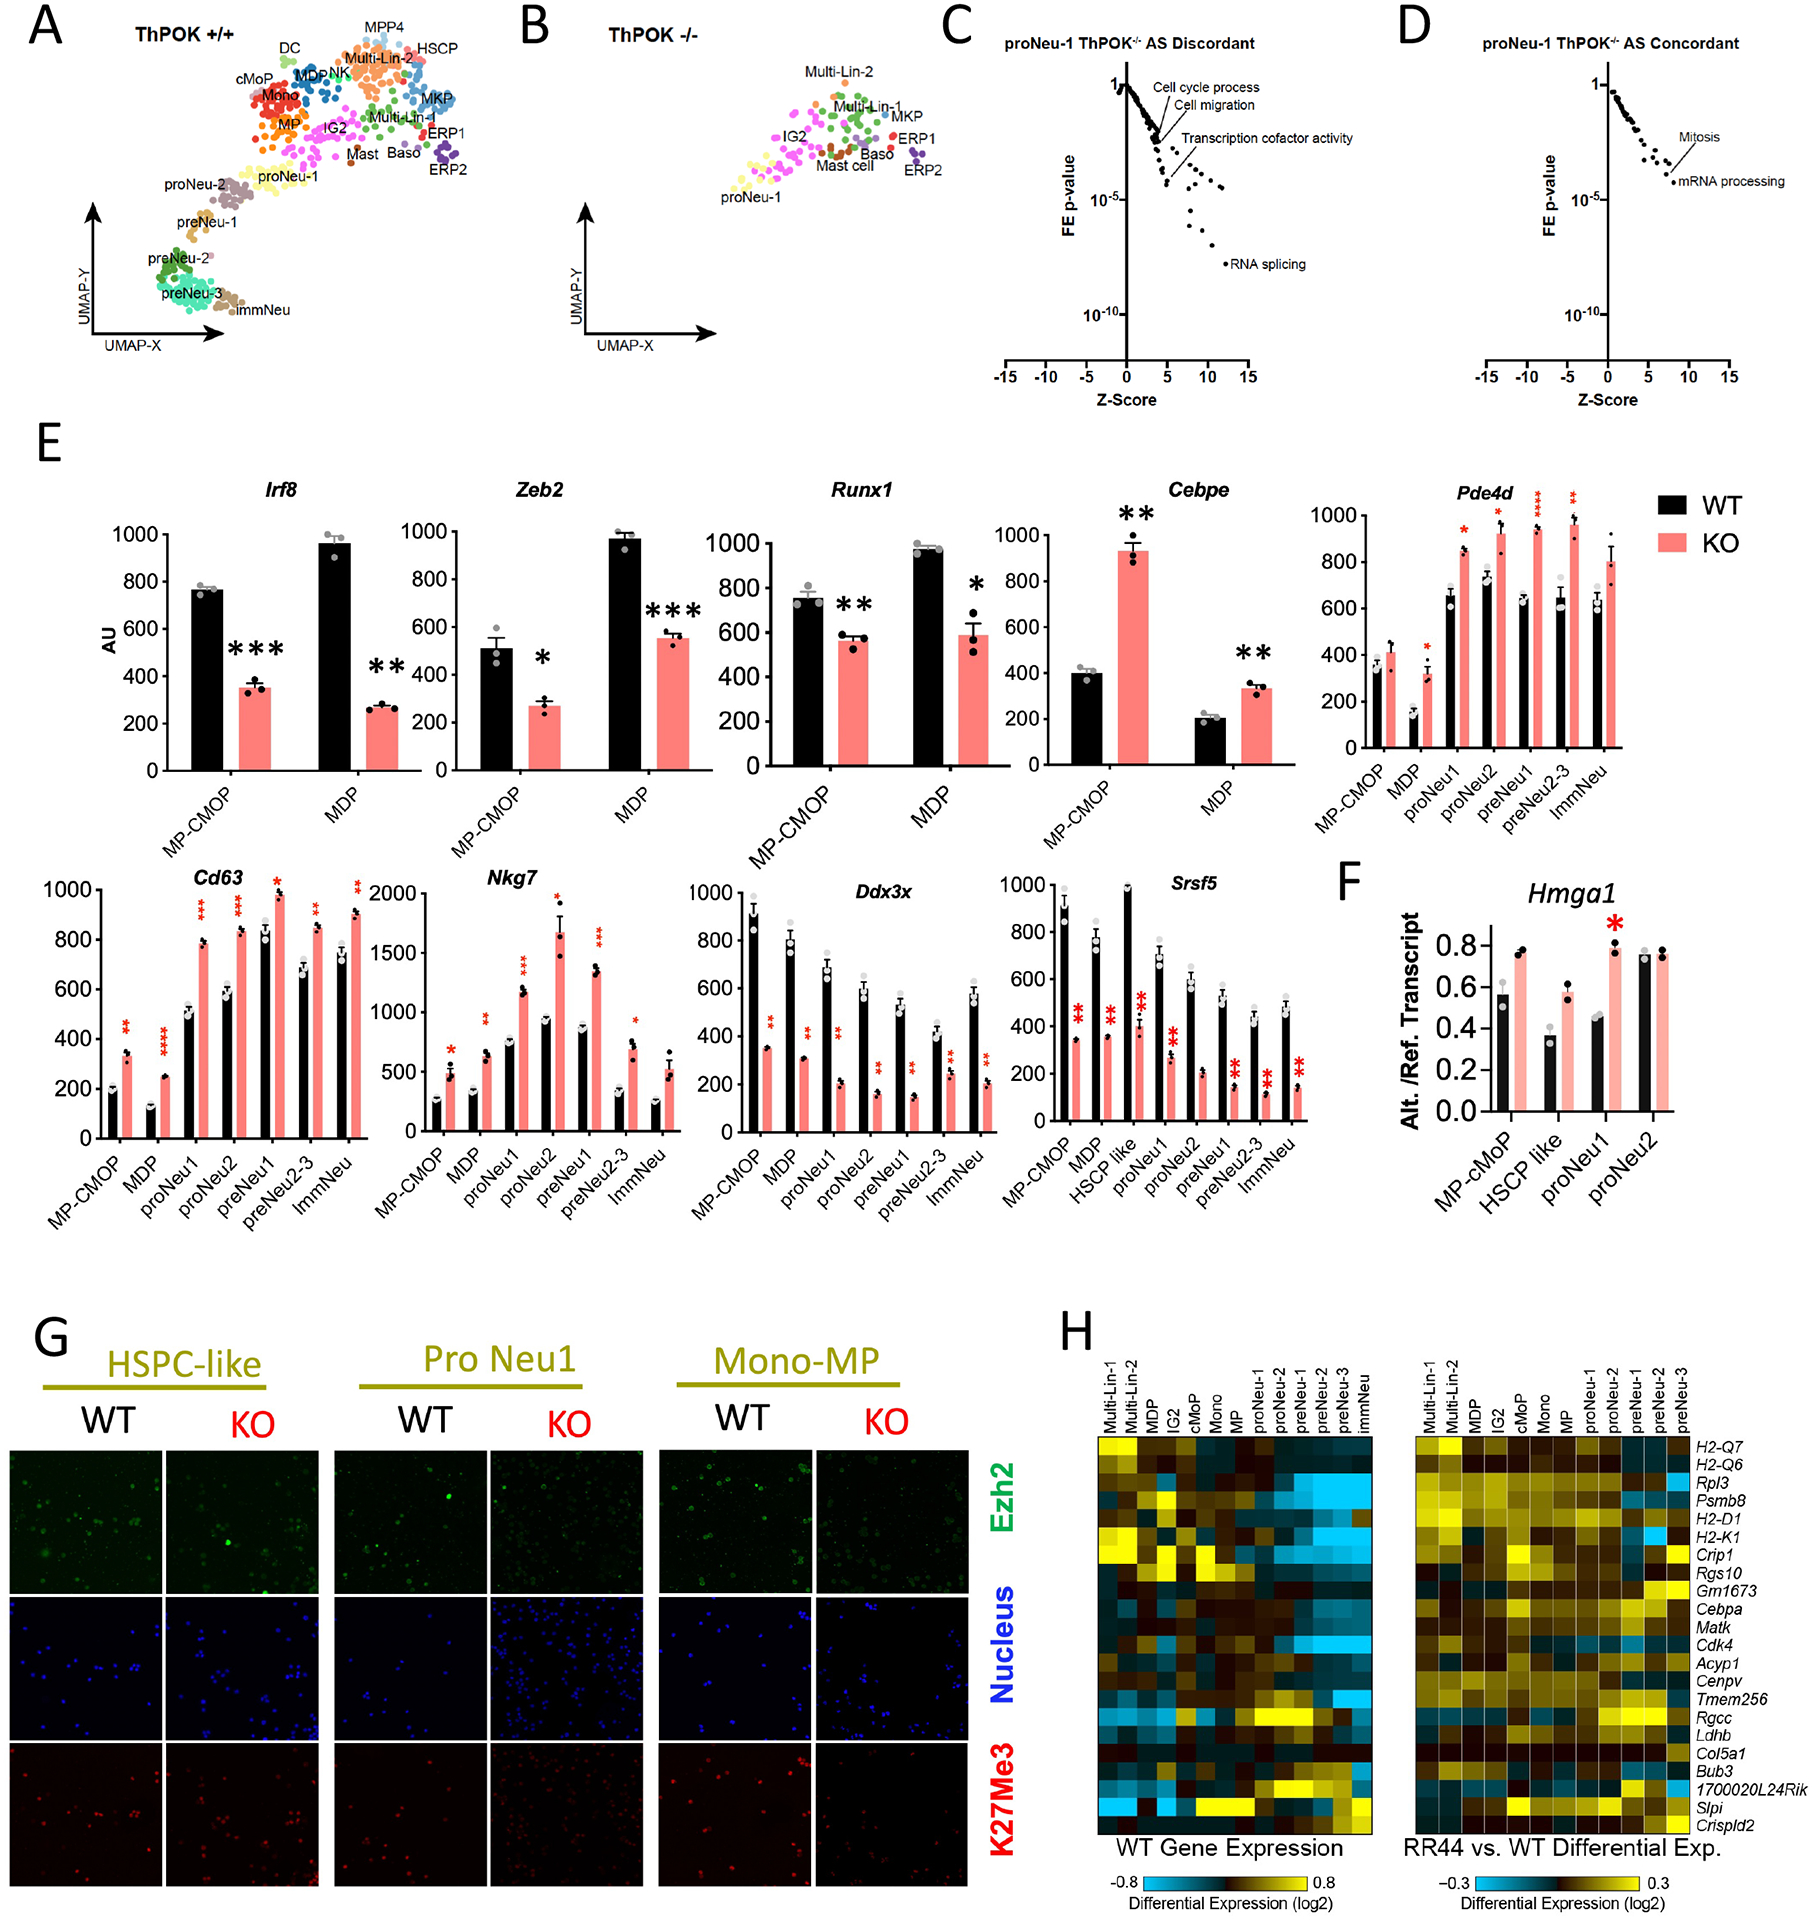
The transcription factor ThPOK (encoded by Zbtb7b) is well known for its role as a master regulator of CD4 lineage commitment in the thymus. Here, we report an unexpected and critical role of ThPOK as a multifaceted regulator of myeloid lineage commitment, differentiation and maturation. Using reporter and knockout mouse models combined with single-cell RNA-sequencing, progenitor transfer and colony assays, we show that ThPOK controls monocyte-dendritic cell versus granulocyte lineage production during homeostatic differentiation, and serves as a brake for neutrophil maturation in granulocyte lineage-specified cells through transcriptional regulation of lineage-specific transcription factors and RNA via altered messenger RNA splicing to reprogram intron retention.


Conflict of interest statement

Competing Interests Statement: The authors declare no competing interests.

Figures

Extended data Fig. 1.
Extended data Fig. 1.. ThPOK deficiency alters neutrophil and monocyte subset distribution.
a) Gating strategy to reveal neutrophil maturation and differentiation status, according to indicated markers. b) Cell-population percentages and absolute cell numbers of indicated neutrophil subsets from indicated organs of wt versus ThPOK-deficient mice (based on gating strategy in panel a). Data are displayed as mean ± SEM. *P < 0.05; **P < 0.01; ***P < 0.001; ****P < 0.0001. Significant differences were determined by two-sided unpaired t test. c) Histological examination of flow sorted (Ly6g+CD11b+) blood neutrophils. Cytospins of neutrophils from WT or ThPOK−/− mice were treated with Wright’s stain and examined with a light microscope. The experiment was repeated 3 times independently with similar results. d) FACS analysis of CD11b+ Ly6g-CD115+F4/80- cells from indicated organs from WT and ThPOK−/− mice (left panels). Note increase in Ly6c+ classical monocytes in ThPOK-deficient compared to WT mice in BM. Plots showing total number of indicated gated populations in indicated organ in ThPOK-deficient compared to WT mice (right panels; same mice as in FACS panels). Error bars represent standard deviations. e) Plots showing frequency (top panels) or cell number (bottom panels) of T cells, NK cells, B cells, and DCs in BM, blood and spleen of ThPOK-deficient or WT mice. Significant differences between ThPOK−/− and WT mice were determined by unpaired T test with Welchs correction, and indicated by asterisks (* p < 0.05; ** p < 0.01; *** p < 0.001).
Extended data Fig. 2.
Extended data Fig. 2.. ThPOK deficiency perturbs selective neutrophil functions.
a) Neutrophil surface marker expression (n=3) (Top 1st panel from left), phagocytosis [data expressed as geometric Mean Fluorescent Intensity (MFI) ± SEM (n=3)] (Top 2nd panel), PMA-mediated ROS production using dihydrorhodamine 123 (DHR) [data are shown as geometric means ± SEM (n = 4)] (Top 3rd panel), Myeloperoxidase release (n=5) (Top 4th panel), NET associated elastase release (n=5 for wt and n=3 for ThPOK−/− neutrophil, respectively) (Bottom left panel), and cytokine/chemokine release upon in vitro stimulation (N=6) (Bottom right panel). Data are representative of three independent experiments. Significance was calculated by two-sided unpaired T-test with Welch’s correction (*p < 0.05; ***p < 0.001). b) Absolute numbers of total neutrophils or indicated subsets from airpouch lavage of wt versus ThPOK-deficient mice, 14hrs after injection of E. coli or PBS into airpouch (top left, top 2nd from left, and bottom left panels). Same mice were used to assess phagocytosis by pHrodo green E. coli incorporation [geometric MFI ± SEM (n=3)] (bottom 2nd from left panel), ROS production [geometric means ± SEM (n = 3)] (top right panel), Myeloperoxidase release (n=3) (bottom right panel), NET associated elastase release (n=3) (center right panel), and Citrullinated H3 (CitH3) release (Top 2nd from right panel) for airpouch lavage, serum and plasma samples from the same mice. Significance was calculated by two-sided unpaired T-test with Welch’s correction (*p < 0.05; **p < 0.01; ***p < 0.001). c) Frequency (bottom panels) or cell number (top panels) of indicated subsets in WT or ThPOK-deficient mice 16hrs after sepsis induction or normal saline administration. Significant differences were determined by one way ANOVA posthoc Bonferroni’s multiple comparison test (*p < 0.05; **p < 0.01; ***p < 0.001). d) Same mice as in panel c were assessed for ROS production [geometric means ± SEM (n = 4)] (top right panel), Myeloperoxidase release (n=4) (bottom left panel), NET associated elastase release (n=4) (center left panel), and Citrullinated H3 (CitH3) release (top left panel). Assays were performed for blood serum and plasma samples from the same mice (top, middle and bottom panels in center). e) Cytokine/chemokine levels in peritoneal lavage, blood serum and plasma of ThPOK−/− and WT mice 14hrs after sepsis induction (N=4). Significance was calculated by one way ANOVA posthoc Bonferroni’s multiple comparisons test (* p < 0.05; **p < 0.01; ***p < 0.001; **** p < 0.0001). f) H&E staining of tissue sections from indicated organ 16hrs after sepsis induction. Images shown are representative of 6 mice/genotype. The experiment was repeated 3 times with similar results.
Extended data Fig. 3.
Extended data Fig. 3.. ThPOK expression and effect of ThPOK deficiency on gene expression.
a) GFP expression by indicated subsets from ThPOK-GFP reporter mice. GFP expression level is color-coded according to heat-scale below each plot. b) Gating strategy to reveal granulocyte-monocyte lineage development (according to REF 17). Red arrows indicate sequential gates. c) Unsupervised clustering (viSNE) of cells in the modified-GMP gate (upper left). Other panels show expression of indicated surface marker superimposed on the same clusters. d) GFP protein (top), GFP mRNA (center), and endogenous ThPOK mRNA levels, in indicated progenitor subsets sorted according to gating strategy in (b), as well as indicated control T cell populations from transgenic ThPOK-GFP reporter mice. e) Competitive reconstitution assay with WT and ThPOK−/− BM cells (same experiment as depicted in Fig. 1J) (n = 6, per genotype). Relative contribution to indicated BM populations was assessed at 6 months post-transplant. Data are normalized for only donor cells, so that the sum of WT and KO donor cells equals 100%. Two sided unpaired T test with Welch’s Correction was performed. Data are displayed as mean ± SEM (*P < 0.05; **P < 0.01; ***P <0.001; ****P < 0.0001). f) Cell cycle analyses of indicated gated subsets in WT and ThPOK −/− BM 20h after a single in vivo BrdU pulse. Representative FACS plots of BM subsets from PBS-injected WT controls (BrdU-), or WT and ThPOK−/− mice that received BrdU, as indicated (right panels). Cell cycle stages were defined by flow cytometry based on BrDU intensity and DNA content (7-AAD staining), as indicated. Bar graphs at left summarize the results for indicated progenitor populations, expressed as means ± SEM (n=3 independent animals per genotype) and are representative of two experiments. Two sided unpaired T-test with Welch’s Correction was performed (*p < 0.05; **p < 0.01; *** p < 0.001).
Extended data Fig. 4.
Extended data Fig. 4.. ThPOK loss does not affect MDP development:
a) Bar graphs showing absolute cell numbers for CMP, GMP, MEP and CD34lo subsets among gated cKit+ Sca1- Lin- BM cells from ThPOK-deficient or WT mice (same mice as Fig. 2 A, B) (n = 5 independent animals per genotype). Error bars represent SEM. Significant differences between ThPOK−/− and WT mice were determined by two-sided unpaired T test with Welch’s correction, and indicated by asterisks (* p < 0.05; ** p < 0.01; *** p < 0.001). b) FACS analysis of CD135 and CD115 expression by gated CMPs from WT and ThPOK−/− mice (left panels). Bar graph at right shows % of indicated gated subsets (n = 5 independent animals per genotype). c) FACS analysis of CD11b, CD115, Ly6c, and Ly6g expression by gated cGMP (conventional GMP) (grey histograms) and c-Kit+ CD34lo CD16hi Lin- (green histograms) BM subsets from WT mice. d) FACS analysis of CD16/32 and CD34 expression by gated Lin- c-Kit+ Sca1- BM cells from ThPOPK+/− mice. CMP, GMP, MEP and CD34lo subsets are marked. e) CFU assay of FACS-sorted Lin- BM cells, from indicated WT or ThPOK-deficient mice. Error bars represent SEM. Significant differences between ThPOK−/− and WT mice were determined by two-sided multiple multiple unpaired T with Welch’s correction, and indicated by asterisks (* p < 0.05; ** p < 0.01; *** p < 0.001). Note that ThPOK−/− Lin- progenitors exhibited a substantial (** p < 0.01) increase in CFU-GM myeloid colony production even after secondary plating. f) FACS analysis of CD11b, Thy1, CD41 and Ter119 lineage marker expression by WT and ThPOK-deficient cells after secondary CFU assay (same experiment as in panel d).
Extended data Figure 5.
Extended data Figure 5.. Single-cell transcriptome analysis of ThPOK−/− and WT BM populations.
a) UMAP plot of curated cKit+ progenitor scRNA-Seq cell populations that serves as the reference for cellHarmony alignment analyses in these studies (see Methods), b) Flow cytometry selection of c-Kit+ BM C-GMP progenitors (gated cells denoted in blue). c) Unsupervised clustering UMAP plot of ~26,000 combined C-GMP CITE-Seq captured mRNA profiles (WT and ThPOK−/−) following analysis with the software ICGS2. Indicated cell-population labels are those automatically assigned by ICGS2 (AltAnalyze BioMarker database). d) UMAP plot of all WT and ThPOK−/− cells from panel c aligned to the reference described in panel a. e) UMAP plot from panel d showing the expression levels of ThPOK mRNA in the wild-type CITE-Seq populations. f) Cell-population percentage of distinct BM progenitor populations detected by CITE-Seq from WT and ThPOK−/− mice. g–h) Heatmap of relative normalized (TotalVI) CITE-Seq antibody derived-tag (ADT) intensities for cellHarmony cKit+ aligned cell populations. Panels (g) and (h) displays cells from WT and ThPOK−/− BM progenitors, respectively. i–p) Gene Ontology enrichment analyses from the software GO-Elite, for each of the indicated cell population differential expression analysis comparisons (all ThPOK−/− vs. WT).
Extended data Fig. 6.
Extended data Fig. 6.. ThPOK−/− impacts global splicing and cellular process networks:
(a–b) UMAP plot of single-cell Fluidigm RNA-Seq analysis of prior profiled (a) wild-type hematopoietic progenitors and (b) Ly6c-ThPOK−/− GMPs aligned to cKit+ CITE-Seq. Consistent alignment of cell populations in the UMAP space indicates a lack of apparent batch effects. c) Gene Ontology enrichment analysis of ThPOK−/− dependent alternative splicing events in proNeu-1 cells, for splicing events with the opposite pattern of exon inclusion in proNeu-1 versus MultiLin (discordant = more immature splicing) or (d) with the same pattern (concordant = promoting neutrophil specification associated splicing). (e‒f) Validation of deregulated gene expression in ThPOK−/− versus WT progenitors for important transcripts as observed in CITE seq data: e) qRTPCR analyses of indicated flow-sorted progenitors (pooled from 4 mice/genotype) for monocyte/DC genes (Irf8, Zeb2, Runx1), granulocyte lineage genes (Cebpe, Pde4d, Cd63 and Nkg7) and RNA binding protein genes (Ddx3x and Srsf5). The experiment was repeated 3 times independently with similar results. f) Expression ratio of Hmga1 alternate transcript versus reference transcript in indicated progenitor populations (pooled from 4 mice/genotype). g) Representative confocal micrographs of EZH2 protein (top), DAPI (middle), and H3K27Me3 (bottom) staining in indicated subsets. Each experiment was reproduced twice and significant differences between ThPOK−/− and WT mice were determined by two-sided unpaired T test with Welch’s correction, and indicated by asterisks (* p < 0.05; ** p < 0.01; *** p < 0.001). h) Heat maps showing relative mRNA expression of indicated genes in WT progenitors (left panel), or in ThPOK−/− versus WT progenitor subsets (right panel) for genes that are relatively up-regulated in any ThPOK−/− progenitor population and that are known Ezh2 targets in WT immune cells by ChIP-seq (GSE181873). Note that in WT mice most of these genes show marked stage-specific regulation.
Extended data Fig. 7.
Extended data Fig. 7.. ThPOK−/− progenitor transfer assays.
a) Gating strategy for isolation of GMPs and MDPs for in vitro and in vivo transfer studies. b) FACS analysis of Ly6g, CD11b, F4–80, CD115, Ly6c, and CD43 in blood of mice reconstituted with sorted GMPs from BM of WT or ThPOK−/− mice. Note substantial population of F4–80hi CD11b+ Ly6g- CD115+ macrophages in ThPOK-deficient versus WT mice (middle panels).
Extended data Fig. 8.
Extended data Fig. 8.. ThPOK−/− MDP exhibit neutrophil differentiation bias in vitro:
a) CFU assay of FACS-sorted CMP (lin- Kit+ Sca-CD34+ CD16/32-Flt3+CD115-) cells from WT and ThPOK KO mice, as indicated. Centre line refers to mean. b) Representative images of colony morphology after culture of WT or ThPOK KO MDPs in methyl cellulose (left), or of dissociated cells after Giemsa staining (right). Note increased neutrophil frequency in ThPOK −/− versus WT MDP cultures. c) Bar graphs indicate absolute cell number of indicated donor-derived gated myeloid subsets (n = 5 independent animals) in blood after in vivo MDP transfer (gated as in Fig. 6F). Error bars represent standard deviations (centre line refers to mean). Significant differences between ThPOK−/− and WT mice were determined by two-sided unpaired t test with Welch’s correction, and indicated by asterisks (* p < 0.05; ** p < 0.01; *** p < 0.001).
Fig. 1.
Fig. 1.. ThPOK knockout causes homeostatic neutrophilia.
a) Schematic of ThPOK gene organization in wt mice (top row), or ThPOK-GFP reporter transgenic construct (bottom row). Black boxes indicate exons. Enhancers and silencer elements are shown as white boxes, or red triangle, respectively. b) FACS analysis of ThPOK-GFP reporter expression by indicated gated peripheral blood subsets. c) FACS analysis of CD11b and Ly6g expression by total cells from indicated organs. Note increase in CD11b+ Ly6ghi neutrophils in ThPOK-deficient compared to WT mice. d) Plots showing total number of neutrophils or monocytes/macrophages per indicated organ in ThPOK-deficient compared to WT mice (same mice as panel c). Error bars represent standard deviations. Two sided unpaired T test was performed. e) FACS analysis of CD62l and CD44 expression by ThPOK−/− and WT neutrophils in peripheral blood. f) cytokine/chemokine release by ThPOK−/− and WT neutrophils upon in vitro stimulation. Two sided unpaired T test was performed. g) Plots showing Elastase (right) or NET (left) upon in vitro stimulation. h) Plots of survival (left) or disease severity score (right) in an in vivo model of sepsis, comparing ThPOK-deficient or WT mice treated with coliform bacteria, or sham-infected, as indicated. Note enhanced protection of ThPOK-deficient versus WT mice. i) FACS analysis of ThPOK-GFP reporter expression by indicated gated bone marrow subsets. j) Competitive reconstitution assay to compare ability of WT and ThPOK−/− BM cells to contribute to myeloid compartment. Equal numbers of CD45.2+ CD45.1- ThPOK+/+ or ThPOK−/− BM cells were cotransferred with CD45.1+ CD45.2+ ThPOK+/+ competitor BM cells into lethally irradiated congenic CD45.1+ recipient mice. Relative contribution to the myeloid compartment in peripheral blood was assessed at 6 months post-transplant. Data are normalized for only donor cells, so that the sum of WT and KO donor cells equals 100% of the total (n = 6, per genotype). Data are displayed as mean ± SEM. *P < 0.05; **P < 0.01; ***P < 0.001; ****P < 0.0001. Two sided unpaired T test with Welch’s Correction was performed.
Fig. 2.
Fig. 2.. ThPOK expression is necessary for neutrophil versus monocyte lineage choice and homeostatic maturation of neutrophils.
a) FACS analysis of cKit, Sca1, CD16/32 and CD34 expression by gated total lineage negative (Lin-) or Lin- cKit+ Sca1- BM cells, as indicated. CMP, GMP, MEP and CD34lo gates are shown in right panels. b) Plots showing frequency of Lin-Sca-cKit+ cells in total BM and of CMP, GMP, MEP and CD34lo subsets in gated cKit+ Sca1- Lin- BM cells from ThPOK-deficient or WT mice (same gates as panel a) (n = 5 biologically independent animals per genotype). Error bars represent standard deviations (centre refers to mean). Significant differences between ThPOK−/− and WT mice were determined by two sided unpaired T test with Welch’s correction, and indicated by asterisks (* p < 0.05; ** p < 0.01; *** p < 0.001). c) FACS comparison of CD11b, CD115, Ly6c, and Ly6g expression by gated cGMP (conventional GMP) (grey histograms) and atypical c-Kit+ CD34lo CD16hi Lin- (green histograms) BM subsets, from ThPOK-deficient mice. d) FACS analysis of CD11b, Ly6g, Vcam1, CD115, Ly6c, CD16/32, cKit and CD34 expression by indicated gated BM subsets. Gates for preNeu1-3 (preN1-3), proNeu1/2 and other precursor populations are shown. e) Plots showing frequency (left panels) or cell number (right panels) of indicated gated precursor populations in ThPOK-deficient or WT mice (same mice as panel d). Data are presented as mean values +/− SEM. Significant differences between ThPOK−/− and WT mice were determined by two sided unpaired T test, and indicated by asterisks (* p < 0.05; ** p < 0.01; *** p < 0.001). n = 5 biologically independent animals.
Figure 3.
Figure 3.. ThPOK controls neutrophil differentiation.
a-b) UMAP plots of (a) wild- type (left) and (b) ThPOK−/− (right) C-GMP myeloid progenitors (Lin-, Kit+, Sca1-, CD34hi, CD16/32+/−, gated as in Extended data Fig.5b). Shown cell populations were defined based on reference alignment to a prior curated murine cKit+ CITE-Seq dataset (Extended data Fig.5a). Overlaid arrows indicate predicted RNA velocities derived from spliced versus unspliced scRNA-Seq reads. Areas with the greatest predicted observed trajectory differences are denoted by purple or red circles. c) Number of differentially expressed genes (DEGs) that are up- or downregulated in ThPOK−/− versus wild-type cells by cellHarmony analysis for indicated cell populations. d) cellHarmony organized heatmap of dynamically regulated DEGs in ThPOK−/− and wt for the most frequency detected cell populations (n=1,685 genes, fold > 1.1 and empirical Bayes moderated t-test p<0.05, FDR corrected). Yellow = upregulated gene, blue = downregulated gene. Genes noted in the text are called out to the right of the heatmap. e) Relative statistical enrichment (GO-Elite Z-score) of ThPOK−/− versus wild-type up-regulated genes against all prior defined hematopoietic differentiation markers, indicates altered differentiation programs in ThPOK−/− mice, for lineage priming (top), lineage specification (middle) and neutrophil commitment (bottom). f) Gene Ontology enrichment analysis (GO-Elite) of down- (right) and up-regulated genes in ThPOK−/− versus wt MDP cells, with example terms highlighted.
Fig. 4.
Fig. 4.. ThPOK alters normal neutrophil specification mRNA splicing, particularly by control of intron-retention.
a-b) Heat maps showing relative mRNA expression of indicated mRNA binding protein genes in ThPOK−/− versus WT progenitor subsets (right panels), for genes that are relatively up- (a) or downregulated (b) in ThPOK−/− cells. Note that in WT mice most/all of these genes are strongly downregulated during granulopoiesis (a,b, left panels). c) Differential splicing analysis (MultiPath-PSI algorithm) of WT BM cell progenitor subsets identifies frequent intron retention in granulopoiesis (only inclusion Alternative Splicing Events (ASEs) are shown). d) Differential splicing analysis of ThPOK−/− versus WT BM progenitors showing unique inclusion (incl) and exclusion (excl) ASEs for indicated cell populations. e) SashimiPlot visualization of example novel ASEs from ThPOK−/− progenitors (pink) versus predominant ASEs from WT progenitors (blue). Yellow regions indicate the location of alternative exon/intron regions (exon numbers indicated below). The outcome of the ASE is indicated at the left (i.e. size of novel protein generated, or nonsense-mediated decay [NMD], as appropriate). f) Heat map showing relative expression of ASE products for indicated ThPOK −/− and WT progenitor subsets. g) SashimiPlot visualization of example ASEs from ThPOK−/− cells (pink) versus ASEs observed in normal myelopoiesis (blue). Yellow regions indicate the location of alternative exon/intron regions (exon numbers indicated below), the outcome of the ASE is indicated at the left. h) Expression of Ezh2 alternate transcript (ratio compared to reference Ezh2 transcript; left panel), EZH2 protein (middle panel), or H3K27Me3 mark (right panel), in indicated progenitor populations from WT and ThPOK−/− mice. mRNA was pooled from 4 mice for each genotype. EZH2 protein and H3K27Me3 levels were assessed by confocal microscopy (mean fluorescent intensities, MFI/per cell, calculated from 8 different fields containing >7 cells/field). Note that increase in alternate Ezh2 transcript correlates with decrease in EZH2 protein expression and H3K27Me3 mark in monocytic progenitors as well as proNeu1 cells. Data are presented as mean values +/− SEM. Significant differences between ThPOK−/− and WT mice were determined by two-sided unpaired t test with Welch’s correction, and indicated by asterisks (* p < 0.05; ** p < 0.01; *** p < 0.001). For left panel, n = 3 technical replicates, each derived from pooled samples from 5 mice. For center and right panels, n = 8–12 microscopic field scans, each containing at least 8 cells.
Fig. 5.
Fig. 5.. ThPOK-deficient GMPs are biased towards the granulocytic lineage.
a) Schematic of in vitro and in vivo assays of GMP lineage potential. b) Frequency of morphologically identified colonies from in vitro bilineage colony formation assay on flow-sorted GMP-gate progenitors (Lin- Kit+ CD34hi CD16hi) from ThPOK-deficient versus WT mice. Note, greatly increased number of granulocytic colonies produced by ThPOK−/− GMPs (GEMM = granulocyte, erythrocyte, macrophage, megakaryocyte; GM = granulocyte, macrophage; G = granulocyte; M = macrophage). Significant differences were determined by two-sided unpaired t test with Welch’s correction. c) Flow cytometric analysis of cells from same in vitro bilineage colony formation assay as in panel b. d), e) Flow cytometric analysis of blood cells derived from in vivo transfer of flow sorted GMP-gate progenitors (Lin- Kit+ CD34hi CD16hi) from ThPOK-deficient versus WT mice transferred into non-irradiated recipient mice. Note that ThPOK-deficient progenitors show predominant differentiation towards neutrophils. Bar graphs indicate absolute cell number of indicated gated myeloid subsets (n = 5 biologically independent animals per genotype). Error bars represent standard deviations. Significant differences between ThPOK−/− and WT mice were determined by two-sided unpaired t test with Welch’s correction, and indicated by asterisks (* p < 0.05; ** p < 0.01; *** p < 0.001).
Fig. 6.
Fig. 6.. ThPOK-deficient MDP produce neutrophils in vitro and in vivo.
a) Schematic of in vitro and in vivo assays of MDP lineage potential. b) Frequency of morphologically identified colonies from in vitro bilineage colony formation assay on flow sorted MDP-gated (Kit+CD34+CD16/32-, Flt3+, CD115+) progenitors from ThPOK-deficient versus WT mice. Note, greatly increased number of granulocytic colonies produced by ThPOK−/− MDPs. N = 37 and N = 51 refer to average number of colonies per well (averaged for 3 wells). Data are presented as mean values +/− SEM. c) Flow cytometric analysis of cells from same in vitro bilineage colony formation assay as in panel b. Bar graphs at right represent percentages of indicated subsets/ well according to gating strategy shown at left (n = 3). Single data point represents pulled MDP population from 3 mice. Data are displayed as mean ± SEM. *P < .05; **P < .01; ***P < .001; ****P < .0001. d) Frequency of morphologically identified colonies from in vitro trilineage (DC-permissive) colony formation assay on flow sorted MDP-gate progenitors from ThPOK-deficient versus WT mice. n = average colony number per well. Data are presented as mean values +/− SEM. e) Flow cytometric analysis of cells from same in vitro bilineage colony formation assay as in panel D. Bar graphs at right represent percentages of indicated subsets according to gating strategy shown at left (n = 3). Data are displayed as mean ± SEM. * p < 0.05; ** p < 0.01; *** p < 0.001. Single data point represents pulled MDP population from 3 mice. f) Flow cytometric analysis of blood cells derived from in vivo transfer of flow sorted MDP-gate progenitors from ThPOK-deficient versus WT mice transferred into non-irradiated recipient mice. g) Anti-ThPOK Chip-seq (red; GSE116506) and ATAC-seq (blue; GSE168772.) tracks for Irf8 and Zeb2 genes (top), ThPOK Chip analyses of FACS-sorted CMP or GMP subsets from heterozygous Flag-tagged-ThPOK knock-in mouse, showing differential ThPOK binding at Irf8 and Zeb2 loci (bottom). Data are presented as mean values +/− SD. h) Schematic of regulation of myeloid gene regulatory network by ThPOK. n = 3 technical replicates, each derived from pooled samples from 5 mice.

References

    1. Netherby CS, et al. The Granulocyte Progenitor Stage Is a Key Target of IRF8-Mediated Regulation of Myeloid-Derived Suppressor Cell Production. J Immunol 198, 4129–4139 (2017). - PMC - PubMed
    1. Yanez A, Goodridge HS, Gozalbo D & Gil ML TLRs control hematopoiesis during infection. Eur J Immunol 43, 2526–2533 (2013). - PMC - PubMed
    1. Manz MG & Boettcher S Emergency granulopoiesis. Nat Rev Immunol 14, 302–314 (2014). - PubMed
    1. Yanez A, Megias J, O’Connor JE, Gozalbo D & Gil ML Candida albicans induces selective development of macrophages and monocyte derived dendritic cells by a TLR2 dependent signalling. PLoS One 6, e24761 (2011). - PMC - PubMed
    1. Basu S, et al. “Emergency” granulopoiesis in G-CSF-deficient mice in response to Candida albicans infection. Blood 95, 3725–3733 (2000). - PubMed

Publication types