. 2023 Sep;30(9):1303-1313.
doi: 10.1038/s41594-023-01045-0. Epub 2023 Jul 20.

The SUMO-NIP45 pathway processes toxic DNA catenanes to prevent mitotic failure

Affiliations

The SUMO-NIP45 pathway processes toxic DNA catenanes to prevent mitotic failure

Emil P T Hertz et al. Nat Struct Mol Biol. 2023 Sep.

Abstract

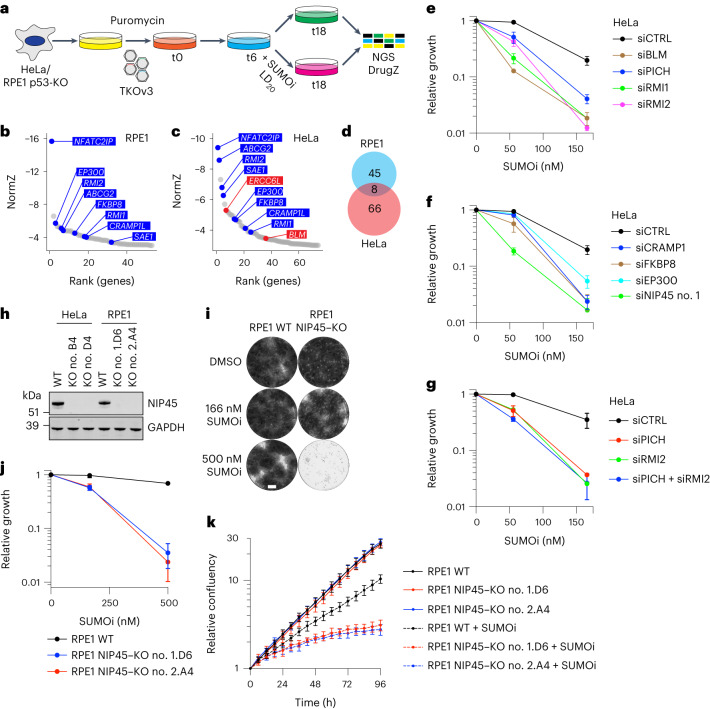
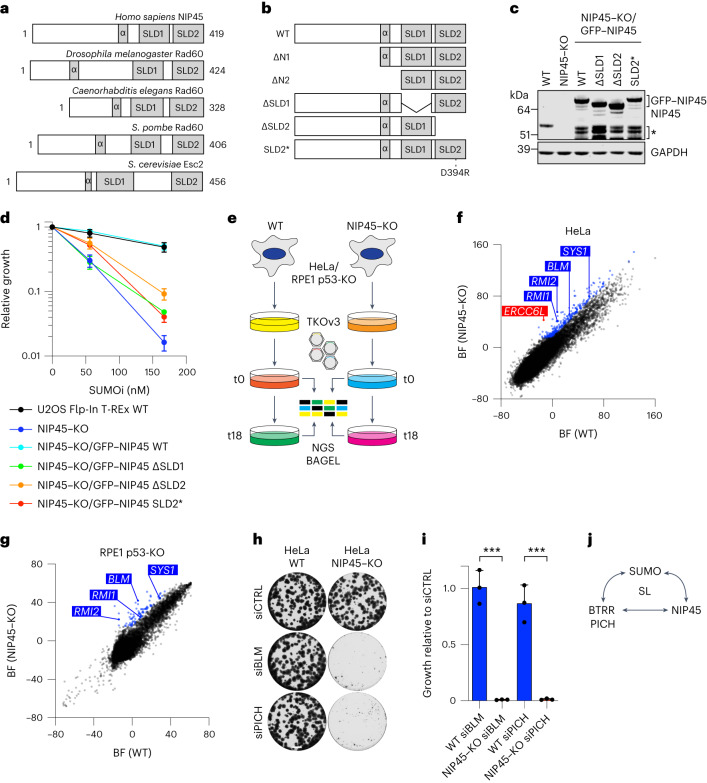
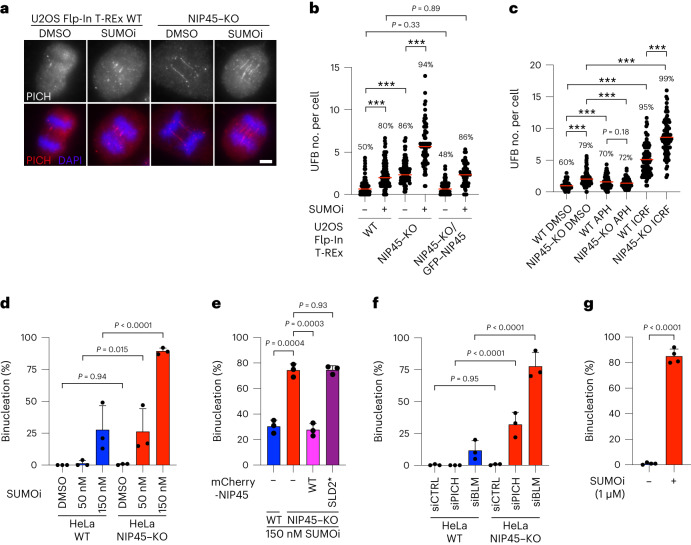
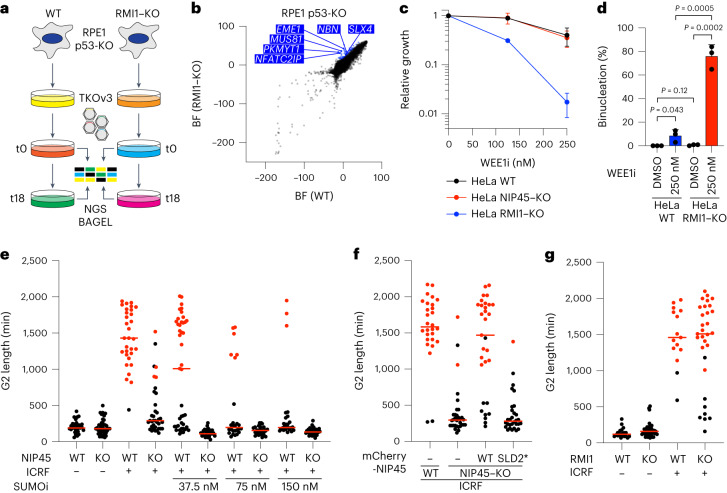
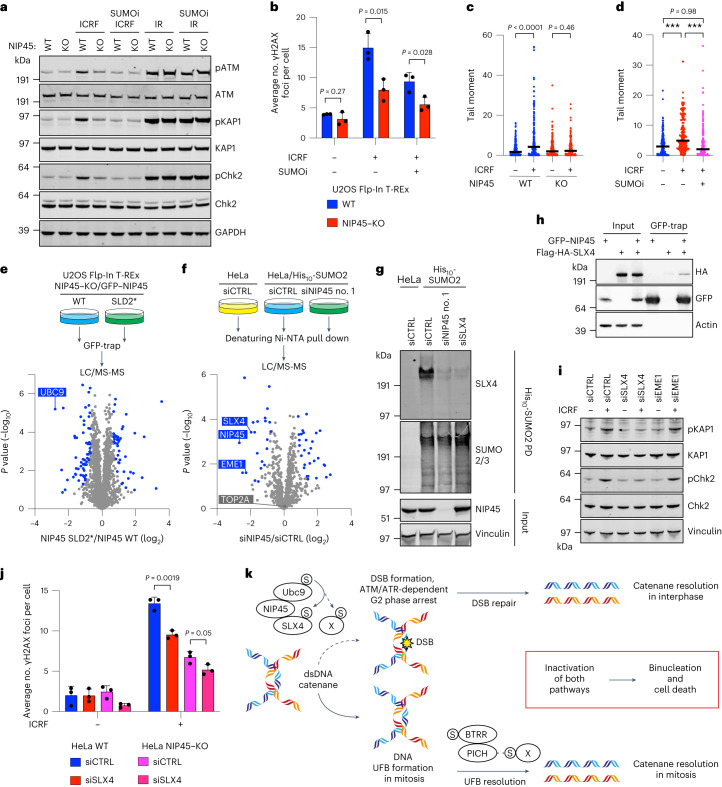
SUMOylation regulates numerous cellular processes, but what represents the essential functions of this protein modification remains unclear. To address this, we performed genome-scale CRISPR-Cas9-based screens, revealing that the BLM-TOP3A-RMI1-RMI2 (BTRR)-PICH pathway, which resolves ultrafine anaphase DNA bridges (UFBs) arising from catenated DNA structures, and the poorly characterized protein NIP45/NFATC2IP become indispensable for cell proliferation when SUMOylation is inhibited. We demonstrate that NIP45 and SUMOylation orchestrate an interphase pathway for converting DNA catenanes into double-strand breaks (DSBs) that activate the G2 DNA-damage checkpoint, thereby preventing cytokinesis failure and binucleation when BTRR-PICH-dependent UFB resolution is defective. NIP45 mediates this new TOP2-independent DNA catenane resolution process via its SUMO-like domains, promoting SUMOylation of specific factors including the SLX4 multi-nuclease complex, which contributes to catenane conversion into DSBs. Our findings establish that SUMOylation exerts its essential role in cell proliferation by enabling resolution of toxic DNA catenanes via nonepistatic NIP45- and BTRR-PICH-dependent pathways to prevent mitotic failure.


Conflict of interest statement

The authors declare no competing interests.

Figures

Fig. 1
Fig. 1. System-wide mapping of genetic vulnerabilities to inhibition of SUMOylation in human cells.
a, Schematic outline of genome-scale CRISPR–Cas9 screens for genes whose KO sensitizes cells to SUMOi. NGS, next-generation sequencing. b,c, DrugZ analysis of sgRNA depletion in RPE1 cells (b) and HeLa cells (c) after 12 d of low-dose SUMOi treatment (56 nM) (n = 2 technical replicates). A NormZ value of <−3 was used as the cut-off for defining significant genes. Hits common to both screens are highlighted in blue; hits that form a complex with common genes are highlighted in red. NFATC2IP encodes NIP45 and ERCC6L encodes PICH (see Supplementary Data 1 and 2 for full results). d, Venn diagram of significant genes (NormZ <−3) from DrugZ analysis of CRISPR screens in (b and c). e, SRB cell growth assay using HeLa cells treated with non-targeting control (CTRL), BLM, PICH, RMI1 or RMI2 siRNAs and indicated SUMOi doses (mean ± s.d.; n = 3 independent experiments). f, As in (e), using CTRL, CRAMP1, FKBP8, EP300 or NIP45 siRNAs (mean ± s.d.; n = 3 independent experiments). g, As in (e), using CTRL, PICH and/or RMI2 siRNAs (mean ± s.d.; n = 3 independent experiments). h, Western blot analysis of NIP45 protein levels in whole-cell lysates from indicated cell lines. Data represent two independent experiments with similar outcome. GAPDH, Glyceraldehyde 3-phosphate dehydrogenase. i,j, Representative images (i) and quantification (j) of SRB cell growth assay using RPE1 WT and NIP45–KO cells treated with indicated SUMOi doses (mean ± s.d.; n = 3 independent experiments). DMSO, Dimethylsulfoxide. Scale bar, 0.25 cm (i). k, Incucyte cell growth assay measuring cell density of RPE1 WT and NIP45–KO cells treated continuously with indicated SUMOi doses (mean ± s.d.; n = 4 independent experiments). Images were acquired every 6 h for 4 d and data points fitted to nonlinear exponential growth models. Source data
Fig. 2
Fig. 2. NIP45 and its SLDs are essential for proliferation in the absence of SUMOylation or BTRR-PICH function.
a, Domain organization of indicated eukaryotic NIP45 orthologs showing conservation of the tandem SLDs and a predicted N-terminal α-helix. b, Schematic showing WT and mutant human NIP45 proteins analyzed in the present study. c, Western blot analysis of NIP45 protein levels in whole-cell lysates from U2OS Flp-In T-Rex WT and NIP45–KO cell lines expressing indicated exogenous GFP–NIP45 variants (b). Bands marked by an asterisk represent breakdown products of GFP–NIP45. d, SRB cell growth assay using U2OS Flp-In T-Rex WT and NIP45–KO cell lines stably expressing indicated GFP–NIP45 variants that were treated with indicated SUMOi doses (mean ± s.d.; n = 3 independent experiments). e, Schematic outline of genome-scale CRISPR–Cas9 screens for SL in NIP45–KO cell lines. f,g, BAGEL analysis of sgRNA depletion in HeLa cells (f) and RPE1 cells (g) comparing WT and NIP45–KO cell lines (n = 2 technical replicates). Synthetic lethal genes common to both screens are highlighted in blue and genes in complex with hits common to both screens but scoring in one screen only are highlighted in red (see Supplementary Data 3 and 4 for the full results). h, SRB cell growth assay using HeLa WT and NIP45–KO cells treated with the indicated siRNAs. Scale bar, 0.25 cm. i, SRB cell growth assay using HeLa WT and NIP45–KO cells treated with indicated siRNAs (mean ± s.d.; n = 3 independent experiments; unpaired two-tailed Student’s t-test; siBLM: ***P = 0.0003; siPICH: ***P = 0.0009). j, Schematic representation of SL relationships between NIP45, SUMO signaling and BTRR-PICH. Data represent three (h) and two (c) independent experiments with similar outcome. Source data
Fig. 3
Fig. 3. NIP45 and SUMOylation protect against excessive UFB formation and binucleation.
a, Representative immunofluorescence images of U2OS Flp-In T-REx WT and NIP45–KO cells immunostained with PICH antibody (red) to identify UFBs after treatment with SUMOi (50 nM) for 24 h. Scale bar, 5 μm. b,c, Quantification of UFBs in in U2OS Flp-In T-REx WT, NIP45–KO and NIP45–KO/GFP–NIP45 cells after treatment with SUMOi (50 nM) (b), aphidicolin (APH; 0.4 μM) and ICRF-193 (ICRF; 0.1 μM) (c) for 24 h (all data points are shown; red bars, median; n = 3 independent experiments; at least 80 cells scored per condition per independent experiment; unpaired, two-tailed Student’s t-test; ***P < 0.0001). The percentage above the bars indicates the fraction of cells containing at least one UFB (UFB-positive cells). dg. Quantification of live-cell imaging tracking the mitotic fate of HeLa WT, NIP45–KO and NIP45–KO cells transiently expressing mCherry–NIP45 WT or SLD2* after 48 h of pre-treatment with indicated doses of SUMOi (d, e and g) or transfected with indicated siRNAs (f) (mean ± s.d.; n = 3 independent experiments; at least 40 cells (d), 25 cells (e), 35 cells (f) and 50 cells (g) were scored per condition per replicate; one-way analysis of variance (ANOVA) without adjustment for multiple comparisons for d and f and unpaired, two-tailed Student’s t-test for e and g). Source data
Fig. 4
Fig. 4. NIP45 and SUMOylation are required for G2 arrest upon inhibition of TOP2-dependent decatenation.
a, Schematic outline of genome-scale CRISPR–Cas9 screen for SL relationships in RPE1 RMI1–KO/p53-KO cells. b, BAGEL analysis of sgRNA depletion comparing WT and RMI1–KO cell lines (n = 2 technical replicates). Synthetic lethal genes (blue) are indicated (see Supplementary Data 5 for full results). c, SRB cell growth assay using HeLa WT, NIP45–KO and RMI1–KO cells treated with indicated WEE1i doses (mean ± s.d.; n = 3 independent experiments). d, Quantification of live-cell imaging tracking the mitotic fate of HeLa WT and RMI1–KO cells after 24 h of pre-treatment with WEE1i (250 nM) (mean ± s.d.; n = 3 independent experiments; at least 50 cells were scored per condition per replicate; unpaired, two-tailed Student’s t-test). e,f, Quantification of live-cell imaging to analyze G2 length (defined as the time from disappearance of GFP–PCNA foci to nuclear envelope breakdown) in HeLa WT and NIP45–KO cells (e) complemented with mCherry–NIP45 WT and SLD2* (f) after pre-treatment for 48 h with indicated SUMOi doses and exposed to ICRF-193 (7 μM) immediately before imaging (red bars, median; representative experiment of n = 3 independent experiments; at least 30 cells (e) and 28 cells (f) were scored per condition per replicate). Red dots denote cells that did not enter mitosis during the experiment. g, Quantification of live-cell imaging to analyze G2 length in HeLa WT and RMI1–KO cells exposed to ICRF-193 (ICRF; 7 μM) immediately before filming (red bars, median; representative experiment of n = 3 independent experiments; at least 15 cells were scored per condition per replicate). Red dots denote cells that did not enter mitosis during the experiment. Source data
Fig. 5
Fig. 5. NIP45 promotes DNA catenane conversion into DSBs involving SUMOylation of the SLX4 multi-nuclease complex.
a, Western blot analysis of whole-cell lysates from HeLa WT and NIP45–KO cells treated for 2 h with ICRF-193 (7 μM), SUMOi (2 μM) and/or IR (4 Gy). b, Immunofluorescence analysis of γH2AX foci in U2OS Flp-In T-REx WT and NIP45–KO cells after treatment with ICRF-193 (1 μM) and/or SUMOi (2 μM) for 4 h (mean ± s.d.; n = 3 independent experiments; unpaired, two-tailed Student’s t-test). c,d, DSBs (tail moment) analyzed by neutral comet assay in HeLa WT and NIP45–KO cells treated with ICRF-193 (ICRF; 25 μM) (c) and/or SUMOi (2 μM) (d) for 2 h (black bars, median; n = 3 independent experiments; at least 50 cells were scored per condition per replicate; unpaired, two-tailed Mann–Whitney U-test; ***P < 0.0001). e,f, MS analysis of GFP pulldowns from U2OS Flp-In T-REx NIP45–KO cells stably expressing GFP–NIP45 wt or SLD2* (e) or SUMOylated proteins isolated by denaturing His (Ni-NTA) pulldown from HeLa or HeLa/His10-SUMO2 cells transfected with indicated siRNAs (f). Volcano plots show the mean difference of the protein intensity plotted against the P value (two-tailed, two-sample Student’s t-test). Significant differences (q < 0.05) were calculated by permutation-based false discovery rate (FDR) control (2,500 rounds of randomization) and are indicated in blue (n = 4 biological replicates). See Supplementary Data 6 and 7 for full results. LC/MS-MS, Liquid chromatography–tandem MS. g, Western blot analysis of denaturing His (Ni-NTA) pulldown from HeLa or HeLa/His10-SUMO2 cells transfected with the indicated siRNAs. h, Western blot analysis of GFP immunoprecipitates from whole-cell lysates of HEK293 cells transfected with plasmids encoding GFP–NIP45 WT and Flag-HA-SLX4. i, Western blot analysis of whole-cell lysates from HeLa cells transfected with indicated siRNAs and treated with ICRF-193 (7 μM) for 2 h. j, Immunofluorescence analysis of γH2AX foci in HeLa cells treated with control or SLX4 siRNAs and subjected to treatment with ICRF-193 (1 μM) for 4 h (mean ± s.d.; n = 3 independent experiments; unpaired, two-tailed Student’s t-test). k, Model of SUMO-mediated resolution of toxic DNA catenanes via nonepistatic NIP45- and BTRR-PICH-dependent pathways (see main text for details). Data represent three (a and h) and two (g and i) independent experiments with a similar outcome. Source data
Extended Data Fig. 1
Extended Data Fig. 1. Validation of SUMOi CRISPR-Cas9 screen hits.
a. Immunoblot analysis of whole cell lysates from HeLa cells that were left untreated or subjected to low-dose (56 nM; corresponding to the LD20) or high-dose (2 μM) SUMOi treatment for 2 h. b. Immunoblot analysis of whole cell lysates from HeLa cells treated with low-dose (56 nM) or high-dose (2 μM) SUMOi for 2 h following transfection with control (CTRL), SAE1, NIP45, EP300, FKBP8 or CRAMP1 siRNAs. c. As in (b), but using CTRL, SAE1, RMI1, RMI2, BLM or PICH siRNAs. d. Schematic representation of common hits (blue) from genome-scale CRISPR-Cas9 screens in HeLa and RPE1 cells for genes whose KO sensitizes cells to SUMOi. Genes identified in one screen only are highlighted in red. e. Immunoblot analysis of siRNA-mediated knockdown efficiency in whole cell lysates from HeLa cells. f. SRB cell growth assay using RPE1 wt and BLM-KO cells treated with indicated doses of SUMOi (mean±s.d.; n = 3 independent experiments). g. SRB cell growth assay using HeLa wt and RMI1-KO cell lines treated with indicated doses of SUMOi (mean±s.d.; n = 3 independent experiments). h. Immunoblot analysis of whole cell lysates from HeLa wt, NIP45-KO and RMI1-KO cell lines. i. SRB cell growth assay using HeLa wt and RMI1-KO cell lines treated with indicated siRNAs and SUMOi doses (mean±s.d.; n = 3 independent experiments). j. Immunoblot analysis of whole cell lysates from HeLa cells transfected with indicated siRNAs. Source data
Extended Data Fig. 2
Extended Data Fig. 2. Characterization of phenotypes associated with NIP45 deficiency and mutation.
a. SRB cell growth assay using HeLa wt and NIP45-KO cell lines treated with indicated doses of SUMOi (ML-792) (mean ± s.d.; n = 3 independent experiments). b. As in (a), using indicated doses of TAK-981 (mean ± s.d.; n = 3 independent experiments). c. Cell cycle analysis of asynchronously growing RPE1 wt and NIP45-KO, and HeLa wt and NIP45-KO cell lines using EdU incorporation and DAPI intensity to distinguish cell cycle phases (mean±s.d.; n = 3 independent experiments; unpaired two-tailed t-test). d. SRB cell growth assay using HeLa NIP45-KO cells treated with indicated SUMOi doses following transfection with siRNAs (mean±s.d.; n = 3 independent experiments). e. SRB cell growth assay using U2OS Flp-In T-REx NIP45-KO and U2OS Flp-In T-REx NIP45-KO/GFP-NIP45 FL cell lines treated with compounds at indicated doses 24 h post seeding (ICRF-193 and aphidicolin, continuous treatment; CPT, MMC and HU, 24 h treatment; MMS, 1 h treatment) (mean of n = 2 technical replicates). f. Representative images of HeLa wt and NIP45-KO cells immunostained with NIP45 antibody with or without Triton X-100 pre-extraction to remove soluble proteins. Scale bar, 10 μM. g. Representative images of U2OS Flp-In T-REx NIP45-KO/GFP-NIP45 cell lines immunostained with GFP antibody. Scale bar, 10 μM. h. Immunoblot analysis of NIP45 protein levels in whole cell lysates from U2OS Flp-In T-Rex wt and NIP45-KO cell lines inducibly expressing indicated GFP-NIP45 variants. i. SRB cell growth assay using U2OS Flp-In T-Rex wt and NIP45-KO cell lines stably expressing indicated GFP-NIP45 mutants that were treated with indicated SUMOi doses (mean±s.d.; n = 3 independent experiments). j. Immunoblot analysis of whole cell lysates from RPE1 p53-KO FLAG-Cas9 parental or NIP45-KO cell lines used for genome-scale CRISPR-Cas9 screens for synthetic lethality. k. SRB cell growth assay using U2OS Flp-In T-REx wt and NIP45-KO cell lines stably expressing GFP-NIP45 WT or SLD2*, comparing the impact of PICH to control (CTRL) siRNAs (mean±s.d.; n = 3 independent experiments; unpaired two-tailed t-test). l. SRB cell growth assay using HeLa wt and RMI1-KO cell lines, comparing the impact of NIP45 and control (CTRL) siRNAs (mean±s.d.; n = 3 independent experiments; unpaired two-tailed t-test). Data information: Data are representative of three (a) and two (f,j) independent experiments with similar outcome. Source data
Extended Data Fig. 3
Extended Data Fig. 3. Impact of NIP45 KO and SUMOi treatment on mitotic progression and abnormalities.
a. Quantification of UFBs following treatment with SUMOi (50 nM) for 24 h in HeLa wt and NIP45-KO cells (all data points are shown; red bars, median; n = 3 independent experiments; at least 80 cells scored per condition per independent experiment; unpaired two-tailed t-test). Percentage above bars indicates fraction of cells containing at least one UFB (UFB-positive cells). b. Quantification of NEBD to anaphase onset duration in HeLa cells wt treated with indicated SUMOi doses using live cell imaging (red bars, median; representative experiment of n = 3 independent experiments; at least 27 cells were scored per condition per replicate; unpaired two-tailed Mann-Whitney test). c. Representative live cell microscopy images of HeLa NIP45-KO cells transiently expressing mCherry-Histone H3 following treatment with or without SUMOi (150 nM) for 48 h. Indicated times are relative to nuclear envelope breakdown (NEBD). DIC, differential interference contrast. Scale bar: 10 μm. Data are representative of 3 independent experiments with similar outcome. d. Quantification of NEBD to anaphase onset duration in HeLa NIP45-KO cells treated with indicated doses of SUMOi using live cell imaging (red bars, median; representative experiment of n = 3 independent experiments; at least 26 cells were scored per condition per replicate; unpaired two-tailed Mann-Whitney test). e. SRB cell growth assay using HeLa cells treated with indicated SUMOi and ICRF-193 doses (mean±s.d.; n = 3 independent experiments). f. Representative immunofluorescence images of U2OS Flp-In T-REx NIP45-KO/GFP-NIP45 cells in late anaphase immunostained with PICH antibody. Scale bar, 5 μM. Source data
Extended Data Fig. 4
Extended Data Fig. 4. Impact of NIP45 KO and SUMOi treatment on G2 checkpoints.
a. Immunoblot analysis of whole cell lysates from RPE1 p53-KO FLAG-Cas9 parental cells and the RMI1-KO cell line used for genome-scale CRISPR-Cas9 screen for synthetic lethality. b. Representative live cell microscopy images of HeLa cells expressing GFP-PCNA used for quantifying duration of G2 phase. Loss of nuclear PCNA foci denotes entry into G2, while NEBD denotes exit from G2. Scale bar: 10 μm. c. Mitotic index of RPE1 wt and NIP45-KO cells following treatment with indicated doses of ICRF-193 (ICRF), SUMOi and/or ATMi+ATRi for 16 h in the presence of nocodazole (1 μM). Mitotic index was determined by immunostaining with phospho-MPM2 antibody and plotted as percent of nocodazole treatment alone (mean±s.d.; n = 3 independent experiments; unpaired two-tailed t-test). d. Representative live cell microscopy images of HeLa wt and NIP45-KO cells expressing GFP-PCNA to monitor G2 length and mitotic progression following pre-treatment with SUMOi (150 nM) for 48 h and/or treatment with ICRF-193 (7 μM) immediately prior to imaging. DIC, differential interference contrast. Scale bar: 10 μm. e. Quantification of live cell imaging tracking the mitotic fate of HeLa wt and NIP45-KO transiently expressing GFP-PCNA that were treated as in (d) (mean±s.d.; n = 3 independent experiments; at least 30 cells were scored per condition per replicate). f. Immunoblot analysis of TOP2A levels in nuclear extracts from RPE1 wt and NIP45-KO cells left untreated or exposed to ICRF-193 (ICRF; 1 μM) for 4 h. g. Mitotic index of U2OS Flp-In T-REx wt, NIP45-KO and NIP45-KO/GFP-NIP45 cells following treatment with ICRF-193 (ICRF; 1 μM) and nocodazole (0.5 μM) for 16 h, determined as in (c) (mean±s.d.; n = 3 independent experiments; unpaired two-tailed t-test comparing to NIP45-KO; U2OS WT: **P = 0.0016; WT: *P = 0.012; ΔSLD2: *P = 0.043). h. Flow cytometry analysis of asynchronously growing HeLa wt and NIP45-KO cells exposed or not to IR (4 Gy) followed by 4 h incubation with nocodazole (150 ng/mL). Gated cells represent mitotic population. Data information: Data are representative of three (b) and two (a,f) independent experiments with similar outcome. Source data
Extended Data Fig. 5
Extended Data Fig. 5. Impact of NIP45 status and SUMOi on DSB formation upon ICRF-193 treatment.
a. Immunofluorescence analysis of γH2AX foci in U2OS Flp-In T-REx cells treated with ICRF-193 (ICRF; 1 μM) and/or SUMOi (2 μM) for 4 h following transfection with control (CTRL) or NIP45 siRNAs (mean±s.d.; n = 3 independent experiments; unpaired two-tailed t-test). b. Immunofluorescence analysis of 53BP1 foci in U2OS Flp-In T-REx wt or NIP45-KO cells treated with ICRF-193 (ICRF; 1 μM) for 4 h (mean ± s.d.; n = 3 independent experiments; unpaired two-tailed t-test). c. Immunoblot analysis of whole cell lysates from HeLa wt cells treated with ICRF-193 (7 μM) for 2 h following transfection with indicated siRNAs. d. As in (a), but cells were treated with ICRF-193 (1 μM) and/or ATRi and/or ATMi for 4 h (mean±s.d.; n = 3 independent experiments; unpaired two-tailed t-test). e. Mitotic index, determined by immunostaining with phospho-MPM2 antibody and plotted as percentage of nocodazole treatment alone, of RPE1 wt and NIP45-KO cells treated with ICRF-193 (1 μM), and/or ATMi and/or ATRi for 16 h in presence of nocodazole (mean±s.d.; n = 3 independent experiments; unpaired two-tailed t-test). f. DSB formation (tail moment) analyzed by comet assay in HeLa wt and NIP45-KO cells treated with ICRF-193 (25 μM) for 2 h (mean ± s.d.; n = 3 independent experiments; unpaired two-tailed Mann-Whitney tests). g. As in (f), except that HeLa wt cells were treated with ICRF-193 (25 μM) and/or SUMOi (2 μM) for 2 h (mean±s.d.; n = 3 independent experiments; unpaired two-tailed Mann-Whitney tests). h. As in (a), but cells were treated with ICRF-193 (1 μM) and/or nocodazole for 4 h (mean±s.d.; n = 3 independent experiments; unpaired two-tailed t-test). i. Immunoblot analysis of whole cell lysates from U2OS Flp-In T-REx wt, NIP45-KO and NIP45-KO/GFP-NIP45 cells treated with ICRF-193 (2 μM) for 2 h. j. Quantification of pKAP1 signals in (i) (mean±s.d.; n = 3 independent experiments; Tukey’s multiple comparisons test; NIP45-KO: ***P = 0.0001; GFP-NIP45 ΔSLD1: ***P = 0.0002; GFP-NIP45 ΔSLD2: ***P < 0.0001; GFP-NIP45 SLD2*: ***P < 0.0001). k. As in (a), but cells were treated with ICRF-193 (1 μM) and/or TAK-981 (5 μM) for 4 h (mean±s.d.; n = 3 independent experiments; unpaired two-tailed t-test). l. Immunoblot analysis of whole cell lysates from HeLa wt and NIP45-KO cells treated for 2 h with ICRF-193 (1 μM) and TAK-981 (5 μM). m. As in (l), but cells were treated with IR (4 Gy), etoposide (ETP), camptothecin (CTP), hydroxyurea (HU), ICRF-193 (1 μM), or aphidicolin (APH, 2 μM) for 2 h. Data information: Data are representative of three (i) and two (c,l,m) independent experiments with similar outcome. Source data
Extended Data Fig. 6
Extended Data Fig. 6. Impact of NIP45 and ICRF-193 on the SUMO system.
a. Immunoblot analysis of NIP45 IPs from whole cell lysates of HeLa wt and NIP45-KO cells. b. Immunoblot analysis of GFP IPs from whole cell lysates of U2OS Flp-In T-REx NIP45-KO cells expressing GFP only or GFP-NIP45 alleles. c. Mass spectrometry analysis of SUMOylated proteins isolated by denaturing His (Ni-NTA) pulldown from HeLa or HeLa/His10-SUMO2 cells treated with DMSO or ICRF-193 (ICRF; 2 mM) for 2 h. Volcano plot show the mean difference of the protein intensity, following subtraction of proteins identified in parental HeLa cells, plotted against the P value (two-tailed two-sample Student’s t-testing). Significant differences (q-value < 0.05) were calculated by adjusting for multiple comparisons with permutation-based FDR control (2,500 rounds of randomization) and are indicated in blue (n = 4 biological replicates). d. Immunoblot analysis of denaturing His (Ni-NTA) pulldown from HeLa or HeLa/His10-SUMO2 cells transfected with indicated siRNAs. e. Immunoblot analysis of whole cell lysates from HeLa cells transfected with control (CTRL) or SLX4 siRNAs. f. Immunoblot analysis of denaturing His (Ni-NTA) pulldown from HeLa or HeLa/His10-SUMO2 cells transfected with indicated siRNAs. Data information: Data (a,b,d,e,f) are representative of two independent experiments with similar outcome. Source data
Extended Data Fig. 7
Extended Data Fig. 7. NIP45 stimulates SUMO modification and interacts with SLX4.
a. In vitro SUMO modification assay containing purified SAE1/SAE2, UBC9, Alexa 647-labeled SUMO1 and FITC-labeled peptide containing a consensus SUMO modification site (FITC-SRBD1). Reactions without E3 ligase or with SUMO E3 ligase RanBP2(2532-2767) or GST-NIP45 were incubated at 37 °C for the indicated time. Reaction products were analyzed by SDS-PAGE and visualized by fluorescent scanning to detect Alexa 647 (left panel) or Coomassie blue staining (right panel). b,c. In vitro SUMO modification assays containing purified SAE1/SAE2, UBC9, Alexa 488-labeled SUMO1 (b) or SUMO2 (c) and either GST, GST-NIP45 or GST-SP100(241-360) were incubated at 37 °C for the indicated time. Reaction products were analyzed by SDS-PAGE and visualized by fluorescent scanning to detect Alexa 488 (left panel) or Coomassie blue staining (right panel). d. As in (c), except that 4xSUMO2 was included in the reactions where indicated. e. Immunoblot analysis of GFP IPs from whole cell lysates of parental U2OS cells or U2OS cells expressing GFP-SLX4 transfected with plasmid encoding mCherry-NIP45. f. SRB cell growth assay using HeLa cells treated with indicated siRNAs and SUMOi doses (mean±s.d.; n = 3 independent experiments). Data information: Data are representative of three (e) and two (a-d) independent experiments with similar outcome. Source data

References

    1. Vertegaal ACO. Signalling mechanisms and cellular functions of SUMO. Nat. Rev. Mol. Cell Biol. 2022;23:715–731. doi: 10.1038/s41580-022-00500-y. - DOI - PubMed
    1. Zhao X. SUMO-mediated regulation of nuclear functions and signaling processes. Mol. Cell. 2018;71:409–418. doi: 10.1016/j.molcel.2018.07.027. - DOI - PMC - PubMed
    1. Seeler JS, Dejean A. SUMO and the robustness of cancer. Nat. Rev. Cancer. 2017;17:184–197. doi: 10.1038/nrc.2016.143. - DOI - PubMed
    1. Hendriks IA, et al. Site-specific mapping of the human SUMO proteome reveals co-modification with phosphorylation. Nat. Struct. Mol. Biol. 2017;24:325–336. doi: 10.1038/nsmb.3366. - DOI - PubMed
    1. Hendriks IA, et al. Site-specific characterization of endogenous SUMOylation across species and organs. Nat. Commun. 2018;9:2456. doi: 10.1038/s41467-018-04957-4. - DOI - PMC - PubMed

Publication types