. 2023 Sep;20(9):1388-1399.
doi: 10.1038/s41592-023-01949-1. Epub 2023 Jul 20.

Efficient high-precision homology-directed repair-dependent genome editing by HDRobust

Affiliations

Efficient high-precision homology-directed repair-dependent genome editing by HDRobust

Stephan Riesenberg et al. Nat Methods. 2023 Sep.

Abstract

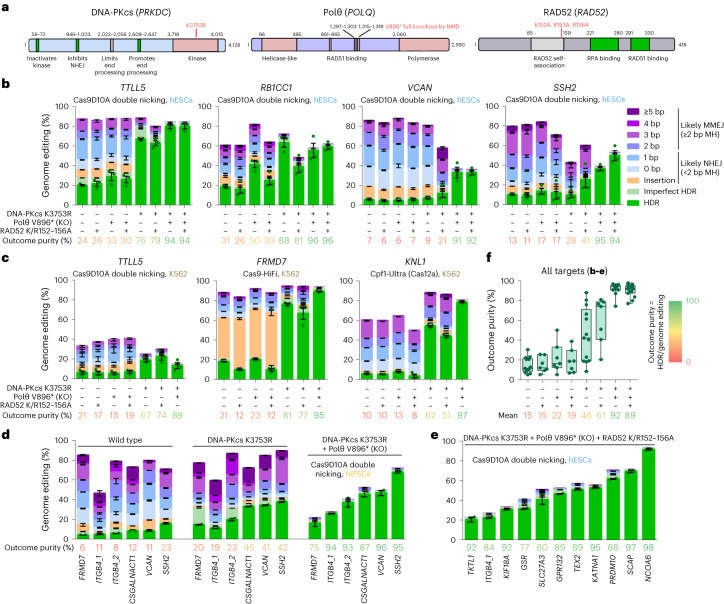
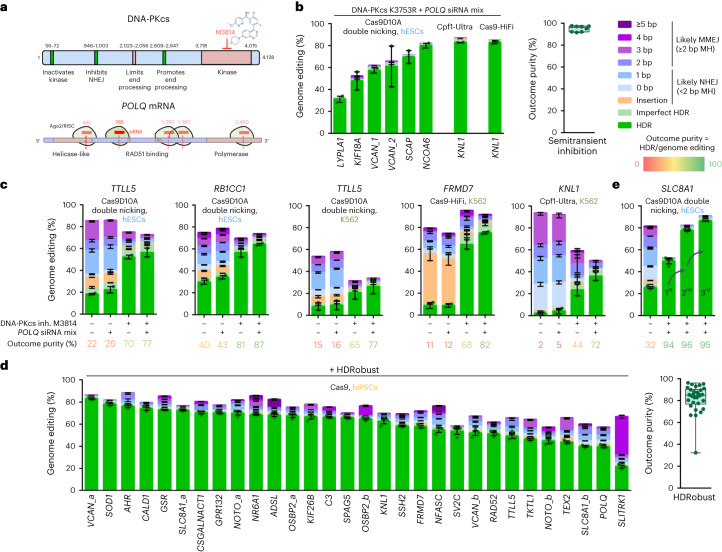
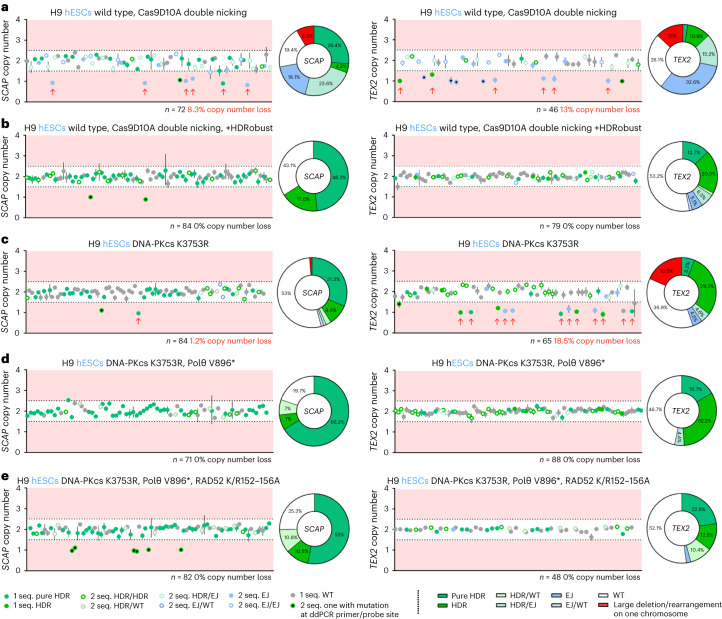
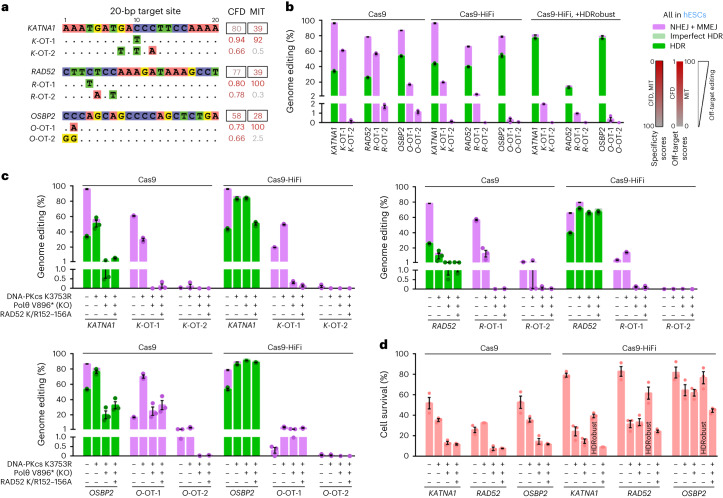
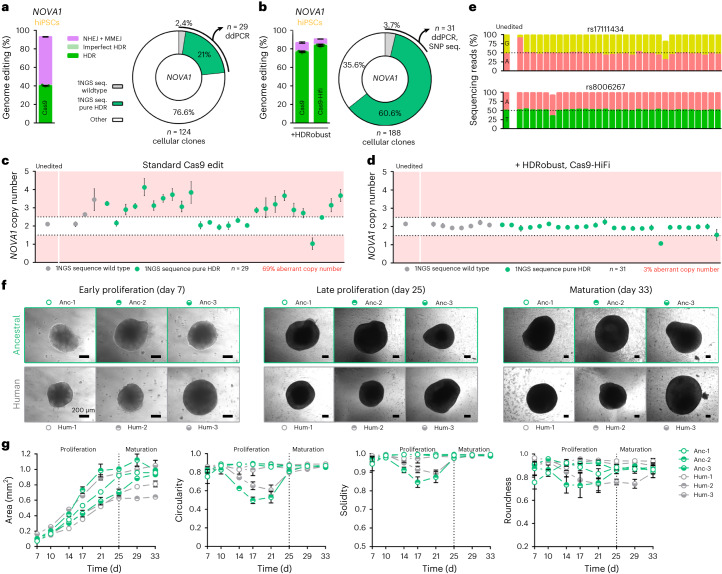
Homology-directed repair (HDR), a method for repair of DNA double-stranded breaks can be leveraged for the precise introduction of mutations supplied by synthetic DNA donors, but remains limited by low efficiency and off-target effects. In this study, we report HDRobust, a high-precision method that, via the combined transient inhibition of nonhomologous end joining and microhomology-mediated end joining, resulted in the induction of point mutations by HDR in up to 93% (median 60%, s.e.m. 3) of chromosomes in populations of cells. We found that, using this method, insertions, deletions and rearrangements at the target site, as well as unintended changes at other genomic sites, were largely abolished. We validated this approach for 58 different target sites and showed that it allows efficient correction of pathogenic mutations in cells derived from patients suffering from anemia, sickle cell disease and thrombophilia.


Conflict of interest statement

Related patent applications on repair gene modified cell lines (patent applicant: Max Planck Society; inventors: S.R. and T.M.; application number: EP17203591.7 and PCT/EP2018/059173; publication: 2018-10-17 WO2018189186; status: pending) and compounds for transient HDR increase (patent applicant: Max Planck Society; inventors: S.R. and T.M.; application number: EP18215071.4; publication: 2020-06-25 WO2020127738A1; status: pending) have been filed. All other authors declare no competing interests.

Figures

Fig. 1
Fig. 1. Genome editing efficiencies in cell lines with repair gene mutations.
a, Protein domain structures of DNA-PKcs, Polθ and RAD52. Motifs or domains beneficial or detrimental for HR/HDR are colored green or rose, respectively. The amino acid positions where domains start and end are given and their functions indicated, the positions of mutations are in red. b, Genome editing efficiencies using Cas9D10A double nicking in H9 hESCs that carry either no repair gene mutation or combinations of DNA-PKcs K3753R, Polθ V896* and RAD52 K152A/R153A/R156A (K/R152–156A). Frequencies of deletions are presented on the basis of microhomology (MH) length. Independent biological replicates were performed (n = 3) and error bars show the s.e.m. For HDR, replicates are depicted by dots. The mean outcome purity given below is the percentage of HDR of all editing events. KO, knockout. c, Genome editing efficiencies using Cas9D10A double nicking, Cas9 (HiFi) and Cas12a (Cpf1-Ultra) in K562 cells that carry either no repair gene mutation or combinations of DNA-PKcs K3753R, Polθ V896* and RAD52 K/R152–156A. Independent biological replicates were performed (n = 3) and error bars show the s.e.m. d, Genome-editing efficiencies using Cas9D10A double nicking in 409B2 hiPSCs without and with combinations of repair gene mutants of targets for which we have previously shown that DNA-PKcs K3753R alone is not sufficient. Independent biological replicates were performed (n = 2) and error bars show the s.e.m. e, Genome editing efficiencies of 11 additional targets using Cas9D10A double nicking in H9 hESCs that carry the mutations DNA-PKcs K3753R, Polθ V896* and RAD52 K/R152–156A. Independent biological replicates were performed (n = 2) and error bars show the s.e.m. f, Outcome purity for all targets in be for wild-type cells or cells with repair gene mutations. Each dot indicates the mean of one target, boxes the 25th to 75th percentile, lines medians and whiskers extend from minimum to maximum values. Source data
Fig. 2
Fig. 2. Genome editing using transient inhibition of repair pathways.
a, Strategy for transient repair pathway inhibition. Motifs or domains beneficial or detrimental for homologous recombination/HDR are colored green or rose, respectively. The amino acid positions where domains start and end are given, their functions indicated and the small-molecule inhibitor of the kinase domain of DNA-PKcs M3814 (ref. ) and siRNAs targeting the POLQ mRNA are indicated in red. b, Genome editing efficiencies using either iCRISPR–Cas9D10A double nicking, Cas9-HiFi RNP or Cpf1-Ultra RNP (Cas12a) in H9 hESCs that carry DNA-PKcs K3753R and transfected with the POLQ siRNAs (‘semitransient inhibition’, that is, genetic NHEJ inhibition, transient MMEJ inhibition). Frequencies of deletions are presented on the basis of microhomology length. Independent biological replicates were performed (n = 2) and error bars show the s.e.m. For HDR, replicates are depicted by dots. The panel to the right gives mean outcome purities (percentage HDR of all editing events) for each target. Each dot indicates the mean of one target, the box the 25th to 75th percentile, lines medians and whiskers extend from minimum to maximum values. c, Genome editing efficiencies using Cas9D10A double nicking in H9 hESCs, as well as using Cas9D10A double nicking, Cas9-HiFi or Cpf1-Ultra in K562 cells and transient inhibition (inh.) of DNA-PKcs by M3814 and/or of POLQ by siRNA. Independent biological replicates were performed (n = 2) and error bars show the s.e.m. Mean outcome purities are given below the charts. d, Genome editing efficiencies of 30 targets using iCRISPR–Cas9 in 409B2 hiPSCs with transient end-joining inhibition by HDRobust (M3814 + POLQ siRNA mix). Independent biological replicates were performed (n = 3) and error bars show the s.e.m. Each dot in the right panel indicates the mean of one target, the box the 25th to 75th percentile, the line the median and whiskers extend to the minimum and maximum values. e, Repeated editing in H9 hESCs with HDRobust increases the percentage of precisely edited cells while maintaining outcome purity. Independent biological replicates were performed (n = 3) and error bars show the s.e.m. Source data
Fig. 3
Fig. 3. Prevention of unintended on-target effects by HDRobust and genetic end-joining repair inhibition.
ae, Target site sequencing and droplet digital (dd) PCR copy number analysis of cellular clones after editing of different targets (SCAP left panels or TEX2 right panels) using Cas9D10A double nicking in H9 hESCs without repair gene mutations (a), transient end-joining inhibition using HDRobust (M3814 + POLQ siRNA mix) (b), DNA-PKcs K3753R (c), DNA-PKcs K3753R and Polθ V896* (d) or DNA-PKcs K3753R, Polθ V896* and RAD52 K152A/R153A/R156A (K/R152–156A) (e). The copy number of target sequences relative to the gene FOXP2 in cellular clones is plotted as a filled or open circle when one predominant DNA sequence (seq.) (apparent homozygous) or two DNA sequences with a similar frequency (apparent heterozygous) were obtained, respectively. The circles are in shades of green and blue to represent different combinations of unmodified chromosomes, chromosomes modified by HDR and chromosomes modified by NHEJ or MMEJ (summarized as end joining, EJ). Incorporation of the targeted substitution regardless of the presence of additional mutations is quantified as HDR. For cellular clones with one predominant DNA sequence, ‘pure HDR’ labels the exclusive presence of the targeted substitution. A black dot in a circle fill indicates an indel at the ddPCR primer/probe site that results in inability to amplify this locus for one chromosome. Cellular clones with copy number loss indicative of an on-target effect are labeled with red arrows. The measure of center for the error bars represents the ratio of the Poisson-corrected number of target to reference molecules multiplied by two for the diploid state of the reference gene. The error bars represent the 95% confidence interval of this measurement. The numbers of cellular clones analyzed and percentages of on-target effects are given. Pie charts give the percentage of genotypes of the cellular clones. WT, wild type. Source data
Fig. 4
Fig. 4. Prevention of off-target effects by HDRobust and genetic end-joining repair inhibition.
a, Target site sequences of three different gRNAs that are predicted to be prone to off-target editing using CFD and MIT specificity scores. The sequences of the two off-targets with the highest CFD scores are shown below the on-target sites. Identical bases are given by dots. The CFD and MIT scores are in black frames. b, Genome editing efficiencies with Cas9, Cas9-HiFi or Cas9-HiFi with HDRobust at the on-target and top two CFD off-target sites in H9 hESCs without repair gene mutations. Independent biological replicates were performed (n = 3) and error bars show the s.e.m. c, Genome editing efficiencies at the on-target and top two CFD off-target sites by Cas9 RNP or Cas9-HiFi RNP in H9 hESCs without repair gene mutations, as well as with combinations of DNA-PKcs K3753R, Polθ V896* and RAD52 K152A/R153A/R156A (K/R152–156A). Independent biological replicates were performed (n = 3) and error bars show the s.e.m. d, Cell survival after editing with Cas9 RNP or Cas9-HiFi RNP in H9 hESCs without repair gene mutations, in combinations of DNA-PKcs K3753R, Polθ V896* and RAD52 K/R152–156A, as well as with HDRobust and Cas9-HiFi in wild-type cells. Cell survival was quantified by a fluorescence resazurin assay with respect to mock electroporation without editing. Independent biological replicates were performed (n = 3) and error bars show the s.e.m. Replicates are depicted by dots for HDR, NHEJ + MMEJ, or cell survival. Source data
Fig. 5
Fig. 5. Prime editing with HDRobust, comparison with standard editing and HDRobust and correction of disease mutations.
a, Genome editing efficiencies using iPrime (Cas9H840A nickase), iPrimeCut (Cas9 nuclease prime editor) or iPrimeCut with HDRobust (M3814 + POLQ siRNA mix) in H9 hESCs that carry no repair gene mutation. Independent biological replicates were performed (n = 3) and error bars show the s.e.m. For PE, replicates are depicted by dots. The mean outcome purities (percentage PE of all editing events) are given. b, Published editing efficiencies of mutations at the same positions for CDKL5, FANCF and RNF2 in hiPSCs, hESCs, HEK293 or T cells are shown. c, Genome editing efficiencies of the same sites as in a with iCRISPR–Cas9D10A double nicking, or Cas9-HiFi RNP with or without HDRobust in H9 hESCs that carry no repair gene mutation. Independent biological replicates were performed (n = 3) and error bars show the s.e.m. For HDR, replicates are depicted by dots. Mean outcome purities (percentage HDR of all editing events) are given. d, Genome editing efficiencies using Cas9-HiFi in primary CD4+ T cells with M3814 alone or HDRobust. Independent biological replicates were performed (n = 3) and error bars show the s.e.m. e, Genome editing efficiencies using Cas9-HiFi in patient-derived LCLs with or without HDRobust. Independent biological replicates were performed (n = 2) and error bars show the s.e.m. Source data
Fig. 6
Fig. 6. Brain organoid morphology after editing of NOVA1 to the Neandertal state.
a, Standard genome editing of NOVA1 as described in. Independent biological replicates were performed (n = 3) and error bars show the s.e.m. For HDR, replicates are depicted by dots. The right panel shows the percentage of single cell-derived colonies that have one predominant wild-type DNA sequence (apparent homozygous wild type, gray), one predominant ‘pure’ HDR sequence (apparent homozygous exclusive ancestral edit, green) or any other genotype (white). The total number of analyzed cellular clones is given. b, Genome editing efficiencies and genotypes of single cell-derived colonies after editing of NOVA1 as done in a, but with HDRobust and Cas9-HiFi RNP. Independent biological replicates were performed (n = 3) and error bars show the s.e.m. c, Copy number (relative to the FOXP2 gene) of the target site of the single cell-derived cellular clones from a that appear homozygous at the target site for wild type and ‘pure’ HDR on the basis of sequencing of the target site. Copy number estimates are plotted as gray and green circles for wild type and ‘pure’ HDR clones, respectively. The measure of center for the error bars represents the ratio of the Poisson-corrected number of target to reference molecules multiplied by two for the diploid state of the reference gene. The error bars represent the 95% confidence interval of this measurement. The number of analyzed cellular clones and percentage of clones with aberrant copy numbers of the target site are given. d, Copy number of the target site of the cellular clones from b that appear homozygous at the target site for wild type and ‘pure’ HDR on the basis of sequencing of the target site. The measure of center for the error bars represents the ratio of the Poisson-corrected number of target to reference molecules multiplied by two for the diploid state of the reference gene. The error bars represent the 95% confidence interval of this measurement. e, Genotypes of SNPs upstream (rs17111434) and downstream (rs8006267) of the target site from the cellular clones in d. f, Phase-contrast images of three typical cellular clones with the modern human (Hum-1–3, gray circles) or ancestral (Anc-1–3, green circles) NOVA1 during early proliferation (day 7), late proliferation (day 25) and maturation (day 33). g, Organoid size and shape descriptors of circularity, solidity and roundness during brain organoid development from proliferation to maturation (days 7–33). Data for three different cellular clones for human (gray circles) and ancestral (green circles) are given. Circles show the mean and error bars show the s.e.m. of measurements of four different organoids for each day and clone. Source data
Extended Data Fig. 1
Extended Data Fig. 1. Cell population growth.
Number of living wild type H9 hESCs and repair mutant variants for 6 days of cell culture. 50,000 cells each were seeded on day 0. The lines correspond to wild type (black) or repair gene mutants (colored). The amount of living cells was quantified by a fluorescence resazurin assay. Absolute cell number was estimated by comparing resazurin assay fluorescence and cell counting using the Countess Automated Cell Counter (Invitrogen) on day 1. Error bars show the s.e.m. of replicates (n = 2). Source data
Extended Data Fig. 2
Extended Data Fig. 2. Deletion patterns after editing with single-stranded DNA donors.
(a) Deletion pattern shapes after editing in hESCs with Cas9D10A double nicking (corresponding to Fig. 1b). (b) Deletion pattern shapes after editing in K562 cells with Cas9D10A double nicking, Cas9-HiFi, and Cas12a (Cpf1-Ultra) (corresponding to Fig. 1c). The lines correspond to wild type (black) or repair gene mutants (colored). Each line is the mean of independent biological replicates (n = 3). The vertical dotted line indicates the position of the nicking or cleavage sites. Source data
Extended Data Fig. 3
Extended Data Fig. 3. Indel efficiencies and cell survival after editing without DNA donors.
(a) Genome editing efficiencies using Cas9D10A double nicking without a DNA donor in H9 hESCs that carry either no repair gene mutation or combinations of DNA-PKcs K3753R, Polϴ V896*, and RAD52 K152A/R153A/R156A (K/R152-156A). Frequencies of deletions are presented based on microhomology (MH) length. For insertions, replicates are depicted by dots. (b) Deletion pattern shapes of editing from panel a. The lines correspond to wild type (black) or repair gene mutants (colored). Each line is the mean of replicates. (c) Cell survival corresponding to edits from panel a. Cell survival was quantified by a fluorescence resazurin assay with respect to editing in wild type cells. Independent biological replicates were performed (n = 3) and error bars show the s.e.m. Source data
Extended Data Fig. 4
Extended Data Fig. 4. Transient microhomology-mediated end-joining (MMEJ) inhibition by siRNAs.
(a) Editing efficiencies of the VCAN target using Cas9D10A double nicking in H9 hESCs carrying the K3753R mutation, and with additional POLQ mutations (V896* full knockout, DE2540AA polymerase knockout, 6x silent SNPs that do not change the encoding amino acids), transient POLQ inhibition with siRNAs, or transient RAD51 inhibition with the small molecule B02. The K3753R mutation will prevent backup NHEJ repair when MMEJ is inhibited. Frequencies of deletions are presented based on microhomology (MH) length. For HDR, replicates are depicted by dots. The mean outcome purities (percentage HDR of all editing events) are given. Independent biological replicates were performed (n = 2, except DNA-PKcs K3753R / DE2540AA / B02 and DNA-PKcs K3753R / 6x silent SNP n = 3, DNA-PKcs K3753R / DE2540AA n = 5, and DNA-PKcs K3753R n = 6) and error bars show the s.e.m. (b) A scheme of the different siRNAs targeting the POLQ mRNA to induce Ago2/RISC assisted cleavage as well as a site of silent mutations that do not change the encoded amino acids, and translated Polϴ is shown below. Polϴ motifs described to be detrimental for homologous recombination/HDR are colored rose, Polϴ inhibitory mutations are red. (c) Time course of POLQ mRNA knock down with siRNA 765. POLQ expression was normalized with GAPDH expression and is given relative to untreated cells. Independent biological replicates were performed (n = 2) and error bars show the s.e.m. Source data
Extended Data Fig. 5
Extended Data Fig. 5. Transient microhomology-mediated end-joining (MMEJ) inhibition by small molecules.
Editing efficiencies of the VCAN target using Cas9D10A double nicking in H9 hESCs carrying the K3753R mutation and additional small molecules to inhibit the MMEJ repair proteins Polϴ, PARP or Ligase I/III: (a) ART558, (b) Novobiocin, (c) AG-14361, (d) Rucaparib, (e) L67, (f) L189. Frequencies of deletions are presented based on microhomology (MH) length. For HDR, replicates are depicted by dots. The mean outcome purities (percentage HDR of all editing events) are given. Independent biological replicates were performed (n = 6, except n = 3 for mock c-f) and error bars show the s.e.m. Source data
Extended Data Fig. 6
Extended Data Fig. 6. Indel signatures of no donor control edits with Cas9.
Indel signatures after genome editing of thirty targets using iCRISPR-Cas9 in 409B2 hiPSCs without a DNA donor. Indels are plotted in two ways: (a) Insertions are indicated in orange, and deletions with various microhomology (MH) lengths are indicated with various shades of blue and purple. For insertions, replicates are depicted by dots. (b) Deletions with sizes equal or bigger 3 bp are indicated in yellow, while all other indels are indicated in petrol with replicates as dots. The former and latter have been described as proxies for NHEJ and MMEJ after Cas9 editing, respectively, and a strong proxy for MMEJ is predictive of tendency for HDR if a DNA donor would be present. These no donor controls are related to Fig. 2d. Independent biological replicates were performed (n = 3) and error bars show the s.e.m. Source data
Extended Data Fig. 7
Extended Data Fig. 7. Cell survival after Cas9 editing for indel generation without a DNA donor and precise editing with HDRobust.
Cell survival after Cas9 edits of thirty targets in 409B2 hiPSCs without DNA donors (related sequencing data Extended Data Fig. 6) (a), and with both DNA donors and HDRobust (related sequencing data Fig. 2d) (b). Cell survival was quantified by a fluorescence resazurin assay with respect to mock electroporation without editing. Independent biological replicates are depicted by dots (n = 3) and error bars show the s.e.m. Each dot in the right panels indicate the mean of one target, the box the 25th to 75th percentile, the line the median and whiskers extend to the minimum and maximum values. Source data
Extended Data Fig. 8
Extended Data Fig. 8. Repeated editing using HDRobust to enrich for HDR edited cells.
(a) Genome editing efficiencies using repeated Cas9D10A double nicking or Cas9-HiFi in combination with HDRobust in H9 hESCs that carry no repair gene mutation. Frequencies of deletions are presented based on microhomology (MH) length. For HDR, replicates are depicted by dots. The mean outcome purity given below is the percentage of HDR of all editing events. (b) Cell survival corresponding to edits from panel a. Cell survival was quantified by a fluorescence resazurin assay with respect to editing in wild type cells. Independent biological replicates were performed (n = 3) and error bars show the s.e.m. Source data
Extended Data Fig. 9
Extended Data Fig. 9. Deletion events at the OSBP2 off-target O-OT-1 in cell lines with repair gene mutant combinations.
(a) Top five deletions at the OSBP2 off-target O-OT-1 H9 hESCs that carry no repair gene mutation or combinations of DNA-PKcs K3753R, Polϴ V896*, and RAD52 K152A/R153A/R156A (K/R152-156A). Sequence similarity flanking deletions indicated in purple and the numbers of similar bases (‘homology length’) are given. (b) Deletion frequency at the OSBP2 off-target O-OT-1 H9 hESCs that carry no repair gene mutation or combinations of DNA-PKcs K3753R, Polϴ V896*, and RAD52 K/R152-156A. The purple deletion line is the mean of independent biological replicates (n = 3). The vertical dotted line indicates the position of the off-target cut. Data shown is related to Fig. 4c.
Extended Data Fig. 10
Extended Data Fig. 10. NOVA1 brain organoid images used for area and shape analysis.
Phase-contrast images and shapes of brain organoids derived from cellular clones carrying ancestral (a) or human (b) NOVA1. The time course of organoid development from d7 to d33 (top to bottom) of three different cellular clones for and ancestral (Anc1-3, green circles and image frames) and human (Hum1-3, gray circles and image frames) NOVA1 is shown for four different organoids for each day and clone. The size bar is 200 µm. Source data

References

    1. Jinek M, et al. A programmable dual-RNA-guided DNA endonuclease in adaptive bacterial immunity. Science. 2012;337:816–821. doi: 10.1126/science.1225829. - DOI - PMC - PubMed
    1. Cong L, et al. Multiplex genome engineering using CRISPR/Cas systems. Science. 2013;339:819–823. doi: 10.1126/science.1231143. - DOI - PMC - PubMed
    1. Fu Y, et al. High-frequency off-target mutagenesis induced by CRISPR–Cas nucleases in human cells. Nat. Biotechnol. 2013;31:822–826. doi: 10.1038/nbt.2623. - DOI - PMC - PubMed
    1. Shrivastav M, De Haro LP, Nickoloff JA. Regulation of DNA double-strand break repair pathway choice. Cell Res. 2008;18:134–147. doi: 10.1038/cr.2007.111. - DOI - PubMed
    1. Sfeir A, Symington LS. Microhomology-mediated end joining: a back-up survival mechanism or dedicated pathway? Trends Biochem. Sci. 2015;40:701–714. doi: 10.1016/j.tibs.2015.08.006. - DOI - PMC - PubMed

Publication types

LinkOut - more resources