. 2023 Sep;20(9):1426-1436.
doi: 10.1038/s41592-023-01959-z. Epub 2023 Jul 20.

Sensitive multicolor indicators for monitoring norepinephrine in vivo

Affiliations

Sensitive multicolor indicators for monitoring norepinephrine in vivo

Zacharoula Kagiampaki et al. Nat Methods. 2023 Sep.

Abstract

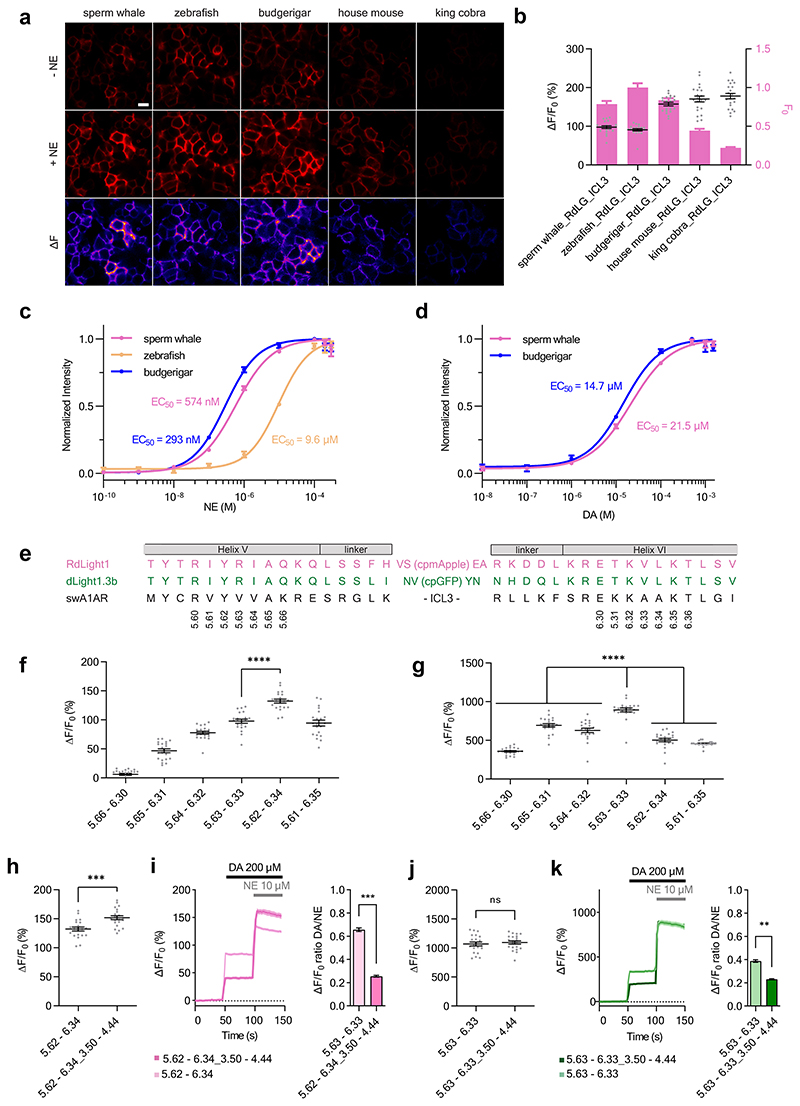
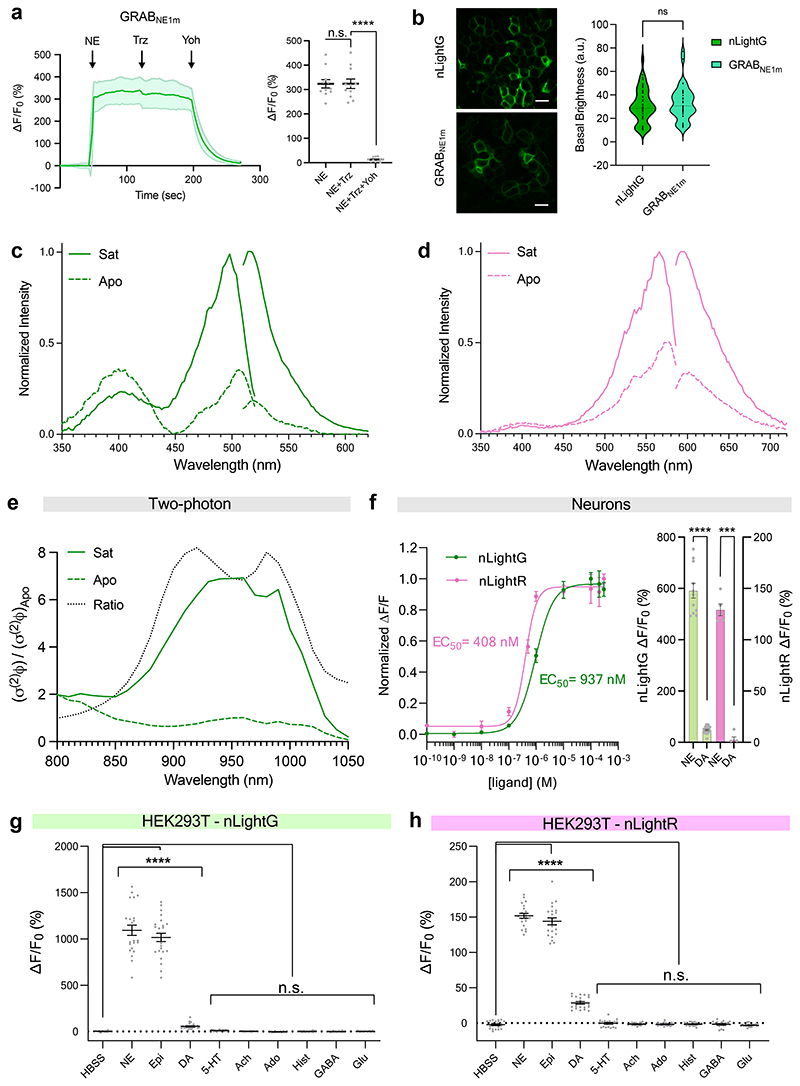
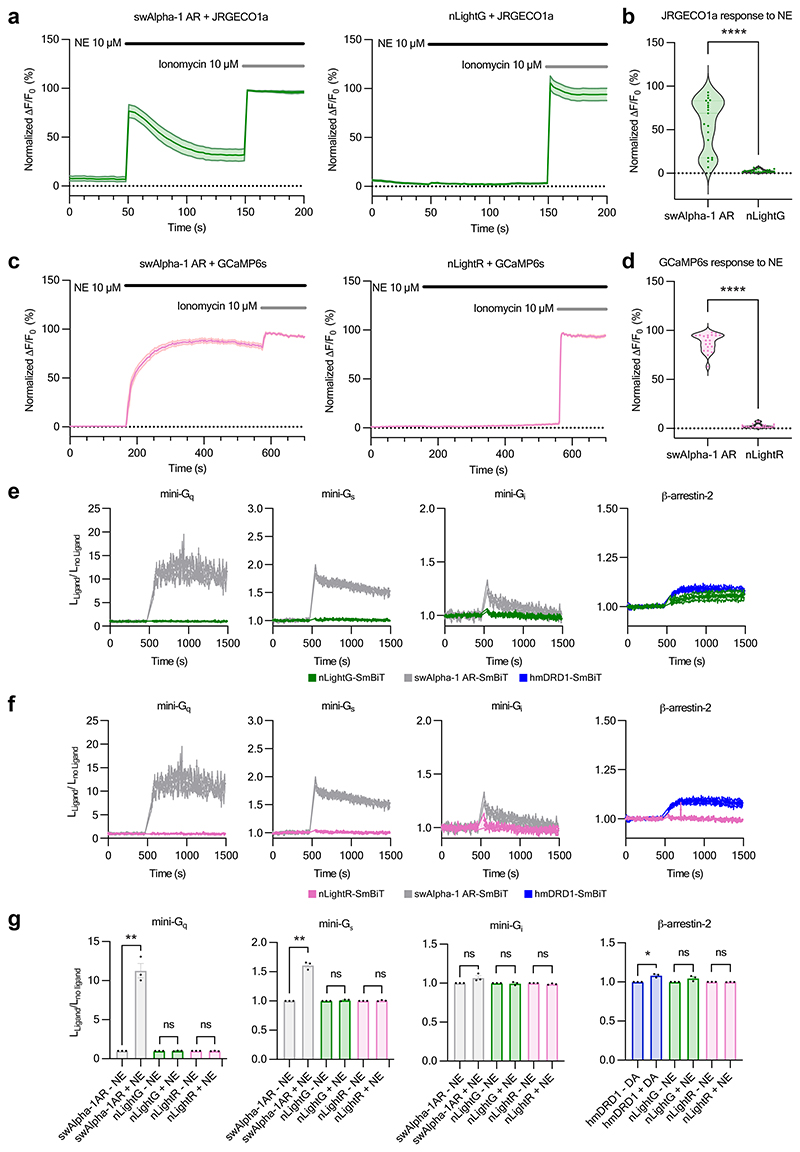
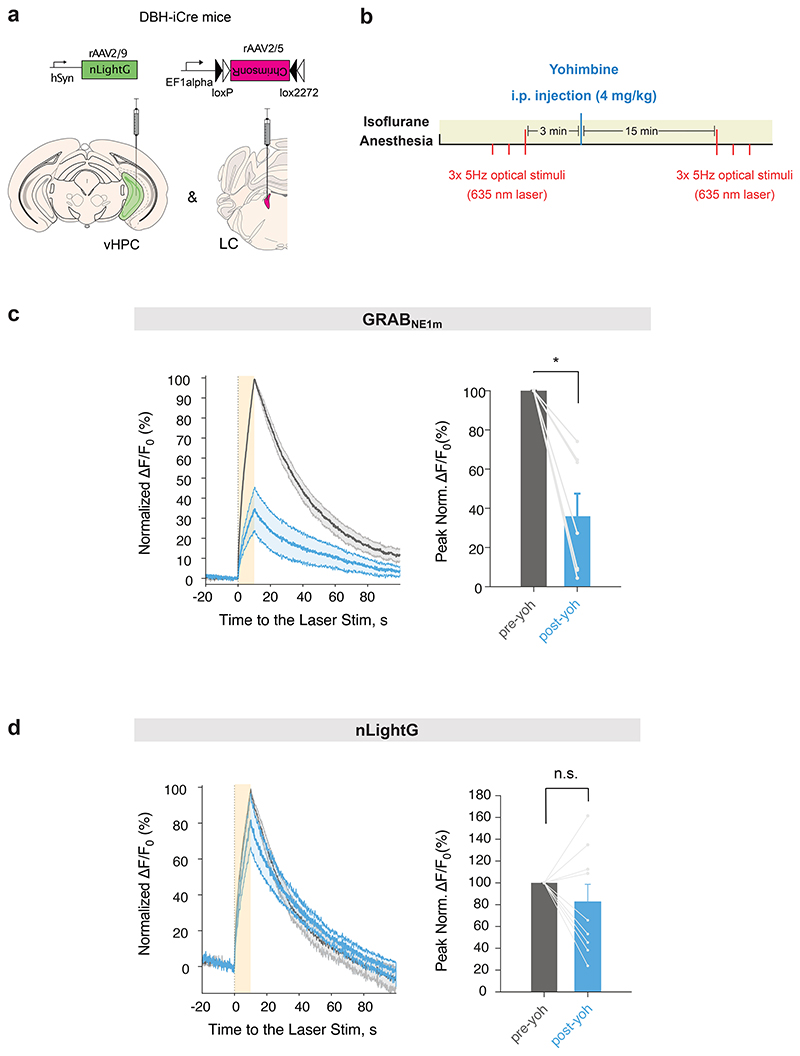
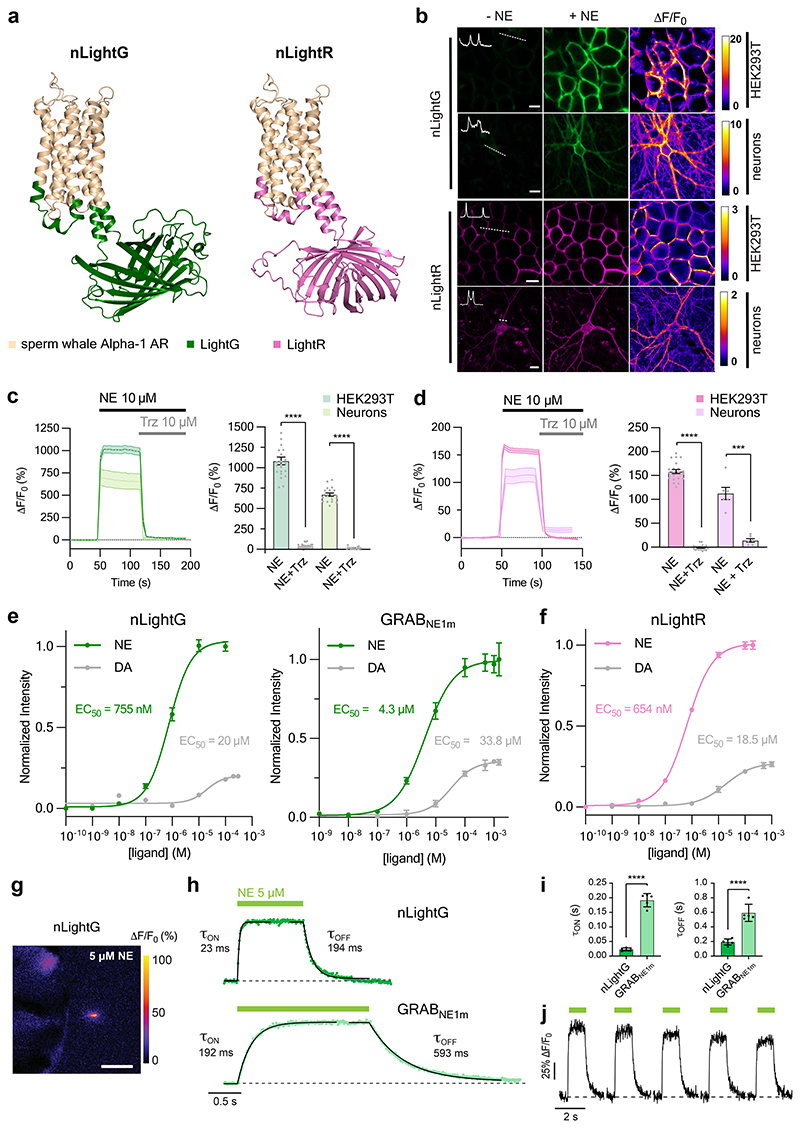
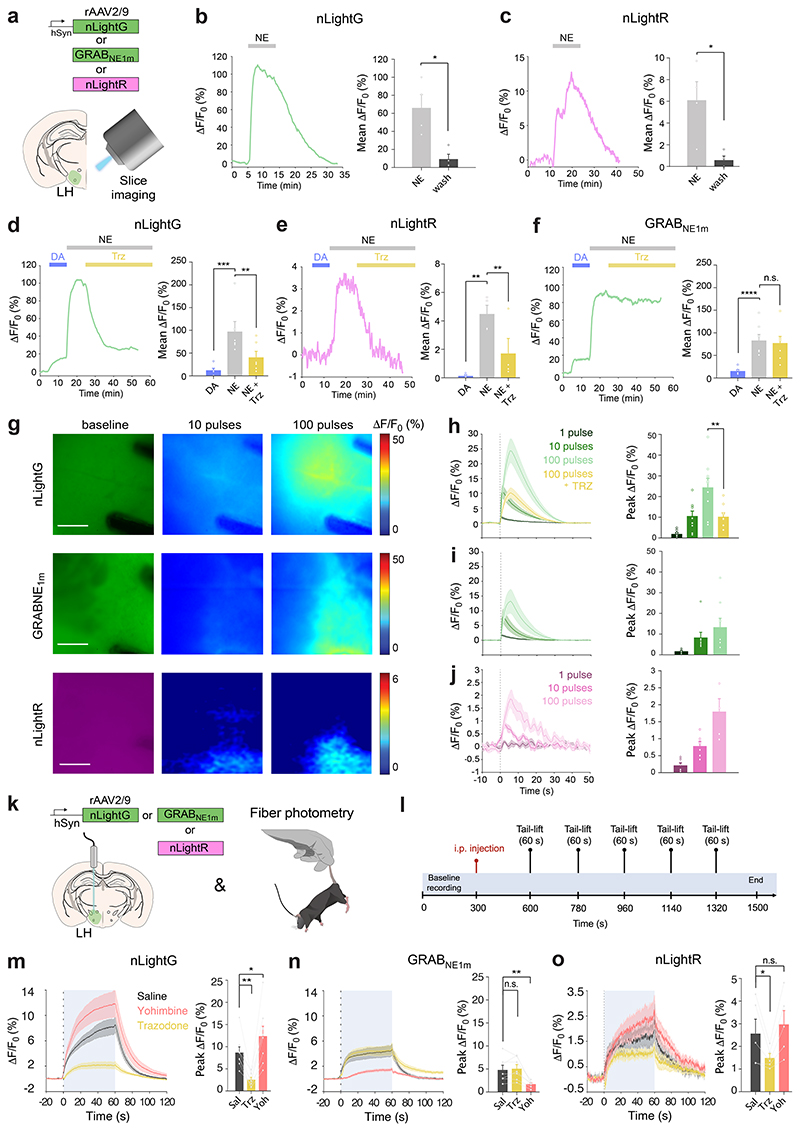
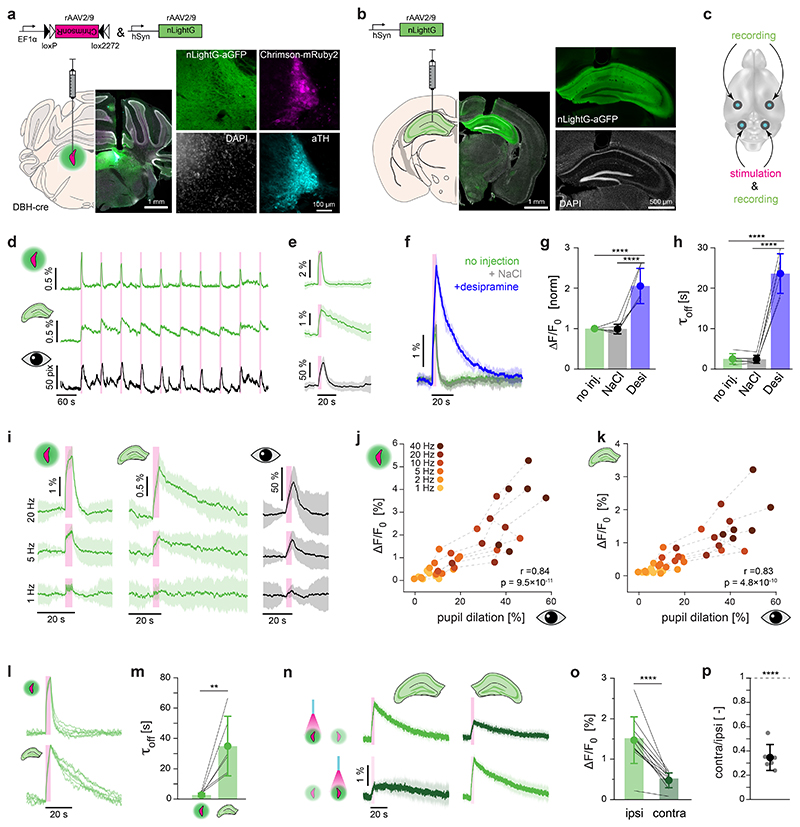
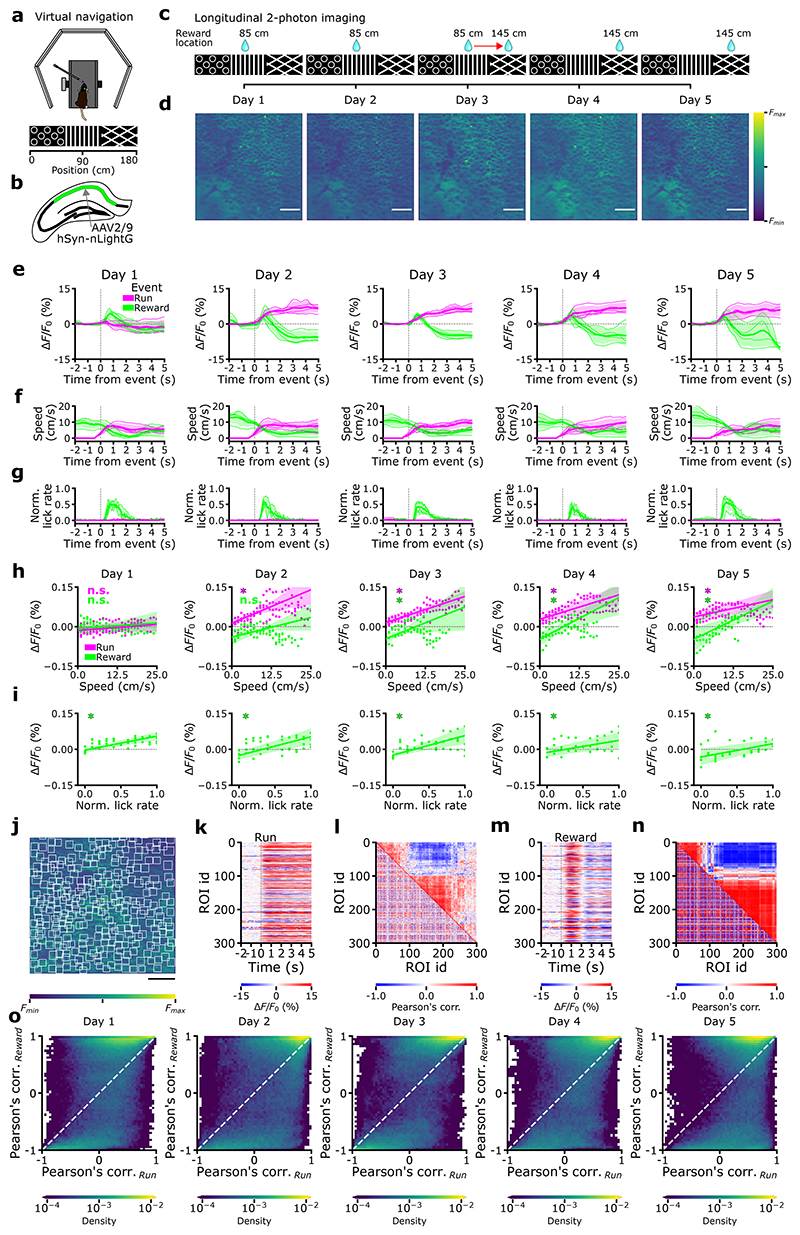
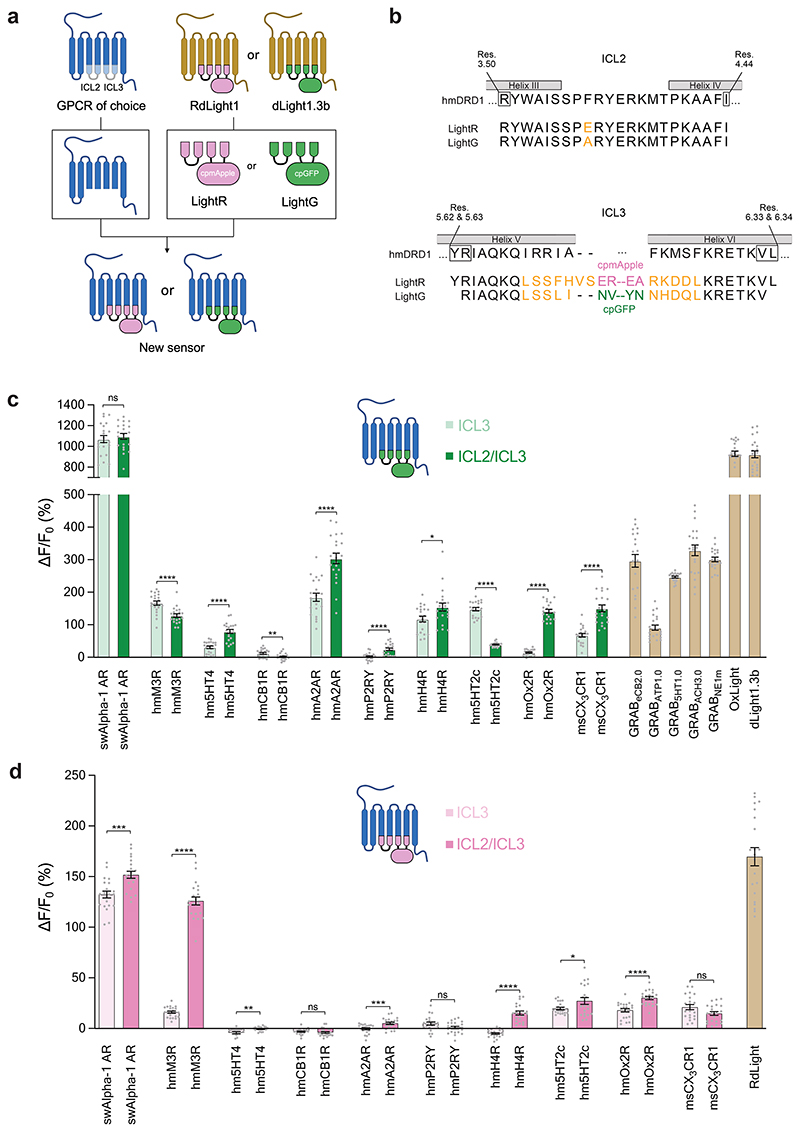
Genetically encoded indicators engineered from G-protein-coupled receptors are important tools that enable high-resolution in vivo neuromodulator imaging. Here, we introduce a family of sensitive multicolor norepinephrine (NE) indicators, which includes nLightG (green) and nLightR (red). These tools report endogenous NE release in vitro, ex vivo and in vivo with improved sensitivity, ligand selectivity and kinetics, as well as a distinct pharmacological profile compared with previous state-of-the-art GRABNE indicators. Using in vivo multisite fiber photometry recordings of nLightG, we could simultaneously monitor optogenetically evoked NE release in the mouse locus coeruleus and hippocampus. Two-photon imaging of nLightG revealed locomotion and reward-related NE transients in the dorsal CA1 area of the hippocampus. Thus, the sensitive NE indicators introduced here represent an important addition to the current repertoire of indicators and provide the means for a thorough investigation of the NE system.


Conflict of interest statement

COMPETING FINANCIAL INTERESTS

T.P. is a co-inventor on a patent application related to the technology described in this article. All other authors have nothing to disclose.

Figures

Extended Data Fig. 1
Extended Data Fig. 1. Development of nLightG and nLightR
a, Representative images of indicators, generated by grafting LightR from residue 5.63 to residue 6.33 onto Alpha-1 ARs from five different species, expressed in HEK293T cells and imaged in the absence and presence of NE (10 μM). Heatmaps represent the pixelwise absolute change in fluorescence intensity upon addition of NE. b, Quantification of the basal brightness and the dynamic range upon addition of NE (10 μM) to HEK293T cells expressing the five prototype indicators. n = 21 cells. c, d, Normalized fluorescence intensity dose-response curves of nLightG and nLightR for NE (c) and DA (d) in HEK293T cells. Datapoints were fitted with four-parameter dose-response curves to determine the EC50 values. n = 3 wells per concentration for each ligand. e, Partial alignment of the amino acid sequence of RdLight1, dLight1.3b and the sperm whale Alpha-1 AR. BW numbering is shown for the residues involved in grafting registry optimization. f, g, Dynamic range of indicator variants generated by grafting of the cpmApple module of RdLight1 (f) or the cpGFP module of dLight1.3b (g) at different BW registries. The indicated BW numbers refer to the grafted part of RdLight1 or dLight1.3b replacing the equivalent part of the sperm whale Alpha-1 AR. The response was measured in HEK293T cells upon addition of NE (10 μM). n = 21 cells. P values were as follows: 1.585×10⁻⁸ (f); 5.66 - 6.30, 4.149×10⁻¹⁷; 5.65 - 6.31, 9.093×10⁻⁷; 5.64 - 6.32, 2.199×10⁻⁸; 5.62 - 6.34, 4.341×10⁻¹⁴; 5.61 - 6.35, 3.283×10⁻¹⁴ (g). h, Dynamic range of the red fluorescent swAlpha-1 AR-based indicator variants with the optimized grafting registry without or with additional grafting of the ICL2 from RdLight1. The grafted regions replacing the equivalent part of the swAlpha-1 AR are indicated with BW numbering. The response was measured in HEK293T cells upon addition of NE (10 μM). n = 21 cells. P = 2.625×10⁻⁵. i, Left, time trace of the relative fluorescent response of nLightR (with or without the ICL2 region grafted from RdLight1) transiently expressed in HEK293T. Saturating concentrations of DA (200 μM) and NE (10 μM) were added consecutively. n = 21 cells for each trace. Right, quantification of the ratio of the average fluorescent responses to DA versus NE from traces shown on left, for each indicator. P = 2.292× 10⁻⁴. j, Same as in (h) but for nLightG and using the ICL2 of dLight1.3b for grafting. P = 0.566. k, Same as in (i) but for nLightG (with or without the ICL2 region grafted from dLight1.3b). P = 2.103× 10⁻³. All data are shown as mean ± SEM and all experiments were repeated at least three times with similar results. The mean values were compared using a two-tailed Students t-test with Welch’s correction.
Extended Data Fig. 2
Extended Data Fig. 2. Additional in vitro characterization of nLightG and nLightR
a, Time trace of fluorescent response of GRABNE1m in HEK293T, and quantification of mean values of GRABNE1m responses to different ligands. NE (10 μM), trazodone (Trz, 100 nM) and yohimbine (Yoh, 100 nM) were added consecutively. Two-tailed Students t-test with Welch’s correction. Error bars represent mean ± SEM. n = 11 cells from 3 independent experiments. n.s., P = 0.9902; **** P = 1.374×10⁻⁸. b, Left, representative images of cell expression for nLightG and GRABNE1m. Right, violin plot quantification and comparison of basal brightness between nLightG and GRABNE1m. Medians are represented by the thin dotted lines. n = 46, 37 cells for nLightG, and GRABNE1m, respectively, from 3 independent experiments. n.s., not significant. P = 0.4839. Two-tailed Students t-test with Welch’s correction. c, One-photon fluorescence excitation (λem = 560 nm) and emission (λex = 470 nm) spectra acquired from nLightG-expressing HEK293T cells in the presence (Sat) or absence (Apo) of NE (100 μM). Each trace is the average of four independent experiments. c, same as in (c) for nLightR (λem = 620 nm and λex = 550 nm). Each trace is the average of three independent experiments. Fluorescence excitation and emission were normalized to the respective maximal value in the absence of NE (Apo). e, Two-photon brightness of nLightG imaged in transfected HEK cells grown attached to a glass coverslip in the presence (Sat) or absence (Apo) of NE (100 μM). Spectra are normalized to the value of the Apo form at 950 nm. The ratio between Sat and Apo at all wavelengths is also shown as black dotted line. Each trace is the average of 3 independent experiments. f, Left, normalized fluorescence intensity dose-response curves of NE in nLightG- and nLightR-expressing primary rat cortical neurons. Each titration is normalized to the maximum ΔF/F0 response of the indicator. Datapoints were fitted with four-parameter dose-response curves to determine EC50 values. n = 11 cells for nLightG and n = 3 cells for nLightR from three independent experiments. Right, quantification of maximal ΔF/F0 response of nLightG- and nLightR-expressing primary rat cortical neurons to NE or DA. Both ligands were separately applied at 300 μM concentration on the cells. n = 11-24 cells for nLightG and n = 5 cells for nLightR. Average response to DA was compared to that to NE for each indicator, using a two-tailed Students t-test with Welch’s correction. P values: 3.421x10⁻⁹, nLightG; 2.240x10⁻⁶, nLightR. g, Maximal fluorescence response of nLightG in HEK293T cells upon addition of different small molecule neurotransmitters (in HBSS) at a final concentration of 10 μM. The mean values were compared to the control (pure HBSS) using Welch ANOVA with Dunett’s multiple comparison test. The data are shown as mean ± SEM. n ≥ 21 cells. P values were as follows: norepinephrine, <0.0001; epinephrine, <0.0001; dopamine, <0.0001; serotonin, 0.066; acetylcholine, 0.999; adenosine, 0.705; histamine, 0.999; γ-aminobutyric acid, 0.999; glutamic acid, 0.999. h, same as in (g) for nLightR. P values were as follows: norepinephrine,<0.0001; epinephrine, <0.0001; dopamine, <0.0001; serotonin, 0.887; acetylcholine, 0.998; adenosine, 0.999; histamine, 0.999; γ-aminobutyric acid, 0.999; glutamic acid, 0.998. All experiments were repeated at least three times with similar results.
Extended Data Fig. 3
Extended Data Fig. 3. Signaling characterization of nLightG and nLightR
a, Intracellular calcium signaling recorded in HEK293T cells co-expressing nLightG (left) or the swAlpha-1 AR (right) along with the red fluorescent calcium indicator jRGECO1a. Fluorescence response of the calcium indicator was measured at baseline conditions, upon addition of NE (10 μM final concentration) and upon addition of ionomycin (10 μM final concentration), as indicated by the colored bars. Signals were normalized to the maximum response of the same cells after addition of 10 μM ionomycin. n= 19 and 22 cells for swAlpha-1 AR-jRGECO1a and nLightG-jRGECO1a. b, Statistical analysis of the responses shown in (a) for nLightG. Individual data points represent the mean ΔF/F0 response of jRGECO1a for each cell upon addition of NE. Violin plot represents the kernel density estimate of the probability density function for each sample. Mean values before and after addition of NE were compared using a two-tailed Students t-test with Welch’s correction. P = 2.887x10⁻⁷. c, Same as in a but for nLightR in combination with the green fluorescent calcium indicator GCaMP6s. n = 21 and 23 cells for swAlpha-1 AR-GCaMP6s and nLightR-GCaMP6s, respectively. d, Same as in b but for the data shown in c for nLightR in combination with GCaMP6s. P = 3.393x10⁻²¹. e, Time traces of the luminescence ratio of HEK293T cells co-expressing either nLightG (green traces), the swAlpha-1 AR (grey traces) or the hmDRD1 (blue traces) fused to SmBiT and a mini G-protein or β-arrestin-2 fused to LgBiT. NE (10 μM final concentration) or FluoroBrite DMEM was added to the cells between 490 s and 520 s. The luminescence ratio between stimulated and non-stimulated cells was calculated and normalized to the baseline luminescence ratio before the addition of NE. Each trace is the average of three independent experiments. f, Same as in e but for nLightR (magenta traces). g, Statistical analysis of data shown in e and f. The mean luminescence ratios before and after the addition of NE were calculated and compared using a two-tailed Students t-test with Welch’s correction. P values were as follows: mini-Gq, swAlpha-1 AR, 7.75×10⁻³; nLightG, 0.590; nLightR, 0.589; mini-Gs, swAlpha-1 AR, 3.88×10⁻³; nLightG, 0.281; nLightR, 0.410; mini-Gi, swAlpha-1 AR, 0.126; nLightG, 0.792; nLightR, 0.147; β-arrestin-2, swAlpha-1 AR, 8.97×10⁻²; nLightG, 0.134; nLightR, 0.377. All data are shown as mean ± SEM and all experiments were repeated three times with similar results.
Extended Data Fig. 4
Extended Data Fig. 4. Pharmacological characterization of nLightG and GRABNE1m in anesthetized mice
a, Schematic representation of viral injections for photometry recordings of nLightG or GRABNE1m in vHPC during optogenetic stimulation of LC in anesthetized mice. b, Experimental protocol for optogenetic stimulation combined with drug injection during isoflurane anaesthesia. c, Left, average traces of normalized signal changes (ΔF/F0 %) of GRABNE1m photometry recordings in response to three LC optical stimulation protocols (5 Hz) pre- and post-yohimbine injection. Signals were normalized to the average peak value pre-yohimbine. The period of optogenetic stimulation is represented with an orange shade. Right, statistical comparison of peak normalized ΔF/F0 % responses to 5Hz LC between pre- and post-yohimbine injection. P = 0.0014, n = 7 mice, one-sample t-test. d, Same as in c for nLightG. n.s., non-significant (P = 0.31), n = 9 mice, one-sample t-test.
Extended Data Fig. 5
Extended Data Fig. 5. Processing of fiber photometry data presented in Figure 4
a, Processing of an exemplary trace of fiber photometry data in response to optogenetic stimulation (magenta), stimulated and recorded in the same LC. nLightG was excited at wavelengths of 470/10 (“ligand-dependent”) and 405/10 nm (“control”), in a temporally interleaved manner. Note that excitation power was adjusted such that the emission power of both excitation modes was of comparable intensity. Data chunks of 10 minutes, 30 seconds, and 5 seconds duration are shown from left to right, dashed boxes indicate the magnified regions. In a first step, the raw data was fitted with a polynomial function of 1st-4th degree (based on visual inspection; black line) in order to capture the bleaching of each trace (top). Subsequently, each signal was divided by this fit, in order to correct for bleaching and normalize the signals to an amplitude of 1 (center top). In the next step, signals were smoothed with a moving average filter of a 100 ms window size (center bottom). Finally, ΔF/F0 was calculated as the difference between the bleaching-corrected, normalized, smoothed signals excited at 470/10 and 405/10 nm (bottom). While original signals contained substantial artefacts likely to originate from locomotion (e.g. large, slow peaks in the left column of the raw signal (top)) and hemodynamics (most obvious seen by the oscillations of 10-13 Hz likely to originate from the animal’s heartbeat 59; best seen in the bleaching-corrected, unsmoothed trace in the right column), these artefacts can be substantially reduced by subtracting the 405/10 nm excited signal from the 470/10 nm excited signal (bottom). b, Heatmap of 20 individual trials of optogenetic stimulation, corresponding to the processing steps shown in a. c, Mean ± standard deviation of the trials shown in b. d, Correlating the z-scored data across all animals (n = 6) excited at 405/10 nm vs 470/10 nm reveals a strong positive relationship of the functional and the isosbestic channel (Pearson’s correlation coefficient r = 0.61), likely to originate from motion and hemodynamic artefacts, which act in a similar manner on the light emitted by nLightG. e/f, Correlating the z-scored data across all animals (n = 6) excited at 470/10 nm e and 405/10 nm f against the calculated ΔF/F0 revealed strong positive (Pearson’s correlation coefficient r = 0.61) and moderate negative (Pearson’s correlation coefficient r = -0.19) relationships, as expected from the strong increase in emission light upon norepinephrine-binding when exciting nLightG at 470/10 nm, and the milder decrease in emission light upon norepinephrine-binding when exciting nLightG at 405/10 nm. g, Pearson’s correlation coefficients calculated for each animal (n = 6) individually, when correlating 405/10 nm vs 470/10 nm excited signals (left), 470/10 nm vs ΔF/F0 (center), and 405/10 nm vs ΔF/F0 (right). While the positive or negative sign of the correlations depend upon which signal is subtracted from the other (i.e. 470-405 nm vs. 405-470 nm), the strength of correlations as well as the opposing sign of the 470/10 nm vs ΔF/F0 as compared to the 405/10 nm vs ΔF/F0 agree with the expected modulations upon binding of norepinephrine by nLightG.
Extended Data Fig. 6
Extended Data Fig. 6. Running-induced nLightG signals in the mouse hippocampus
a, Event-triggered averages for individual animals (n = 4) showing the changes in nLightG signal amplitude over the whole field-of-view when the mouse started running for the five consecutive recording days. Signals were recorded using two-photon microscopy. The colors indicate the different animals (subject 1-4). b, Event-triggered averages of running speed of individual animals in the virtual corridor when the mouse started running. Color code as in a. c, Same as in b for lick rate. d, Structural similarity in the time interval displayed in a-c. e, nLightG signal amplitude as a function of running speed for individual animals. f, nLightG signal amplitude as a function of lick rate for individual animals.
Extended Data Fig. 7
Extended Data Fig. 7. nLightG signals associated with reward position in the mouse hippocampus
a, Event-triggered averages for individual animals (n = 4) showing the changes in nLightG signal amplitude over the whole field-of-view when the mouse crossed the reward position for the five consecutive days of recording. Signals were recorded using two-photon microscopy. The colors indicate the different animals (subject 1-4). b, Event-triggered averages of running speed of individual animals in the virtual corridor when the mouse crossed the reward position. Color code as in a. c, Same as in b for lick rate. d, Structural similarity in the time interval displayed in a-c. e, nLightG signal amplitude as a function of running speed for individual animals. f, nLightG signal amplitude as a function of lick rate for individual animals.
Extended Data Fig. 8
Extended Data Fig. 8. ROI selection for analysis of in vivo two-photon data
a-b, Representative field-of-view showing hippocampal CA1 neurons expressing nLightG in vivo (same field-of-view as in Fig. 5j). The red solid line in (a) indicates the zoomed in area shown in (b). White boxes indicate regions-of-interest (ROIs) identified within the field-of-view and centered on putative cells using the machine learning algorithm CITE-On. Scale bar, 50 μm.
Extended Data Fig. 9
Extended Data Fig. 9. Further comparison between newly-developed and published indicators
a, Basal brightness of LightG and LightR indicator constructs plotted against their fluorescence response ΔF/F0 in HEK293T cells. Basal brightness values reflect the average brightness of indicator-expressing HEK293T cells in the ligand-free state. Grafts containing only the ICL3 module of LightG or LightR are represented as triangles. Grafts containing ICL2 and ICL3 modules of LightG or LightR are represented as circles. Previously published indicators are represented as rectangles. b, Absolute changes in fluorescence (ΔF) of LightG (green) and LightR (red) grafts measured in HEK293T cells for a set of ten GPCRs. n = 21 cells from three independent experiments. Data were obtained from the same imaging experiments shown in Figure 5. c, Heatmap of ΔF for a subset of indicators (those with ΔF > 0.3). Scale bars, 20 μm.
Extended Data Fig. 10
Extended Data Fig. 10. Ligand EC50 measurements for a subset of new indicators
Normalized fluorescence intensity dose-response curves of AchLightR (AchLightR-DG, hmM3R double graft), AchLightG (AchLightG-SG, hmM3R single-graft, light green; AchLightG-DG, double graft, dark green), HisLightG (hmH4R, double-graft) and AdoLightG (hmA2AR, double-graft) expressed on HEK293T cells and titrated with their endogenous agonists. Datapoints were fitted with four-parameter dose-response curves to determine the EC50 values. n=3 wells per concentration for each ligand. All data are shown as mean ± SEM and all experiments were repeated three times with similar results.
Figure 1
Figure 1. In vitro properties of nLightG and nLightR
a, Structural models of nLightG (left) and nLightR (right) generated using ColabFold. b, Representative images of HEK293T cells and neurons expressing nLightG or nLightR before/after application of NE (10 μM) and corresponding pixel-wise ΔF/F0 heatmaps. White insets indicate surface expression of the indicators. Scale bars, 10 μm (HEK293T), 20 μm (neurons). c, Left, timelapse of fluorescence of response (ΔF/F0) of nLightG in HEK293T (dark green) or neurons (light green) upon application of NE (10 μM) followed by application of trazodone (Trz, 10 μM). Right, quantification of maximal ΔF/F0 responses from left. Two-tailed Students t-test with Welch’s correction. n = 3 independent experiments with n=22 cells (HEK293T), n=18 cells (neurons). P = 2.979×10⁻¹⁶ (HEK293T), P = 8.558×10⁻¹⁷ (neurons). d, Same as in c for nLightR. n = 3 independent experiments with n = 21 cells (HEK293T), n=6 cells (neurons). P = 5.922×10⁻³² (HEK293T), P = 0.004 (neurons). e, Fluorescence dose-response curves of nLightG (left) and GRABNE1m (right) for NE and DA in HEK293T cells normalized to the maximum ΔF/F0 for NE for each indicator. Datapoints were fitted with four-parameter dose-response curves to determine EC50 values. n=6,5,3 wells for nLightG with NE, nLightG with DA, and GRABNE with NE/DA, respectively. f, Same as in e for nLightR with n=3 wells. All data are shown as mean ± SEM. g, Representative heatmap of nLightG fluorescence response (ΔF/F0 %) in an outside-out membrane patch from nLightG-expressing HEK293T cells (n = 6 independent experiments). Scale bar, 50 μm. h, ON and OFF kinetics of nLightG (top) and GRABNE1m (bottom) after ultrafast (<0.5 ms) switching of the perfusion pipette. Dots represent the average of 5 applications. Kinetic parameters were obtained using single-exponential fits on the average of all trials. i, Statistical comparison of kinetic parameters. Unpaired two-tailed Student’s t test. n=6 and 5 patches for nLightG and GRABNE1m, respectively. P = 3.0 ×10⁻⁸ON), P = 2.7 ×10⁻⁵OFF). Mean ± standard deviation are shown. j, Five consecutive NE applications on nLightG (5 μM, 1 s). Images were acquired at 100 Hz. All experiments were repeated at least three times with similar results.
Figure 2
Figure 2. Ex vivo and in vivo benchmarking of nLightG and nLightR
a, Experiment schematics. b, Left, representative nLightG response to perfusion of NE (50 μM) and wash-out. Right, quantification of nLightG responses (two-sided paired t-test, P=0.0308, n=4 slices from 3 mice). c, Same as b, for nLightR (two-sided paired t-test, P = 0.0434, n=4 slices from 2 mice). d, Left, representative nLightG response to subsequent perfusions of DA (50 μM), NE (50 μM) and trazodone (Trz, 10 μM). Right, quantification of nLightG responses (repeated measures one-way ANOVA, P=0.0006 and Tukey’s multiple comparison test, P=0.0005 for DA against NE and P=0.0087 for NE against NE+Trz , n=6 slices from 2 mice). e, Same as d, for nLightR (repeated measures one-way ANOVA, P=0.0040 and Tukey’s multiple comparison test, P=0.0034 for DA against NE and P=0.0277 for NE against NE+Trz, n=4 slices from 2 mice). f, Same as e for GRABNE1m. (repeated measures oneway ANOVA, P=4.572 x 10⁻⁵ and Tukey’s multiple comparison test, P=8.501 x 10⁻⁵ for DA against NE, n=7 slices from 3 mice). g, Representative images of indicator expression and fluorescence responses. Scale bars, 100 μm. h, Left, average traces of nLightG responses to electrical stimulation using increasing numbers of pulses (1, 10, 100 pulses). Right, quantification of peak responses (two-tailed paired t-test, P=0.0018, n=9 slices from 2 mice). i, Same as in h for GRABNE1m. n=8 slices from 3 mice. j, Same as in i for nLightR. n=6 slices from 2 mice. k-l, Experiment schematics. m, Left, average traces of fluorescence response from nLightG-expressing animals after injection of different drugs (saline, Sal; trazodone, Trz; yohimbine, Yoh). Right, quantification of peak ΔF/F0 responses from left. Peak values were compared to the control (Sal). P=0.0013 for Trz, P=0.0345 for Yoh, n=8 mice. n, Same as m, for GRABNE1m. P=0.9010 for Trz, P=0.0015 for Yoh, n=7 mice. o, Same as m, for nLightR. P=0.0329 for Trz, P=0.457 for Yoh, n=5 mice. m-o, Analyses were performed with repeated measures one-way ANOVA with Dunnett’s multiple comparisons test. b-o, All data are mean ± S.E.M. All experiments were repeated at least three times with similar results.
Figure 3
Figure 3. In vivo dual-site recording of optogenetically-evoked NE release using nLightG
a-c, Experimental schematics and histological verification for targeting LC (a) and dHPC (b). d, Example traces of pupil diameter (bottom) and simultaneously recorded nLightG fluorescence in the dHPC (center) and LC (top) upon optogenetic LC stimulation (4-second-long pulse train with 20 ms pulses at 40 Hz; 595 nm; 10 mW at fiber tip; pink bars). e, Mean ± SD of the recording shown in d (n=20 trials). f, Mean ± SD of nLightG fluorescence from LC in response to optogenetic stimulation (n=15 trials, 1 mouse) performed after indicated treatments. g, Peak ΔF/F0 of baseline-normalized averaged responses (One-way ANOVA, P=3.17×10⁻⁶ and Tukey’s test, P=1×10⁻⁴/1×10-5 for no injection/NaCl vs. desipramine; n=6 mice) and hoff of averaged responses (One-way ANOVA, P=1.89×10⁻⁹ and Tukey’s test, P=9.8×10⁻⁹/9.4×10-9 for no injection/NaCl vs. desipramine; n=6 mice) shown in f. i, Mean ± SD of simultaneously recorded nLightG fluorescence in the LC (left), dHPC (center), as well as pupil diameter (right) in an exemplary mouse, in response to pulses presented at 1, 5, and 20 Hz (n=20 trials each). j-k, Peak ΔF/F0 of averaged nLightG fluorescence in the LC (j) and dHPC (k) as a function of pupil dilation upon optogenetic stimulation (Pearson’s correlation coefficient r=0.84/0.83, P=9.5×10⁻¹¹/4.8×10-1° for LC/dHPC; n=6 mice). l, Normalized responses of simultaneously recorded nLightG in the LC (top) and dHPC (bottom), during optogenetic LC stimulation (n = 6 mice). m, τoff of averaged responses shown in l. P10=0.0025, two-sided two-sample t-test, n=6 mice. (n) Mean ± SD of simultaneously recorded nLightG fluorescence from hippocampi in both hemispheres (columns) upon stimulation of either the left (top) or the right (bottom) LC (n=15 trials each). o, Peak ΔF/F0 of each dHPC upon ipsilateral (left) or contralateral (right) LC stimulation.. Pn=1.97×10⁻⁷, two-sided one-sample t-test, n=12 dHPC from n=6 mice. p, Contralateral divided by ipsilateral average response per mouse; 34.6±11 %; P5=2.4×10⁻⁵, two-sided one-sample t-test against 1; n=6 mice. n, o and p recorded under isoflurane anesthesia, all others in awake mice. All data are shown as mean ± standard deviation.
Figure 4
Figure 4. Two-photon imaging of NE signals in awake behaving mice using nLightG
a-b, Experiment schematics. c, On day 1, 2, and 3, rewards were delivered at 85 cm from the start of the corridor. On day 3 at half of the recording session the reward delivery was repositioned to 145 cm, where it remained through days 4 and 5. d, Representative average time-projections of FOV, (images are scaled to their maximum, scale bar 50 μm). e, Event-triggered averages showing changes in nLightG signal amplitude over the whole field-of-view upon running (magenta) and reward position crossing (green) for the five days of recording. f-g, Event-triggered averages of animals’ speed (f) and lick rate (g) in the virtual corridor upon running initiation (magenta) and at reward position crossing (green). h-i, nLightG signal amplitude over the whole field-of-view as a function of running speed (h) and lick rate (i) for event-triggered averages upon running initiation (magenta) and reward position crossing (green, day 1-5). In h-i, * p < 0.05 Two-sided Rank-sum test, H0: slope of the linear model equals to 0 (for each test n=4 animals); n.s. not significant. In h p values are as follows, day 1: P(run)=2.48x10⁻¹, P(reward)=2.48x10⁻¹; day 2: P(run)=2.09x10⁻², P(reward)=2.48x10⁻¹; day 3: P(run)=2.09x10⁻², p(reward)=2.09x10⁻²; day 4: P(run)=2.09x10⁻², P(reward)=2.09x10⁻²; day 5: P(run)=2.09x10⁻², P(reward)=2.09x10⁻². In i, P value equals 2.09x10⁻² for all sessions. In e-i, lines and shaded areas indicate (mean ± SD). j, Representative field-of-view showing nLightG-expressing hippocampal CA1 neurons. White boxes indicate regions-of-interest (ROIs) identified in the field-of-view using CITE-On (scale bar 50 μm). k, Event-triggered averages showing ΔF/F0 of nLightG signal when the mouse started running for all the ROIs identified in j. l, Lower-left triangle: cross-correlation matrix for all traces extracted from the ROIs displayed in j-k. Upper-right triangle: corresponding hierarchical clustering. m-n, Same as in k-l, but for event-triggered averages when the mouse crossed the reward position. o, Density map showing Pearson’s correlation value of nLightG signals from pairs of ROIs during reward position crossing as a function of that obtained during running. Data from 897,000 pairs from 6,000 ROIs in 4 mice over 5 imaging sessions.
Figure 5
Figure 5. Rapid engineering of other multicolor GPCR-indicators
a, Schematic illustration of a strategy for the two-step modular development of multicolor GPCR-based indicators using the LightR and LightG modules. b, Aminoacid sequence alignment of the LightG and LightR modules with portions of the human D1 receptor (hmDRD1). Individual residue differences between LightR and LightG are highlighted in orange. Helix-forming amino acids of hmDRD1 (according to the AlphaFold structural model of the receptor, Supplementary Figure 1) are indicated by grey boxes. The initial and terminal residues of the respective LightR and LightG building blocks (black frames) are numbered according to the Ballesteros-Weinstein numbering of hmDRD1. c, Quantification of the maximal ΔF/F0 response to bath-applied ligands (all tested at 10 μM concentration) of all generated green indicators. With the exception of msCX3CR1 DG (500 nM) and GRABATP1.0 (50 μM), for every experiment the ligand was added to a final concentration of 10 μM. The corresponding indicator-ligand pairs used were as follows: sperm whale Alpha-1 AR: swAlpha-1 AR, norepinephrine; human muscarinic M3 receptor: hmM3R, acetylcholine; human serotonin 5HT4 receptor: hm5HT4, serotonin; human adenosine 2A receptor: hmA2AR, adenosine; mouse CX3CR1 receptor: msCX3CR1, mouse fractalkine; GRABeCB2.0, 2-arachidonyl glycerol ether; GRABATP1.0, ATP; GrAB5HT1.0, 5HT; GRABACh3.0, acetylcholine; GRABNE1m, norepinephrine; OxLight1, Orexin-A; dLight1.3b, DA. Mean ΔF/F0 values of single-graft (only ICL3 replaced by grafting) and double-graft (ICL3 and ICL2 replaced by grafting) for each receptor were compared using a two-tailed Students t-test with Welch’s correction. P values (from left to right): 0.566; 7.342×10⁻⁵; 6.466×10⁻⁸; 4.143×10⁻³; 8.298×10⁻⁷; 1.355×10⁻⁵; 2.072×10⁻²; 3.629×10⁻¹⁶; 1.748×10⁻¹⁷; 8.324×10⁻⁸. d, Same as in c for red indicators. RdLight response was measured with 10 μM DA. P values (from left to right): 2.625×10⁻⁴; 2.910×10⁻¹⁹; 3.019×10⁻³; 0.477; 9.690×10⁻⁴; 5.954×10⁻²; 2.124×10⁻¹⁰; 4.593×10⁻²; 6.331×10⁻⁶; 6.032×10⁻². c-d, n = 21 cells from 3 independent experiments for each indicator. Data are shown as mean ± S.E.M.

Similar articles

Cited by

References

    1. Labouesse MA, Patriarchi T. A versatile GPCR toolkit to track in vivo neuromodulation: not a one-size-fits-all sensor. Neuropsychopharmacology. 2021:1–5. doi: 10.1038/s41386-021-00982-y. - DOI - PMC - PubMed
    1. Wu Z, Lin D, Li Y. Pushing the frontiers: tools for monitoring neurotransmitters and neuromodulators. Nat Rev Neurosci. 2022;23:257–274. - PMC - PubMed
    1. Patriarchi T, et al. An expanded palette of dopamine sensors for multiplex imaging in vivo. Nat Methods. 2020;17:1147–1155. - PMC - PubMed
    1. Sun F, et al. Next-generation GRAB sensors for monitoring dopaminergic activity in vivo. Nature Methods. 2020;17:1156–1166. - PMC - PubMed
    1. Sara SJ. The locus coeruleus and noradrenergic modulation of cognition. Nat Rev Neurosci. 2009;10:211–223. - PubMed

Publication types

Substances