. 2023 Jul 20;15(1):66.
doi: 10.1186/s13321-023-00734-8.

The BinDiscover database: a biology-focused meta-analysis tool for 156,000 GC-TOF MS metabolome samples

Affiliations

The BinDiscover database: a biology-focused meta-analysis tool for 156,000 GC-TOF MS metabolome samples

Parker Ladd Bremer et al. J Cheminform. .

Abstract

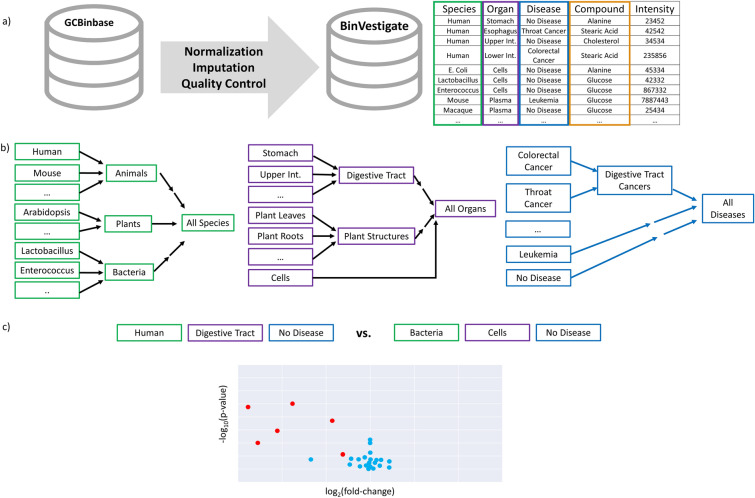
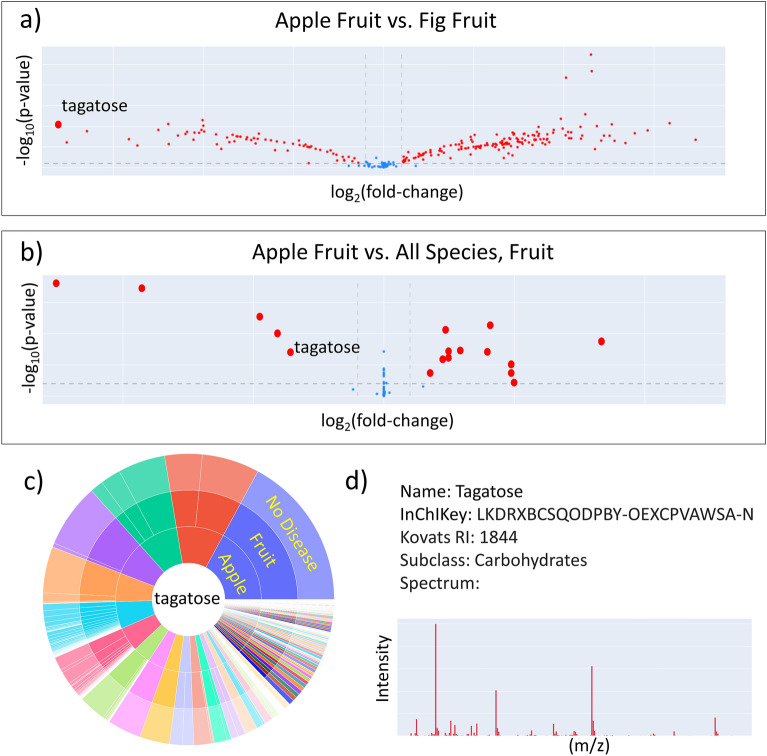
Metabolomics by gas chromatography/mass spectrometry (GC/MS) provides a standardized and reliable platform for understanding small molecule biology. Since 2005, the West Coast Metabolomics Center at the University of California at Davis has collated GC/MS metabolomics data from over 156,000 samples and 2000 studies into the standardized BinBase database. We believe that the observations from these samples will provide meaningful insight to biologists and that our data treatment and webtool will provide insight to others who seek to standardize disparate metabolomics studies. We here developed an easy-to-use query interface, BinDiscover, to enable intuitive, rapid hypothesis generation for biologists based on these metabolomic samples. BinDiscover creates observation summaries and graphics across a broad range of species, organs, diseases, and compounds. Throughout the components of BinDiscover, we emphasize the use of ontologies to aggregate large groups of samples based on the proximity of their metadata within these ontologies. This adjacency allows for the simultaneous exploration of entire categories such as "rodents", "digestive tract", or "amino acids". The ontologies are particularly relevant for BinDiscover's ontologically grouped differential analysis, which, like other components of BinDiscover, creates clear graphs and summary statistics across compounds and biological metadata. We exemplify BinDiscover's extensive applicability in three showcases across biological domains.

Keywords: Gas chromatography; Mass spectrometry; Meta-analysis; Metabolomics; Ontologies.


Conflict of interest statement

The authors declare no competing interests.

Figures

Fig. 1
Fig. 1
Overall workflow for BinDiscover database queries. a BinBase records observations from 156,174 metabolomic samples run on a GC–TOF mass spectrometer from 2005 to 2021. Corresponding biological metadata were curated and the resulting annotation table formed the basis of the exploratory webtool BinDiscover. b BinDiscover associates metabolite intensities across species, organs, and diseases. Established ontologies are used to order biological metadata for queries. For metabolites, we used the ClassyFire ontology to enable compound class-level queries. c Biological metadata are associated with all samples and are represented and can be queried via different ontology levels, such as “digestive system” or “bacteria”. Species, organ and disease ontologies are highlighted by colors
Fig. 2
Fig. 2
Sample count for all combinations of biological metadata triads. Triads with fewer than 10 samples (red) were removed to increase statistical reliability
Fig. 3
Fig. 3
Schema for ontologically grouped differential analysis. Example query human digestive tract versus bacterial metabolomes. a All BinBase samples with metadata that ontologically map to (Human, Digestive System without Disease) were compared to samples that mapped to (Bacteria Cells without Disease). b Such ontology-based summary queries yield a set of biological metadata combinations that are then subjected to pairwise differential analysis. c For each compound, pairwise differential analysis yields a matrix of p-values and a matrix of fold changes that can be conservatively described by the maximum p-value and minimum fold-change, respectively. Therefore, only one point is visualized per compound in downstream volcano plots
Fig. 4
Fig. 4
Queries in BinDiscover give novel biological insights. a Comparing the metabolome of a specific organ across two different species, here: apple vs. fig fruits, yields many differences. b Comparing that specific organ (apple fruit) against the same organ of all species constrains overall differences to a few metabolites. c One differential apple metabolite, tagatose, was then queried and found to be the most abundant in apple fruits compared to all other species/organ combinations across the metabolome database. d Chemical information for tagatose is then given as mass spectrum, quantification mass, international chemical identifier, retention index and chemical class ontology
Fig. 5
Fig. 5
Sequential queries extract unknown metabolites associated with cancer metabolism. a Integrating results from three BinDiscover queries comparing liver, lung and pancreas cancer studies with and without cancer yields three sets of compounds. Results are separated here between identified and unknown compounds. b BinDiscover gives spectra and chemical metadata to enable chemists to utilize unknown compounds in their own studies, either for targeting these compounds in their own studies or for compound identification. Here, unknown 110,321 is displayed.
Fig. 6
Fig. 6
Comparison of the gas chromatography metabolomes of bacteria in BinDiscover. a A heatmap of all metabolites in BinDiscover against all available bacteria species. Matrix entry color is determined by percent presence of that metabolite in that species. Four regions of interest (1)–(4) are highlighted in green and discussed in the text. b A differential comparison of metabolomic abundances in bacteria species against the methane-metabolizing species Methylomonas denitrificans

References

    1. MassBank of North America (2022) https://massbank.us/. Accessed 24 Oct 2022
    1. Wang M, Carver JJ, Phelan VV, et al. Sharing and community curation of mass spectrometry data with global natural products social molecular networking. Nat Biotechnol. 2016;34:828–837. doi: 10.1038/nbt.3597. - DOI - PMC - PubMed
    1. Metabolomics Workbench (2022) https://www.metabolomicsworkbench.org/. Accessed 24 Oct 2022
    1. Haug K, Cochrane K, Nainala VC, et al. MetaboLights: a resource evolving in response to the needs of its scientific community. Nucleic Acids Res. 2020;48:D440–D444. doi: 10.1093/nar/gkz1019. - DOI - PMC - PubMed
    1. ReDU: a framework to find and reanalyze public mass spectrometry data | Nature methods. https://www.nature.com/articles/s41592-020-0916-7. Accessed 5 June 2023 - PMC - PubMed