

A machine learning based approach to identify carotid subclinical atherosclerosis endotypes
- PMID: 37475157
- PMCID: PMC10730242
- DOI: 10.1093/cvr/cvad106
A machine learning based approach to identify carotid subclinical atherosclerosis endotypes
Abstract
Aims: To define endotypes of carotid subclinical atherosclerosis.
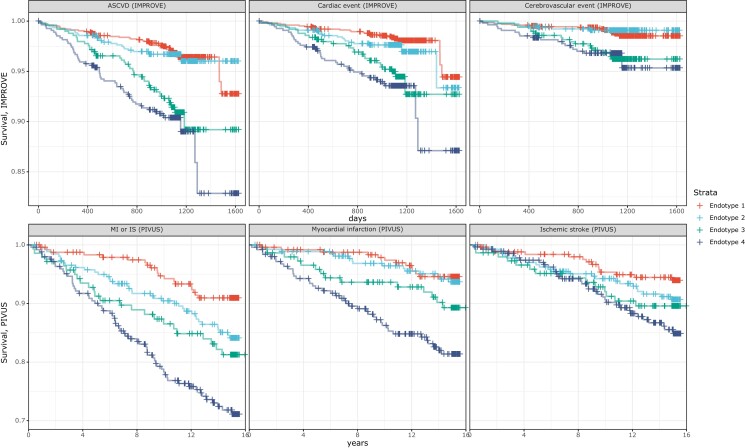
Methods and results: We integrated demographic, clinical, and molecular data (n = 124) with ultrasonographic carotid measurements from study participants in the IMPROVE cohort (n = 3340). We applied a neural network algorithm and hierarchical clustering to identify carotid atherosclerosis endotypes. A measure of carotid subclinical atherosclerosis, the c-IMTmean-max, was used to extract atherosclerosis-related features and SHapley Additive exPlanations (SHAP) to reveal endotypes. The association of endotypes with carotid ultrasonographic measurements at baseline, after 30 months, and with the 3-year atherosclerotic cardiovascular disease (ASCVD) risk was estimated by linear (β, SE) and Cox [hazard ratio (HR), 95% confidence interval (CI)] regression models. Crude estimates were adjusted by common cardiovascular risk factors, and baseline ultrasonographic measures. Improvement in ASCVD risk prediction was evaluated by C-statistic and by net reclassification improvement with reference to SCORE2, c-IMTmean-max, and presence of carotid plaques. An ensemble stacking model was used to predict endotypes in an independent validation cohort, the PIVUS (n = 1061). We identified four endotypes able to differentiate carotid atherosclerosis risk profiles from mild (endotype 1) to severe (endotype 4). SHAP identified endotype-shared variables (age, biological sex, and systolic blood pressure) and endotype-specific biomarkers. In the IMPROVE, as compared to endotype 1, endotype 4 associated with the thickest c-IMT at baseline (β, SE) 0.36 (0.014), the highest number of plaques 1.65 (0.075), the fastest c-IMT progression 0.06 (0.013), and the highest ASCVD risk (HR, 95% CI) (1.95, 1.18-3.23). Baseline and progression measures of carotid subclinical atherosclerosis and ASCVD risk were associated with the predicted endotypes in the PIVUS. Endotypes consistently improved measures of ASCVD risk discrimination and reclassification in both study populations.
Conclusions: We report four replicable subclinical carotid atherosclerosis-endotypes associated with progression of atherosclerosis and ASCVD risk in two independent populations. Our approach based on endotypes can be applied for precision medicine in ASCVD prevention.
Keywords: ASCVD; Artificial intelligence; Atherosclerosis; Biological markers; Endotype; Progression of atherosclerosis.
© The Author(s) 2023. Published by Oxford University Press on behalf of the European Society of Cardiology.
Conflict of interest statement
Conflict of interest: The authors disclose no conflicts of interest related to the present work.
Figures


References
-
- Townsend N, Kazakiewicz D, Lucy Wright F, Timmis A, Huculeci R, Torbica A, Gale CP, Achenbach S, Weidinger F, Vardas P. Epidemiology of cardiovascular disease in Europe. Nat Rev Cardiol 2022;19:133–143. - PubMed
-
- Sweatt AJ, Hedlin HK, Balasubramanian V, Hsi A, Blum LK, Robinson WH, Haddad F, Hickey PM, Condliffe R, Lawrie A, Nicolls MR, Rabinovitch M, Khatri P, Zamanian RT. Discovery of distinct immune phenotypes using machine learning in pulmonary arterial hypertension. Circ Res 2019;124:904–919. - PMC - PubMed
-
- Tromp J, Ouwerkerk W, Demissei BG, Anker SD, Cleland JG, Dickstein K, Filippatos G, van der Harst P, Hillege HL, Lang CC, Metra M, Ng LL, Ponikowski P, Samani NJ, van Veldhuisen DJ, Zannad F, Zwinderman AH, Voors AA, van der Meer P. Novel endotypes in heart failure: effects on guideline-directed medical therapy. Eur Heart J 2018;39:4269–4276. - PubMed
-
- Baghela A, Pena OM, Lee AH, Baquir B, Falsafi R, An A, Farmer SW, Hurlburt A, Mondragon-Cardona A, Rivera JD, Baker A, Trahtemberg U, Shojaei M, Jimenez-Canizales CE, dos Santos CC, Tang B, Bouma HR, Cohen Freue GV, Hancock REW. Predicting sepsis severity at first clinical presentation: the role of endotypes and mechanistic signatures. EBioMedicine 2022;75:103776. - PMC - PubMed
Publication types
MeSH terms
Grants and funding
LinkOut - more resources
Full Text Sources
Medical
