Knowledge graph aids comprehensive explanation of drug and chemical toxicity
- PMID: 37475158
- PMCID: PMC10431039
- DOI: 10.1002/psp4.12975
Knowledge graph aids comprehensive explanation of drug and chemical toxicity
Abstract
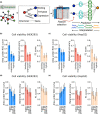
In computational toxicology, prediction of complex endpoints has always been challenging, as they often involve multiple distinct mechanisms. State-of-the-art models are either limited by low accuracy, or lack of interpretability due to their black-box nature. Here, we introduce AIDTox, an interpretable deep learning model which incorporates curated knowledge of chemical-gene connections, gene-pathway annotations, and pathway hierarchy. AIDTox accurately predicts cytotoxicity outcomes in HepG2 and HEK293 cells. It also provides comprehensive explanations of cytotoxicity covering multiple aspects of drug activity, including target interaction, metabolism, and elimination. In summary, AIDTox provides a computational framework for unveiling cellular mechanisms for complex toxicity endpoints.
© 2023 The Authors. CPT: Pharmacometrics & Systems Pharmacology published by Wiley Periodicals LLC on behalf of American Society for Clinical Pharmacology and Therapeutics.
Conflict of interest statement
The authors declared no competing interests for this work.
Figures


Similar articles
-
Short-Term Memory Impairment.2024 Jun 8. In: StatPearls [Internet]. Treasure Island (FL): StatPearls Publishing; 2025 Jan–. 2024 Jun 8. In: StatPearls [Internet]. Treasure Island (FL): StatPearls Publishing; 2025 Jan–. PMID: 31424720 Free Books & Documents.
-
Comparison of Two Modern Survival Prediction Tools, SORG-MLA and METSSS, in Patients With Symptomatic Long-bone Metastases Who Underwent Local Treatment With Surgery Followed by Radiotherapy and With Radiotherapy Alone.Clin Orthop Relat Res. 2024 Dec 1;482(12):2193-2208. doi: 10.1097/CORR.0000000000003185. Epub 2024 Jul 23. Clin Orthop Relat Res. 2024. PMID: 39051924
-
Evidence-based toxicology: a comprehensive framework for causation.Hum Exp Toxicol. 2005 Apr;24(4):161-201. doi: 10.1191/0960327105ht517oa. Hum Exp Toxicol. 2005. PMID: 15957536
-
The health economics of insulin therapy: How do we address the rising demands, costs, inequalities and barriers to achieving optimal outcomes.Diabetes Obes Metab. 2025 Jul;27 Suppl 5(Suppl 5):24-35. doi: 10.1111/dom.16488. Epub 2025 Jun 4. Diabetes Obes Metab. 2025. PMID: 40464081 Free PMC article.
-
The Black Book of Psychotropic Dosing and Monitoring.Psychopharmacol Bull. 2024 Jul 8;54(3):8-59. Psychopharmacol Bull. 2024. PMID: 38993656 Free PMC article. Review.
Cited by
-
Knowledge graph construction for heart failure using large language models with prompt engineering.Front Comput Neurosci. 2024 Jul 2;18:1389475. doi: 10.3389/fncom.2024.1389475. eCollection 2024. Front Comput Neurosci. 2024. PMID: 39015745 Free PMC article.
References
-
- Kleinstreuer NC, Yang J, Berg EL, et al. Phenotypic screening of the ToxCast chemical library to classify toxic and therapeutic mechanisms. Nat Biotechnol. 2014;32:583‐591. - PubMed
Publication types
MeSH terms
Grants and funding
LinkOut - more resources
Full Text Sources

