

Fecal virome transplantation is sufficient to alter fecal microbiota and drive lean and obese body phenotypes in mice
- PMID: 37475473
- PMCID: PMC10364654
- DOI: 10.1080/19490976.2023.2236750
Fecal virome transplantation is sufficient to alter fecal microbiota and drive lean and obese body phenotypes in mice
Abstract
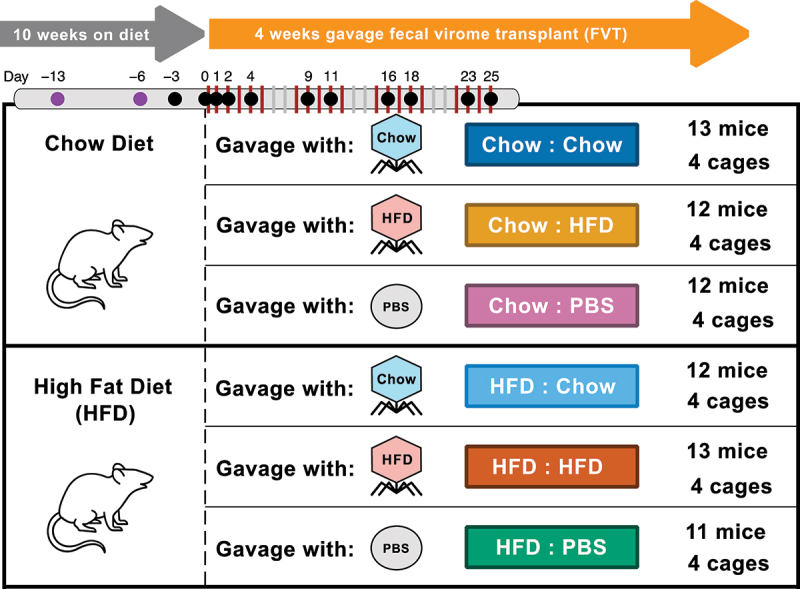
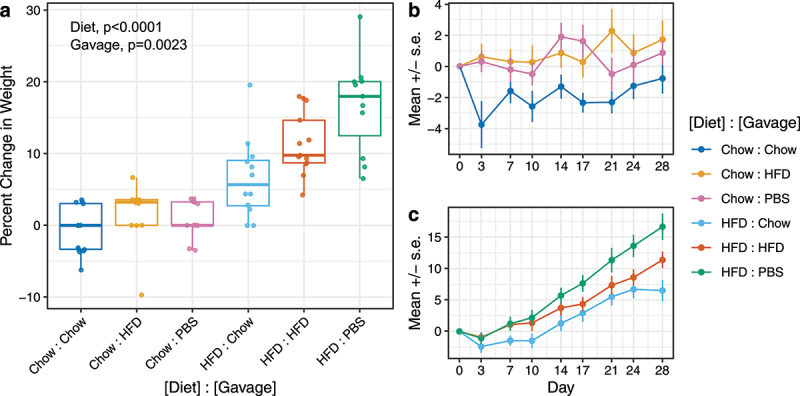
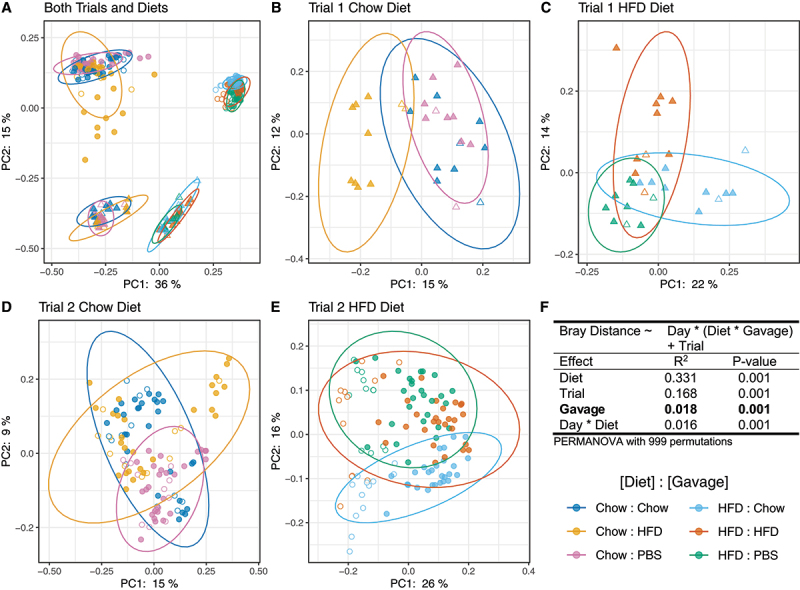
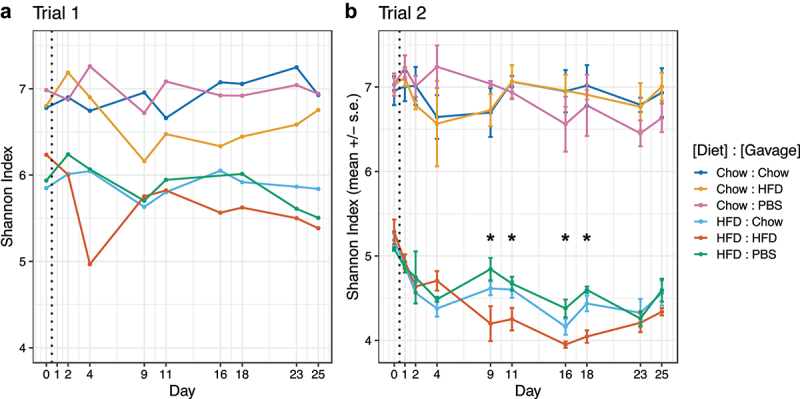
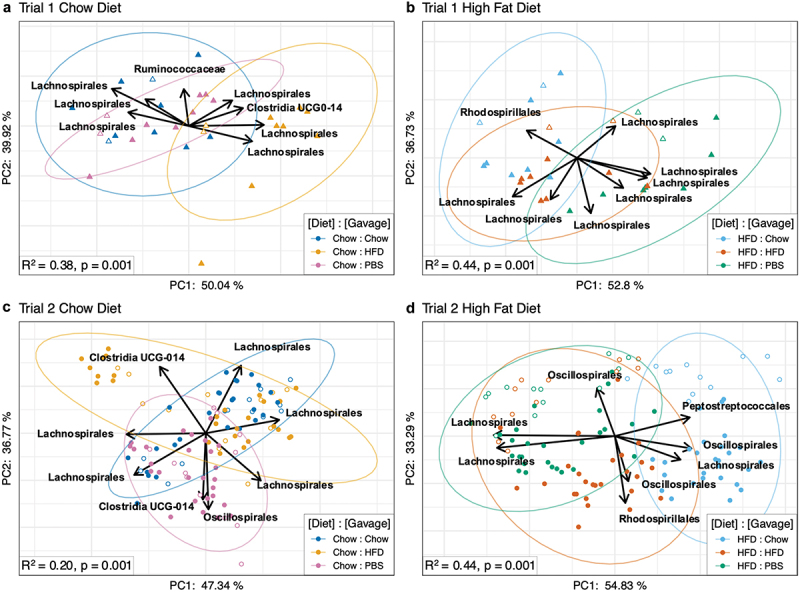
The gastrointestinal microbiome plays a significant role in modulating numerous host processes, including metabolism. Prior studies show that when mice receive fecal transplants from obese donors on high-fat diets (HFD) (even when recipient mice are fed normal diets after transplantation), they develop obese phenotypes, demonstrating the prominent role that gut microbiota play in determining lean and obese phenotypes. While much of the credit has been given to gut bacteria, the impact of gut viruses on these phenotypes is understudied. To address this shortcoming, we gavaged mice with viromes isolated from donors fed HFD or normal chow over a 4-week study. By characterizing the gut bacterial biota via 16S rRNA amplicon sequencing and measuring mouse weights over time, we demonstrate that transplanted viruses affect the gut bacterial community, as well as weight gain/loss. Notably, mice fed chow but gavaged with HFD-derived viromes gained more weight than their counterparts receiving chow-derived viromes. The converse was also true: mice fed HFD but gavaged with chow-derived viromes gained less weight than their counterparts receiving HFD-derived viromes. Results were replicated in two independent experiments and phenotypic changes were accompanied by significant and identifiable differences in the fecal bacterial biota. Due to methodological limitations, we were unable to identify the specific bacterial strains responsible for respective phenotypic changes. This study confirms that virome-mediated perturbations can alter the fecal microbiome in vivo and indicates that such perturbations are sufficient to drive lean and obese phenotypes in mice.
Keywords: High fat diet; bacteriophages; fecal microbiota; gut microbiome; obesity; virome.
Conflict of interest statement
B.S. has been consulting for Ambys Medicines, Ferring Research Institute, Gelesis, HOST Therabiomics, Intercept Pharmaceuticals, Mabwell Therapeutics, Patara Pharmaceuticals and Takeda. B.S.’s institution UC San Diego has received grant support from Artizan Biosciences, Axial Biotherapeutics, BiomX, CymaBay Therapeutics, NGM Biopharmaceuticals, Prodigy Biotech and Synlogic Operating Company. B.S. is founder of Nterica Bio. C.G. is founder and CEO of Bioharmony Therapeutics and CSO of Emily’s Entourage.
Figures
Update of
-
Fecal virome transplantation is sufficient to alter fecal microbiota and drive lean and obese body phenotypes in mice.bioRxiv [Preprint]. 2023 Feb 4:2023.02.03.527064. doi: 10.1101/2023.02.03.527064. bioRxiv. 2023. Update in: Gut Microbes. 2023 Jan-Dec;15(1):2236750. doi: 10.1080/19490976.2023.2236750. PMID: 36778328 Free PMC article. Updated. Preprint.
Similar articles
-
Fecal virome transplantation is sufficient to alter fecal microbiota and drive lean and obese body phenotypes in mice.bioRxiv [Preprint]. 2023 Feb 4:2023.02.03.527064. doi: 10.1101/2023.02.03.527064. bioRxiv. 2023. Update in: Gut Microbes. 2023 Jan-Dec;15(1):2236750. doi: 10.1080/19490976.2023.2236750. PMID: 36778328 Free PMC article. Updated. Preprint.
-
Fecal Viral Community Responses to High-Fat Diet in Mice.mSphere. 2020 Feb 26;5(1):e00833-19. doi: 10.1128/mSphere.00833-19. mSphere. 2020. PMID: 32102942 Free PMC article.
-
Transfer of microbiota from lean donors in combination with prebiotics prevents excessive weight gain and improves gut-brain vagal signaling in obese rats.Gut Microbes. 2024 Jan-Dec;16(1):2421581. doi: 10.1080/19490976.2024.2421581. Epub 2024 Nov 1. Gut Microbes. 2024. PMID: 39485288 Free PMC article.
-
Gut microbes participate in food preference alterations during obesity.Gut Microbes. 2021 Jan-Dec;13(1):1959242. doi: 10.1080/19490976.2021.1959242. Gut Microbes. 2021. PMID: 34424831 Free PMC article. Review.
-
Fecal virome transplantation: A promising strategy for the treatment of metabolic diseases.Biomed Pharmacother. 2024 Aug;177:117065. doi: 10.1016/j.biopha.2024.117065. Epub 2024 Jul 5. Biomed Pharmacother. 2024. PMID: 38971010 Review.
Cited by
-
Bacteriophages, gut bacteria, and microbial pathways interplay in cardiometabolic health.Cell Rep. 2024 Feb 27;43(2):113728. doi: 10.1016/j.celrep.2024.113728. Epub 2024 Jan 31. Cell Rep. 2024. PMID: 38300802 Free PMC article. Review.
-
The Role of Viruses in the Pathogenesis of Immune-Mediated Gastro-Intestinal Diseases.Int J Mol Sci. 2024 Jul 30;25(15):8301. doi: 10.3390/ijms25158301. Int J Mol Sci. 2024. PMID: 39125870 Free PMC article. Review.
-
Intestinal flora and pregnancy complications: Current insights and future prospects.Imeta. 2024 Jan 22;3(2):e167. doi: 10.1002/imt2.167. eCollection 2024 Apr. Imeta. 2024. PMID: 38882493 Free PMC article. Review.
-
Reproducible chemostat cultures to minimize eukaryotic viruses from fecal transplant material.iScience. 2024 Jul 5;27(8):110460. doi: 10.1016/j.isci.2024.110460. eCollection 2024 Aug 16. iScience. 2024. PMID: 39104406 Free PMC article.
-
ACG Clinical Guideline: Malnutrition and Nutritional Recommendations in Liver Disease.Am J Gastroenterol. 2025 May 1;120(5):950-972. doi: 10.14309/ajg.0000000000003379. Epub 2025 May 2. Am J Gastroenterol. 2025. PMID: 40314389
References
Publication types
MeSH terms
Substances
Grants and funding
LinkOut - more resources
Full Text Sources