. 2023 Sep;601(18):4013-4032.
doi: 10.1113/JP284730. Epub 2023 Jul 20.

What determines the optimal pharmacological treatment of atrial fibrillation? Insights from in silico trials in 800 virtual atria

Affiliations

What determines the optimal pharmacological treatment of atrial fibrillation? Insights from in silico trials in 800 virtual atria

Albert Dasí et al. J Physiol. 2023 Sep.

Abstract

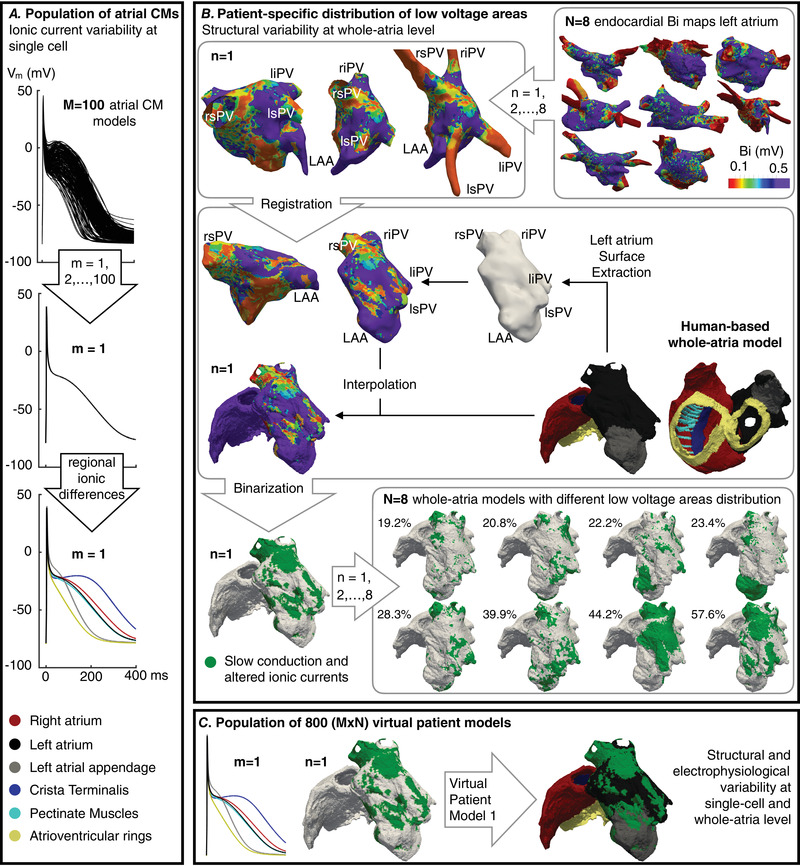
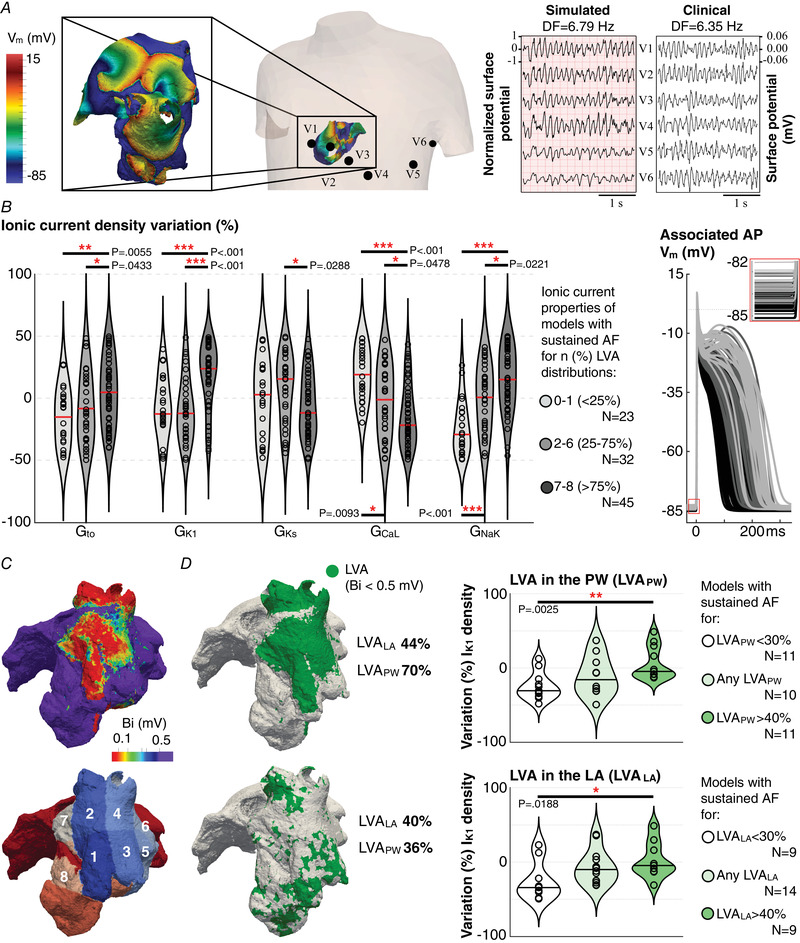
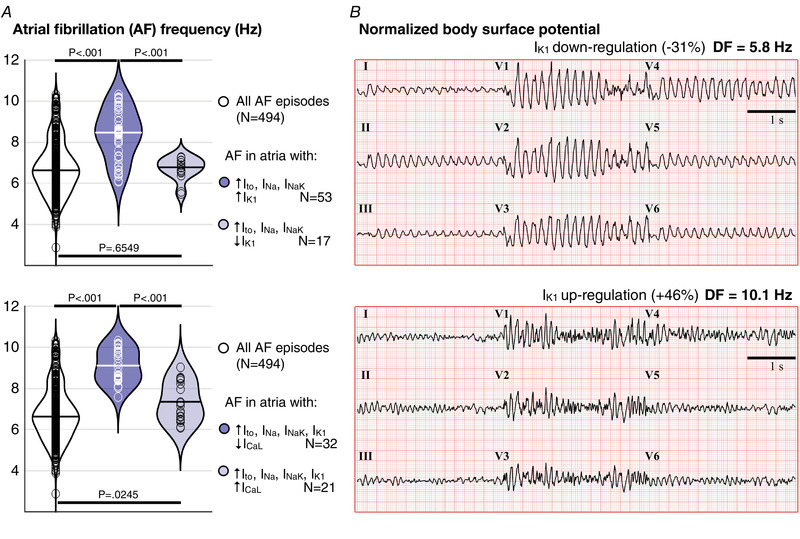
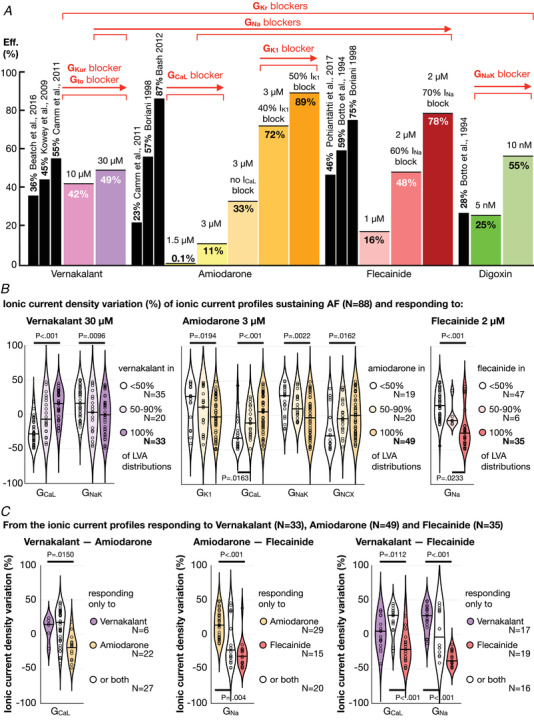
The best pharmacological treatment for each atrial fibrillation (AF) patient is unclear. We aim to exploit AF simulations in 800 virtual atria to identify key patient characteristics that guide the optimal selection of anti-arrhythmic drugs. The virtual cohort considered variability in electrophysiology and low voltage areas (LVA) and was developed and validated against experimental and clinical data from ionic currents to ECG. AF sustained in 494 (62%) atria, with large inward rectifier K+ current (IK1 ) and Na+ /K+ pump (INaK ) densities (IK1 0.11 ± 0.03 vs. 0.07 ± 0.03 S mF-1 ; INaK 0.68 ± 0.15 vs. 0.38 ± 26 S mF-1 ; sustained vs. un-sustained AF). In severely remodelled left atrium, with LVA extensions of more than 40% in the posterior wall, higher IK1 (median density 0.12 ± 0.02 S mF-1 ) was required for AF maintenance, and rotors localized in healthy right atrium. For lower LVA extensions, rotors could also anchor to LVA, in atria presenting short refractoriness (median L-type Ca2+ current, ICaL , density 0.08 ± 0.03 S mF-1 ). This atrial refractoriness, modulated by ICaL and fast Na+ current (INa ), determined pharmacological treatment success for both small and large LVA. Vernakalant was effective in atria presenting long refractoriness (median ICaL density 0.13 ± 0.05 S mF-1 ). For short refractoriness, atria with high INa (median density 8.92 ± 2.59 S mF-1 ) responded more favourably to amiodarone than flecainide, and the opposite was found in atria with low INa (median density 5.33 ± 1.41 S mF-1 ). In silico drug trials in 800 human atria identify inward currents as critical for optimal stratification of AF patient to pharmacological treatment and, together with the left atrial LVA extension, for accurately phenotyping AF dynamics. KEY POINTS: Atrial fibrillation (AF) maintenance is facilitated by small L-type Ca2+ current (ICaL ) and large inward rectifier K+ current (IK1 ) and Na+ /K+ pump. In severely remodelled left atrium, with low voltage areas (LVA) covering more than 40% of the posterior wall, sustained AF requires higher IK1 and rotors localize in healthy right atrium. For lower LVA extensions, rotors can also anchor to LVA, if the atria present short refractoriness (low ICaL ) Vernakalant is effective in atria presenting long refractoriness (high ICaL ). For short refractoriness, atria with fast Na+ current (INa ) up-regulation respond more favourably to amiodarone than flecainide, and the opposite is found in atria with low INa . The inward currents (ICaL and INa ) are critical for optimal stratification of AF patient to pharmacological treatment and, together with the left atrial LVA extension, for accurately phenotyping AF dynamics.

Keywords: atrial fibrillation; in silico drug trials; ionic currents; low voltage areas.


Conflict of interest statement

The authors declare that they have no competing interests.

Figures

Figure 1
Figure 1. Generation of the population of 800 virtual atria
A, M = 100 atrial cardiomyocyte (CM) models reflecting variability in ionic current densities are developed and scaled in different atrial regions. B, N = 8 bipolar voltage (Bi) maps of the left atrium are registered to a human‐based whole‐atria model. The resulting whole‐atria models are binarized into low volage areas (LVA, Bi < 0.5 mV) and non‐LVA. Abbreviations. rs/i‐PV, ls/i‐PV, right superior/inferior, left superior/inferior pulmonary veins; LAA, left atrial appendage. C, a final population of 800 virtual patient models is generated combining each cardiomyocyte model, scaled in different atrial regions, with each whole‐atria model with a specific LVA distribution. [Colour figure can be viewed at wileyonlinelibrary.com]
Figure 2
Figure 2. Ionic current substrate favouring atrial fibrillation (AF) for distinct low voltage areas (LVA)
A, snapshot of the atrial transmembrane voltage map during AF and location of the atria within the torso (left). Simulated and clinical ECG during AF and dominant frequency (DF) of lead V1 [right, adapted with permission from Lankveld et al. (2016)]. The clinical ECG was recorded with a sampling frequency of 250 Hz and postprocessing consisted of a zero‐phase band‐pass filter between 1 and 100 Hz, a 50 Hz notch filter and cancellation of ventricular signals: QRST‐waves. Further details are available in Lankveld et al. (2016). B, variation of G to, G K1, G Ks, G CaL and G NaK (with respect to baseline) yielding sustained AF (>7 s) for an increasing number of LVA distributions (left), and associated atrial action potential (AP, right). C, bipolar voltage (Bi) map and left atrium parcellation: Estimation of LVA in the left atrium posterior wall (regions 1–4). D, I K1 density variation leading to sustained AF for an increasing LVA extension in the left atrium (LVALA, bottom) and in the left atrial posterior wall (LVAPW, top). [Colour figure can be viewed at wileyonlinelibrary.com]
Figure 3
Figure 3. Effect of I K1 and I CaL on the ECG dominant frequency (DF)
A, comparison of the atrial fibrillation (AF) dominant frequency in atria with I to, I NaK and I Na up‐regulation with vs. without I K1 up‐regulation (top), and with I to, I NaK, I Na and I K1 up‐regulation with vs. without I CaL down‐regulation. B, simulated ECG recordings during AF in virtual atria with low and high I K1. [Colour figure can be viewed at wileyonlinelibrary.com]
Figure 4
Figure 4. Dominant frequency density maps for different low voltage areas (LVA) distributions
A, consecutive snapshots of the transmembrane voltage (V m) for a single AF episode. One rotor (top row) is located in the right atrium and one (bottom row) is anchored to a low voltage area of the left atrium (bipolar voltage, Bi < 0.5 mV). The discrete frequency (F, no units) map illustrates the core of the re‐entry as a low (L) frequency region and the surroundings as middle and high (H) frequency regions. B, high dominant frequency (DF) density maps for three LVA distributions in the left atrium (LVALA): two with low one with high LVA density. The blue arrows highlight high‐frequency regions adjacent to low density regions. Anatomical landmarks: RA‐LA, right and left atrium; RAA‐LAA, RA and LA appendage; SCV‐ICV, superior and inferior cava vein; rPV‐lPV, right and left pulmonary veins; rs‐ri‐ls‐liPV, right superior, right inferior, left superior, left inferior pulmonary vein. [Colour figure can be viewed at wileyonlinelibrary.com]
Figure 5
Figure 5. In silico trials over 494 AF episodes with 12 pharmacological treatments
A, comparison between the success rates (Efficacy, Eff.) obtained in silico (colour bars) and in human clinical trials (black bars). A threshold of 25% blockade at therapeutic plasma concentration has been considered to group drugs according to the ionic current channel they target. The arrows point towards greater ionic current density blockade. B, comparison of the ionic current density distribution of ionic current profiles responding and not responding to pharmacological treatment for a different number of LVA distributions. The three drugs considered are vernakalant 30 μm, amiodarone 3 μm without I CaL blockade and flecainide 2 μm with 60% I Na blockade. C, comparison of the ionic current densities of virtual patient models only responding to drug‐A against those only responding to drug‐B (where drug‐A and drug‐B are the three anti‐arrhythmic drugs shown in B). Only ionic current densities presenting significant differences are displayed in the comparisons illustrated in B and C. [Colour figure can be viewed at wileyonlinelibrary.com]

Comment in

Similar articles

Cited by

References

    1. Alcaraz, R. , Sandberg, F. , Sörnmo, L. , & Rieta, J. J. (2011). Classification of paroxysmal and persistent atrial fibrillation in ambulatory ECG recordings. IEEE Transactions on Biomedical Engineering, 58(5), 1441–1449. - PubMed
    1. Atienza, F. , Almendral, J. , Moreno, J. , Vaidyanathan, R. , Talkachou, A. , Kalifa, J. , Arenal, A. , Villacastín, J. P. , Torrecilla, E. G. , Sánchez, A. , Ploutz‐Snyder, R. , Jalife, J. , & Berenfeld, O. (2006). Activation of inward rectifier potassium channels accelerates atrial fibrillation in humans: Evidence for a reentrant mechanism. Circulation, 114(23), 2434–2442. - PubMed
    1. Azzolin, L. , Eichenlaub, M. , Nagel, C. , Nairn, D. , Sanchez, J. , Unger, L. , Dössel, O. , Jadidi, A. , & Loewe, A. (2022). Personalized ablation vs. conventional ablation strategies to terminate atrial fibrillation and prevent recurrence. EP Europace, 25(1), 211–222. - PMC - PubMed
    1. Bai, J. , Lo, A. , Gladding, P. A. , Stiles, M. K. , Fedorov, V. V. , & Zhao, J. (2020). In silico investigation of the mechanisms underlying atrial fibrillation due to impaired Pitx2. PLoS Computational Biology, 16(2), e1007678. - PMC - PubMed
    1. Bai, J. , Lu, Y. , & Zhang, H. (2020). In silico study of the effects of anti‐arrhythmic drug treatment on sinoatrial node function for patients with atrial fibrillation. Scientific Reports, 10(1), 1–15. - PMC - PubMed

Publication types