. 2024;22(9):1528-1539.
doi: 10.2174/1570159X21666230720121027.

Spatiomolecular Characterization of Dopamine D2 Receptors Cells in the Mouse External Globus Pallidus

Affiliations

Spatiomolecular Characterization of Dopamine D2 Receptors Cells in the Mouse External Globus Pallidus

Julie Espallergues et al. Curr Neuropharmacol. 2024.

Abstract

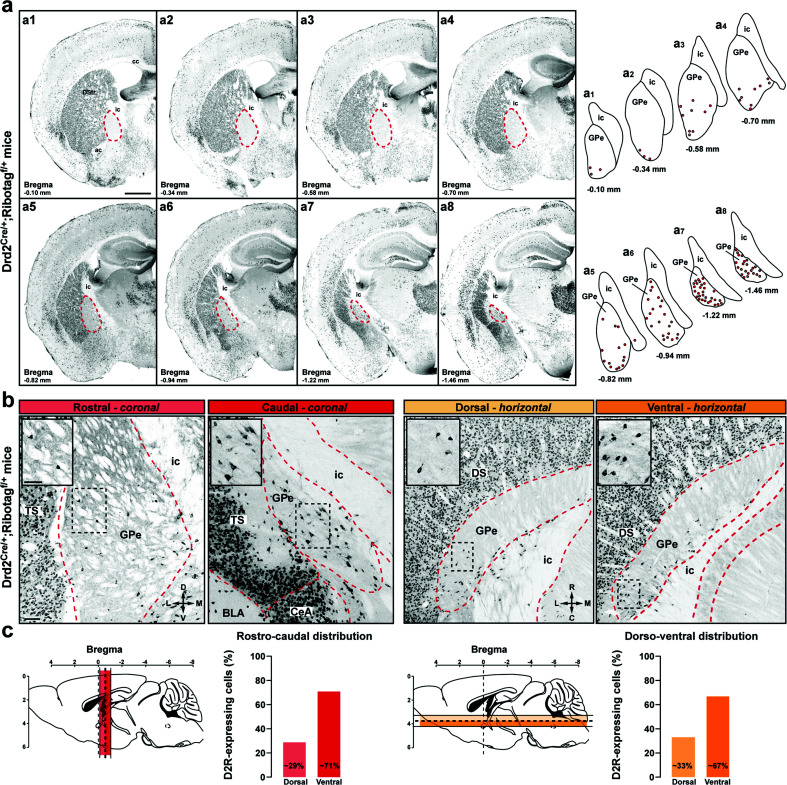
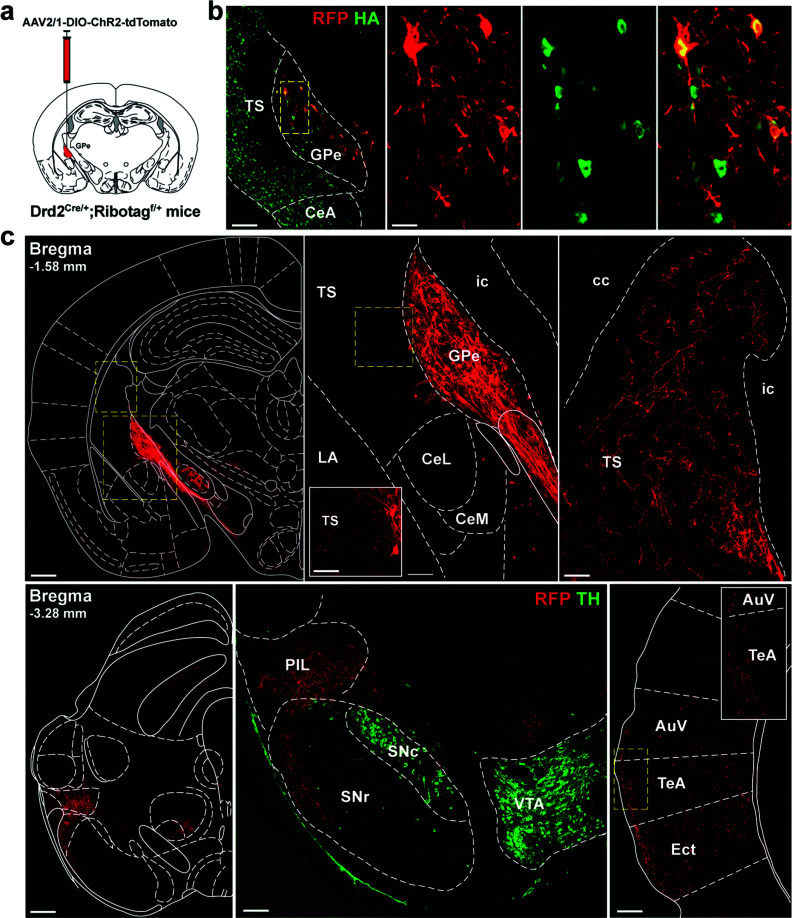
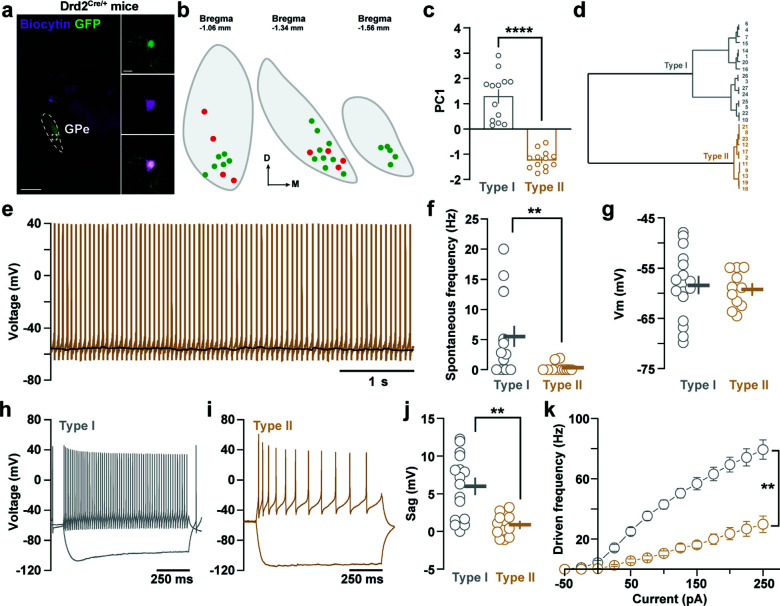
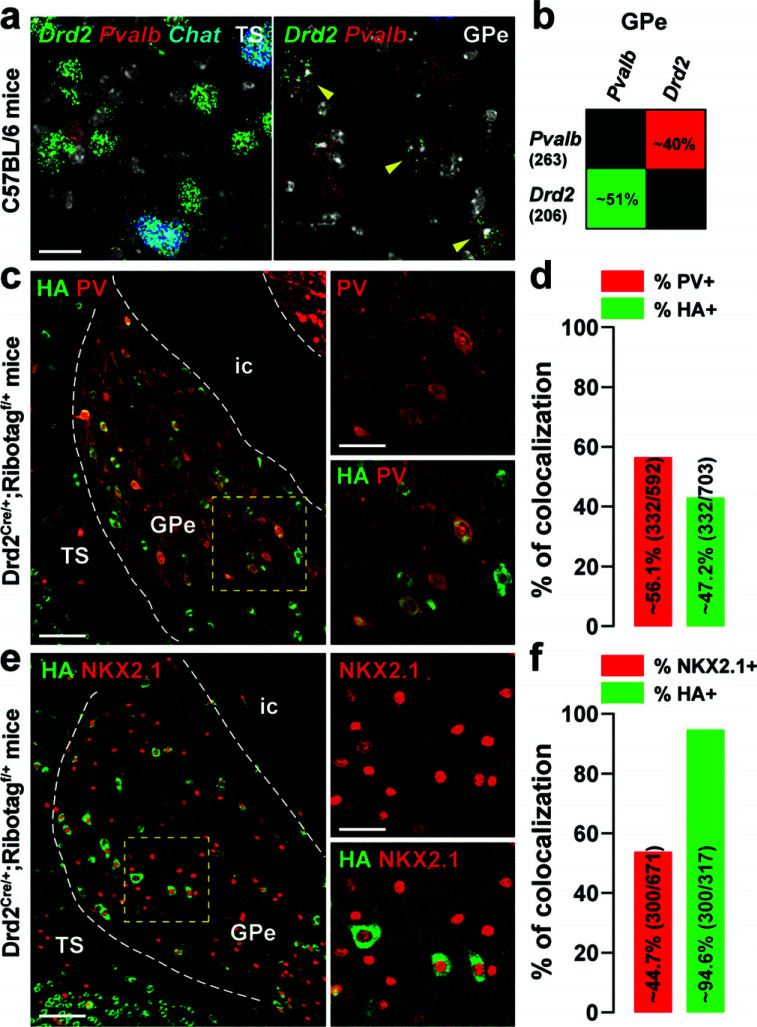
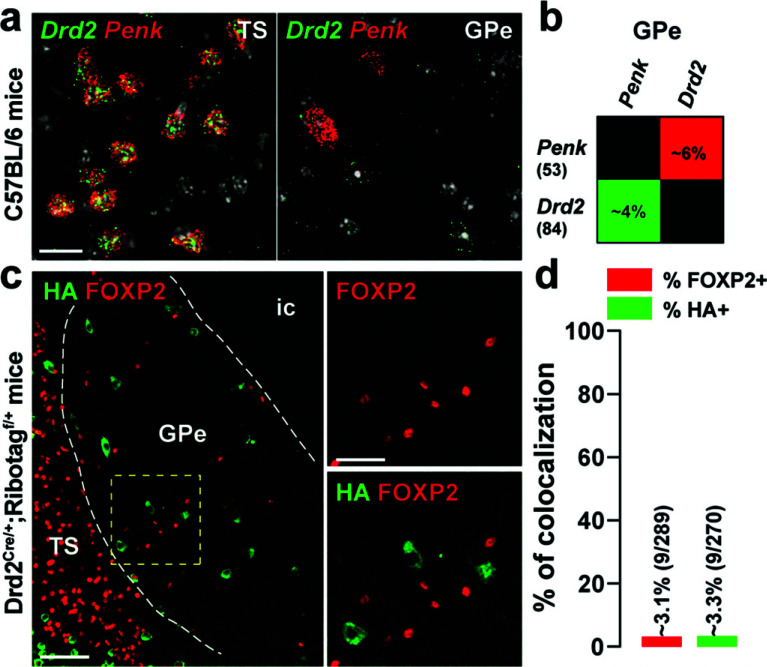
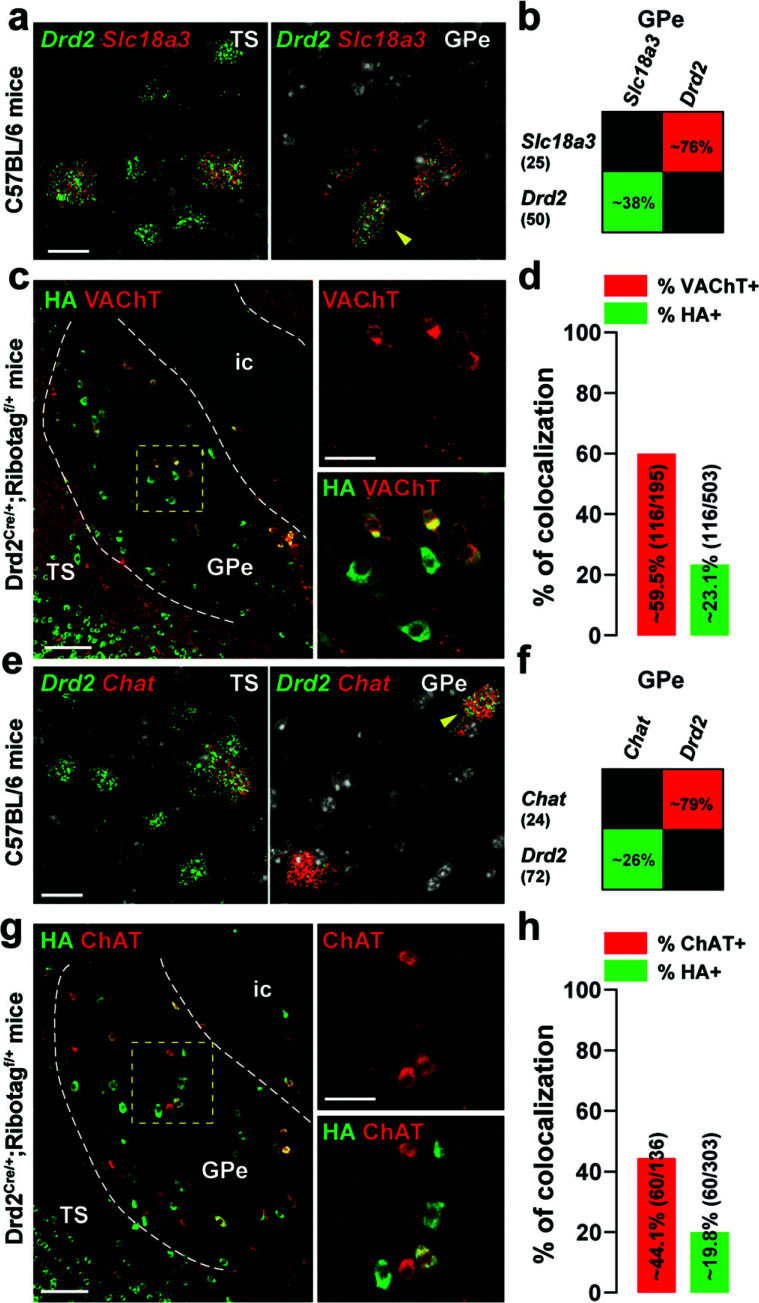
The external globus pallidus (GPe) is part of the basal ganglia circuit and plays a key role in controlling the actions. Although, many evidence indicate that dopamine through its activation of dopamine D2 receptors (D2Rs) modulates the GPe neuronal activity, the precise spatiomolecular characterization of cell populations expressing D2Rs in the mouse GPe is still lacking. By combining single molecule in situ hybridization, cell type-specific imaging analyses, and electrophysiology slice recordings, we found that GPe D2R cells are neurons preferentially localized in the caudal portion of GPe. These neurons comprising pallido-striatal, pallido-nigral, and pallido-cortical neurons segregate into two distinct populations displaying molecular and electrophysiological features of GPe GABAergic PV/NKX2.1 and cholinergic neurons respectively. By clarifying the spatial molecular identity of GPe D2R neurons in the mouse, this work provides the basis for future studies aiming at disentangling the action of dopamine within the GPe.

Keywords: D2Rs.; Dopamine; cholinergic neurons; globus pallidus; mouse; pallidostriatal.


Conflict of interest statement

The authors declare no conflict of interest, financial or otherwise.

Figures

Fig. (1)
Fig. (1)
Distribution of D2R cells in the GPe of Drd2Cre/+;Ribotagf/+ mice. (a) Coronal GPe sections from Drd2Cre/+;Ribotagf/+ mice (n = 4) stained with HA. Representative distribution of HA-positive neurons across 8 coronal sections spanning throughout the rostrocaudal axis of the GPe (each dot representing a single neuron). Scale bar: 500 µm. (b), Representative HA immunolabeled images showing the rostrocaudal (left) and dorsoventral (right) distributions of HA-positive neurons in the GPe. Scale bar: 100 µm. Inserts are high-magnification images of areas delineated by the black stippled rectangle. Scale bar: 50 μm. (c) Histograms showing the % HA-positive cells in the GPe throughout the rostrocaudal (left) and dorsoventral (right) axis. Note the spatial distribution of D2R neurons is biased displaying the highest density in the ventral-posterior GPe. Abbreviations: DS: dorsal striatum; TS: the tail of the striatum; GPe: external globus pallidus; CeA: central amygdala; BLA: basolateral amygdala; ic: internal capsule; ac: anterior commissure.
Fig. (2)
Fig. (2)
Identification of ventral-posterior GPe D2R neurons projecting areas. (a) Schematic representation of the site for the AAV2/1. CAGGS.flex.ChR2.tdTomato.SV40 injection into the caudal GPe of Drd2Cre/+;Ribotagf/+ mice. (b) Visualization of ChR2-expressing neurons in the GPe in Drd2Cre/+;Ribotagf/+ mice. Double immunofluorescence for mCherry (RFP) and HA (green). Scale bar: 70 µm. High magnification image of the area delineated by the yellow stippled rectangle. Scale bar: 20 µm. (c) Illustration of axon projection targets of ventral-posterior GPe D2R neurons. Note the clear identification of the pallido-striatal, pallido-nigral and pallido-cortical neurons. Immunofluorescence for tyrosine hydroxylase (TH, green) was used to identify SNc and VTA dopamine neurons. Abbreviations: TS: tail of the striatum; GPe: external globus pallidus; CeA: central amygdala; CeL: lateral part of the central amygdala; CeM: medial part of the central amygdala; BLA: basolateral amygdala; LA: lateral amygdala; PIL: posterior intralaminar nucleus; SNr: SN pars reticulata; SNc: SN pars compacta; VTA: ventral tegmental area; AuV: secondary auditory cortex, ventral area; TeA: temporal association cortex; Ect: ectorhinal association cortex; ic: internal capsule; cc: corpus callosum.
Fig. (3)
Fig. (3)
Electrophysiological signature of D2R-expressing neurons located in the ventral-posterior portion of the GPe. (a) Low magnification epifluorescent image of a coronal 300-µm thick section showing eYFP-expressing (green) and a biocytin-filled (magenta) GPe neurons. Insets on the left display the biocytin-filled D2R-positive GPe neuron at higher magnification. Scale bar: 10 μm. (b) Distribution on the rostro-caudal axis of the recorded cells. Green and red dots correspond to recordings performed in Drd2Cre/+; AAV-DIO-eYFP (n = 4 mice) and in Drd2Cre/+; Ai9f/+ (n = 6 mice) mice, respectively. (c) Graph showing the existence of two distinct neuronal populations by principal component analysis. (d) Dendrogram of two main D2R-expressing GPe neuron populations based on their electrophysiological properties. (e) Representative voltage trace of type II GPe neurons. (f-g) Graphs depicting spontaneous firing rate (f) and resting membrane potential (Vm) (g) of type I and type II GPe neurons. (h-i) Representative traces of voltage response to current step injection (-100 and +100 pA) for a type I (h) and a type II (i) GPe neuron. (j), Graph representing the sag value between type I and type II GPe neurons. (k) Frequency-current (F-i) curve showing the range of firing frequency of type I and type II GPe neurons.
Fig. (4)
Fig. (4)
Distribution of Drd2 among GPe PV and NKX2.1 neurons. (a) High magnification of confocal images of coronal brain section of the dorsal striatum (DS, left) and external globus pallidus (GPe, right) from C57BL/6 mouse (n = 3 mice) showing the distribution of Drd2 (green), Pvalb (red) and Chat (blue, only for the DS) expression detected with single-molecular fluorescent in situ hybridization. Yellow arrows identified Drd2/Pvalb positive neurons. Slides were counterstained with DAPI (white). Scale bar: 10 μm. (b) Quantification of the overlap between neurons co-expressing Drd2, and Pvalb in the ventral-posterior GPe. Values in parentheses indicate the number of neurons identified for each marker (n = 3 mice). Percentages of co-labelling are represented in a matrix with probes in columns among neurons labeled with probes in rows (~51% of Drd2-positive neurons were also Pvalb positive. (c, e) Double immunofluorescence for HA (green) and parvalbumin (red, PV) (c) and NKX2.1 (red) (e) in the caudal GPe of Drd2Cre/+;Ribotagf/+ mice (n = 6 mice). Scale bar: 50 μm. High-magnification images of areas delineated by the yellow stippled squares. Scale bar: 20 μm. (d, f) Histograms showing the co-expression as a percentage of HA-labeled neurons (green, HA+) and as a percentage of cells expressing PV (red, PV+) (d) and NKX2.1 (red, NKX2.1+) (f). The numbers of HA+, PV+, and NKX2.1+ cells counted are indicated in parentheses. Abbreviations: TS: the tail of the striatum; GPe: external globus pallidus; ic: internal capsule.
Fig. (5)
Fig. (5)
Distribution of Drd2 among GPe Penk and FOXP2 neurons. (a) High magnification of confocal images of coronal brain section of the dorsal striatum (DS) and external globus pallidus (GPe) from C57BL/6 mouse (n = 3 mice) showing the distribution of Drd2 (green) and Penk (red) expression detected with single-molecular fluorescent in situ hybridization. Slides were counterstained with DAPI (white). Scale bar: 10 μm. (b) Quantification of the overlap between neurons co-expressing Drd2 and Penk in the ventral-posterior GPe as described in Fig. (2b). (c) Double immunofluorescence (right panels) for HA (green) and FOXP2 (red) in the caudal GPe of Drd2Cre/+; Ribotagf/+ mice (n = 6 mice). Scale bar: 50 μm. High-magnification images of areas delineated by the yellow stippled squares. Scale bar: 20 μm. (d) Histograms showing the co-expression as a percentage of HA-labeled neurons (green, HA+) and as a percentage of cells expressing FOXP2 (red, FOXP2+). The numbers of HA+ and FOXP2+ cells counted are indicated in parentheses. TS: the tail of the striatum; GPe: external globus pallidus; ic: internal capsule.
Fig. (6)
Fig. (6)
Distribution of D2R among GPe cholinergic neurons. (a, e) High magnification of confocal images of coronal brain section of the dorsal striatum (DS) and external globus pallidus (GPe) from C57BL/6 mouse (n = 3 mice) showing the distribution of Drd2 (green), Slc18a3 (red) (a) and Chat (red) (e) expression detected with single-molecular fluorescent in situ hybridization. Yellow arrows identified Drd2/Slc18a3 and Drd2/Chat positive neurons in the DS and GPe. Slides were counterstained with DAPI (white). Scale bar: 10 μm. (b, f) Quantification of the overlap between neurons co-expressing Drd2 and Slc18a3 (b) or Chat (f) in the ventral-posterior GPe as described in Fig. (2b). (c, g) Double immunofluorescence (right panels) for HA (green), VAChT (red) (c) and ChAT (red) (g) in the caudal GPe of Drd2Cre/+;Ribotagf/+ mice (n = 5 mice). Scale bar: 50 μm. High-magnification images of areas delineated by the yellow stippled squares. Scale bar: 30 μm. (d, h) Histograms showing the co-expression as a percentage of HA-labeled neurons (green, HA+) and as a percentage of cells expressing VAChT (red, VAChT+) (d) or ChAT (red, ChAT+) (h). The numbers of HA+, VAChT+, and ChAT+ cells counted are indicated in parentheses. TS: the tail of the striatum; GPe: external globus pallidus; ic: internal capsule.

Similar articles

References

    1. Hegeman D.J., Hong E.S., Hernández V.M., Chan C.S. The external globus pallidus: Progress and perspectives. Eur. J. Neurosci. 2016;43(10):1239–1265. doi: 10.1111/ejn.13196. - DOI - PMC - PubMed
    1. Dong J., Hawes S., Wu J., Le W., Cai H. Connectivity and functionality of the globus pallidus externa under normal conditions and parkinson’s disease. Front. Neural Circuits. 2021;15:645287. doi: 10.3389/fncir.2021.645287. - DOI - PMC - PubMed
    1. Dodson P.D., Larvin J.T., Duffell J.M., Garas F.N., Doig N.M., Kessaris N., Duguid I.C., Bogacz R., Butt S.J.B., Magill P.J. Distinct developmental origins manifest in the specialized encoding of movement by adult neurons of the external globus pallidus. Neuron. 2015;86(2):501–513. doi: 10.1016/j.neuron.2015.03.007. - DOI - PMC - PubMed
    1. Abdi A., Mallet N., Mohamed F.Y., Sharott A., Dodson P.D., Nakamura K.C., Suri S., Avery S.V., Larvin J.T., Garas F.N., Garas S.N., Vinciati F., Morin S., Bezard E., Baufreton J., Magill P.J. Prototypic and arkypallidal neurons in the dopamine-intact external globus pallidus. J. Neurosci. 2015;35(17):6667–6688. doi: 10.1523/JNEUROSCI.4662-14.2015. - DOI - PMC - PubMed
    1. Aristieta A., Barresi M., Azizpour L.S., Barrière G., Courtand G., de la Crompe B., Guilhemsang L., Gauthier S., Fioramonti S., Baufreton J., Mallet N.P. A disynaptic circuit in the globus pallidus controls locomotion inhibition. Curr. Biol. 2021;31(4):707–721.e7. doi: 10.1016/j.cub.2020.11.019. - DOI - PubMed