Phenology and foraging bias contribute to sex-specific foraging patterns in the rare declining butterfly Argynnis idalia idalia
- PMID: 37475725
- PMCID: PMC10353922
- DOI: 10.1002/ece3.10287
Phenology and foraging bias contribute to sex-specific foraging patterns in the rare declining butterfly Argynnis idalia idalia
Abstract
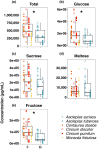
Variation in pollinator foraging behavior can influence pollination effectiveness, community diversity, and plant-pollinator network structure. Although effects of interspecific variation have been widely documented, studies of intraspecific variation in pollinator foraging are relatively rare. Sex-specific differences in resource use are a strong potential source of intraspecific variation, especially in species where the phenology of males and females differ. Differences may arise from encountering different flowering communities, sex-specific traits, nutritional requirements, or a combination of these factors. We evaluated sex-specific foraging patterns in the eastern regal fritillary butterfly (Argynnis idalia idalia), leveraging a 21-year floral visitation dataset. Because A. i. idalia is protandrous, we determined whether foraging differences were due to divergent phenology by comparing visitation patterns between the entire season with restricted periods of male-female overlap. We quantified nectar carbohydrate and amino acid contents of the most visited plant species and compared those visited more frequently by males versus females. We demonstrate significant differences in visitation patterns between male and female A. i. idalia over two decades. Females visit a greater diversity of species, while dissimilarity in foraging patterns between sexes is persistent and comparable to differences between species. While differences are diminished or absent in some years during periods of male-female overlap, remaining signatures of foraging dissimilarity during implicate mechanisms other than phenology. Nectar of plants visited more by females had greater concentrations of total carbohydrates, glucose, and fructose and individual amino acids than male-associated plants. Further work can test whether nutritional differences are a cause of visitation patterns or consequence, reflecting seasonal shifts in the nutritional landscape encountered by male and female A. i. idalia. We highlight the importance of considering sex-specific foraging patterns when studying interaction networks, and in making conservation management decisions for this at-risk butterfly and other species exhibiting strong intraspecific variation.
Keywords: Speyeria idalia idalia; flower visitation; intraspecific variation; long‐term ecological data; nectar chemistry; plant–pollinator interactions; sex‐specific foraging.
© 2023 The Authors. Ecology and Evolution published by John Wiley & Sons Ltd.
Conflict of interest statement
The authors declare no conflicts of interest.
Figures


References
-
- Alarcón, R. , Riffell, J. A. , Davidowitz, G. , Hildebrand, J. G. , & Bronstein, J. L. (2010). Sex‐dependent variation in the floral preferences of the hawkmoth Manduca sexta . Animal Behavior, 80, 289–296.
-
- Alarcón, R. , Waser, N. M. , & Ollerton, J. (2008). Year‐to‐year variation in the topology of a plant–pollinator interaction network. Oikos, 117(12), 1796–1807.
-
- Alm, J. , Ohnmeiss, T. E. , Lanza, J. , Vriesenga, L. , Alm, J. , Ohnmeiss, T. E. , Lanza, J. , & Vriesenga, L. (1990). Preference of cabbage white butterflies and honey bees for nectar that contains amino acids. Oecologia, 84, 53–57. - PubMed
-
- Alseekh, S. , Aharoni, A. , Brotman, Y. , Contrepois, K. , D'Auria, J. , Ewald, J. , Ewald, J. C. , Fraser, P. D. , Giavalisco, P. , Hall, R. D. , De Souza, L. P. , Saito, K. , Sauer, U. , Schroeder, F. C. , Schuster, S. , Siuzdak, G. , Skirycz, A. , Sumner, L. W. , Snyder, M. P. , … Fernie, A. R. (2021). Mass spectrometry‐based metabolomics: A guide for annotation, quantification and best reporting practices. Nature Methods, 18, 747–756. - PMC - PubMed
-
- Bates, D. , Mächler, M. , Bolker, B. , & Walker, S. (2015). Fitting linear mixed‐effects models using {lme4}. Journal of Statistical Software, 67, 1–48.
LinkOut - more resources
Full Text Sources

