. 2023 May 23;7(4):227-239.
doi: 10.1093/evlett/qrad020. eCollection 2023 Aug.

Evolutionary barriers to horizontal gene transfer in macrophage-associated Salmonella

Affiliations

Evolutionary barriers to horizontal gene transfer in macrophage-associated Salmonella

Rama P Bhatia et al. Evol Lett. .

Abstract

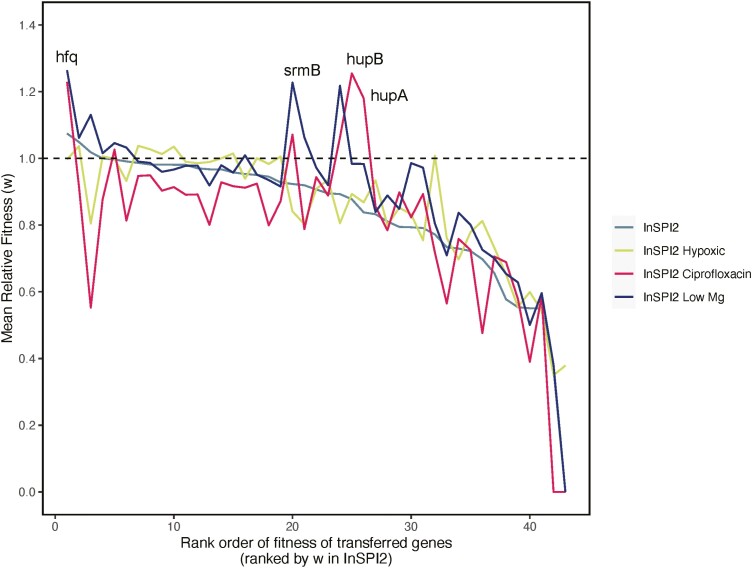
Horizontal gene transfer (HGT) is a powerful evolutionary force facilitating bacterial adaptation and emergence of novel phenotypes. Several factors, including environmental ones, are predicted to restrict HGT, but we lack systematic and experimental data supporting these predictions. Here, we address this gap by measuring the relative fitness of 44 genes horizontally transferred from Escherichia coli to Salmonella enterica in infection-relevant environments. We estimated the distribution of fitness effects in each environment and identified that dosage-dependent effects across different environments are a significant barrier to HGT. The majority of genes were found to be deleterious. We also found longer genes had stronger negative fitness consequences than shorter ones, showing that gene length was negatively associated with HGT. Furthermore, fitness effects of transferred genes were found to be environmentally dependent. In summary, a substantial fraction of transferred genes had a significant fitness cost on the recipient, with both gene characteristics and the environment acting as evolutionary barriers to HGT.

Keywords: adaptation; fitness; gene expression; microbes.


Conflict of interest statement

The authors declare no conflict of interest.

Figures

Figure 1.
Figure 1.
Distribution of fitness effects of transferred Escherichia coli orthologs expressed in Salmonella Typhimurium 4/74. The figure shows the distribution of fitness effects obtained from pooled growth assays in each infection-relevant environment. On the x-axis, transferred genes are ordered by their relative fitness values in the respective environments. Error bars represent SD of the mean for four replicate measurements for each gene. Embedded plots are histogram and density representations for the same data. Black dashed line shows a fitness of 1.
Figure 2.
Figure 2.
Grouping of genes based on fitness effects. Breakdown of the transferred orthologs based on results from one-sample t-test in each growth environment. Undetectable genes: mean fitness of gene = 0, padj < .05 with µ0 < 1; neutral genes: padj > .05 with µ0 > 1 and µ0 < 1; mildly deleterious genes: 1 > mean fitness of gene > 0.8, padj < .05 with µ0 < 1; highly deleterious genes: mean fitness of gene < 0.8, padj < .05 with µ0 < 1; beneficial genes: padj < .05, with µ0 > 1.
Figure 3.
Figure 3.
Fitness effects by functional categories. Boxplot with jitter points showing the fitness effects of transferred genes (four replicate measurements) in four growth environments, with genes divided into two functional categories. Black dashed line shows a fitness of 1.
Figure 4.
Figure 4.
Relationship between relative fitness and number of interactions. Relative fitness of transferred Escherichia coli orthologs in four growth environments plotted against the number of protein–protein interactions (A), regulatory interactions (B), and metabolic interactions (C) in Salmonella Typhimurium 4/74. The black line is the regression between the two variables. Gray dotted line shows a fitness of 1. FDR-corrected p-values and R2 values from the linear regression analysis are shown on the plot.
Figure 5.
Figure 5.
Relationship between relative fitness and gene length. Relative fitness of transferred Escherichia coli orthologs in Salmonella Typhimurium 4/74 plotted against the gene length in four growth environments. The black line is the regression between the two variables. Gray dotted line shows a fitness of 1. FDR-corrected p-values and R2 values are shown on the plot.
Figure 6.
Figure 6.
Relative fitness of transferred genes in four environments. The figure shows the variation in fitness effects of individual genes between environments, few examples have been labeled. Genes are ranked according to the relative fitness measurements in the control environment (InSPI2) only. Black dashed line shows a fitness of 1.
Figure 7.
Figure 7.
Dosage-dependent genes. The figure shows Escherichia coli orthologs (on y-axis) that exhibit a dosage effect across different environments (on x-axis) when expressed in Salmonella Typhimurium 4/74. Gene names and functions are mentioned on the right.

References

    1. Acar Kirit, H., Bollback, J. P., & Lagator, M. (2022). The role of the environment in horizontal gene transfer. Molecular Biology and Evolution, 39. - PMC - PubMed
    1. Acar Kirit, H., Lagator, M., & Bollback, J. P. (2020). Experimental determination of evolutionary barriers to horizontal gene transfer. BMC Microbiology, 20(1), 326. 10.1186/s12866-020-01983-5 - DOI - PMC - PubMed
    1. Agren, J. A. (2016). Selfish genetic elements and the gene’s-eye view of evolution. Current Zoology, 62(6), 659–665. 10.1093/cz/zow102 - DOI - PMC - PubMed
    1. Alcock, B. P., Raphenya, A. R., Lau, T. T. Y., Tsang, K. K., Bouchard, M., Edalatmand, A., Huynh, W., Nguyen, A.-L. V, Cheng, A. A., Liu, S., Min, S. Y., Miroshnichenko, A., Tran, H.-K., Werfalli, R. E., Nasir, J. A., Oloni, M., Speicher, D. J., Florescu, A., Singh, B., … McArthur, A. G. (2020). CARD 2020: Antibiotic resistome surveillance with the comprehensive antibiotic resistance database. Nucleic Acids Research, 48(D1), D517–D525. 10.1093/nar/gkz935 - DOI - PMC - PubMed
    1. Andrade, J. M., & Gómez-Carracedo, M. P. (2013). Notes on the use of Mandel’s test to check for nonlinearity in laboratory calibrations. Analytical Methods, 5(5), 1145–1149. 10.1039/c2ay26400e - DOI