. 2023 Jun 7;7(4):191-202.
doi: 10.1093/evlett/qrad025. eCollection 2023 Aug.

The coevolutionary dynamics of cryptic female choice

Affiliations

The coevolutionary dynamics of cryptic female choice

Matthew C Kustra et al. Evol Lett. .

Abstract

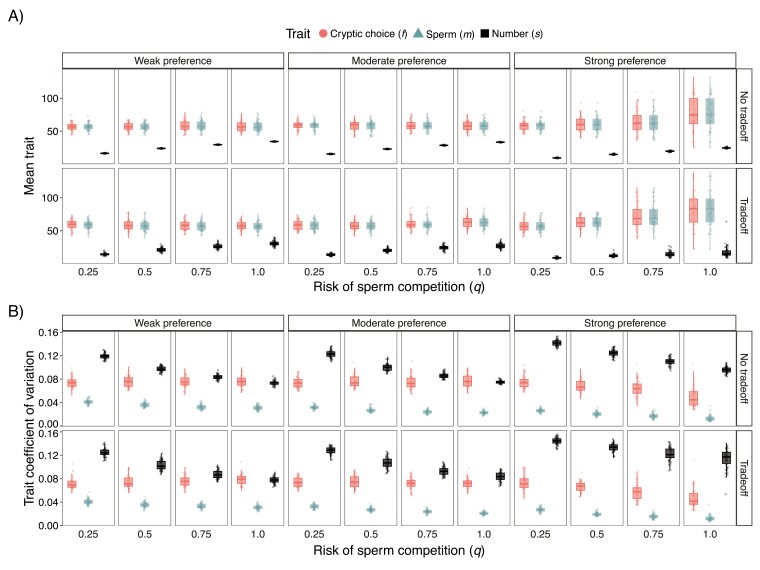
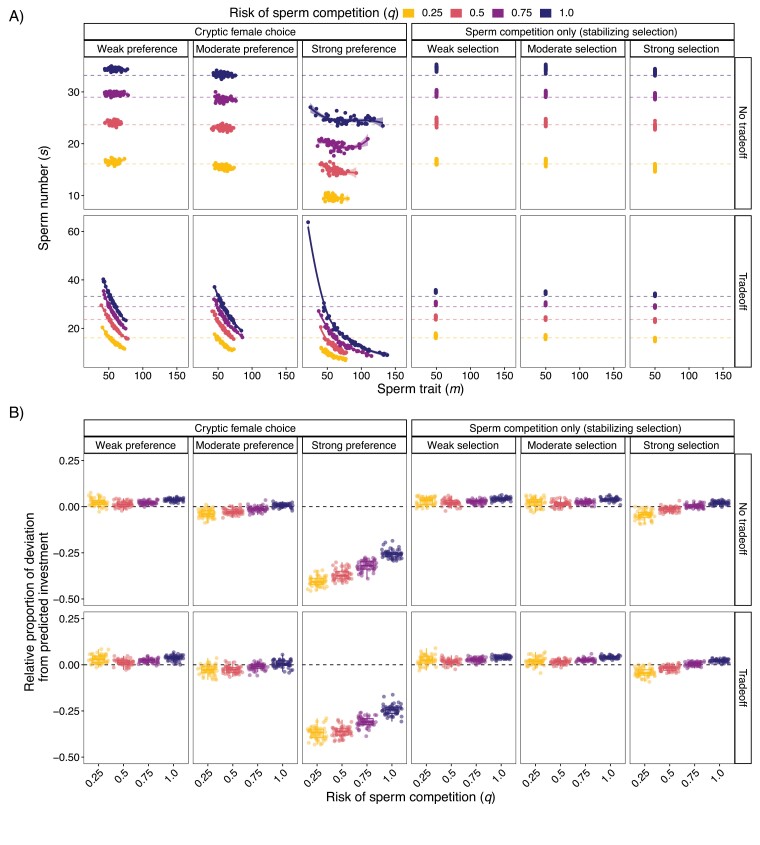
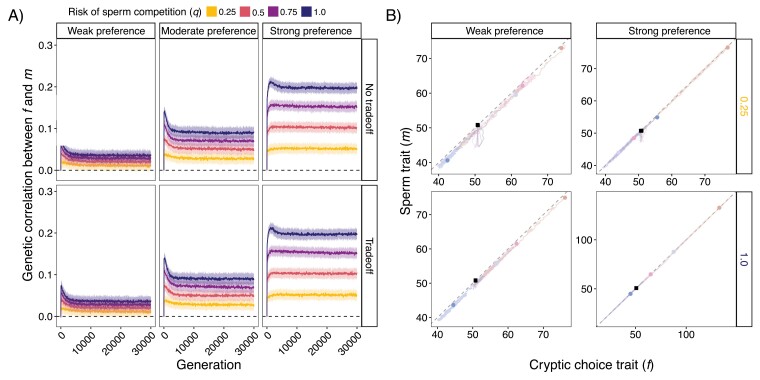
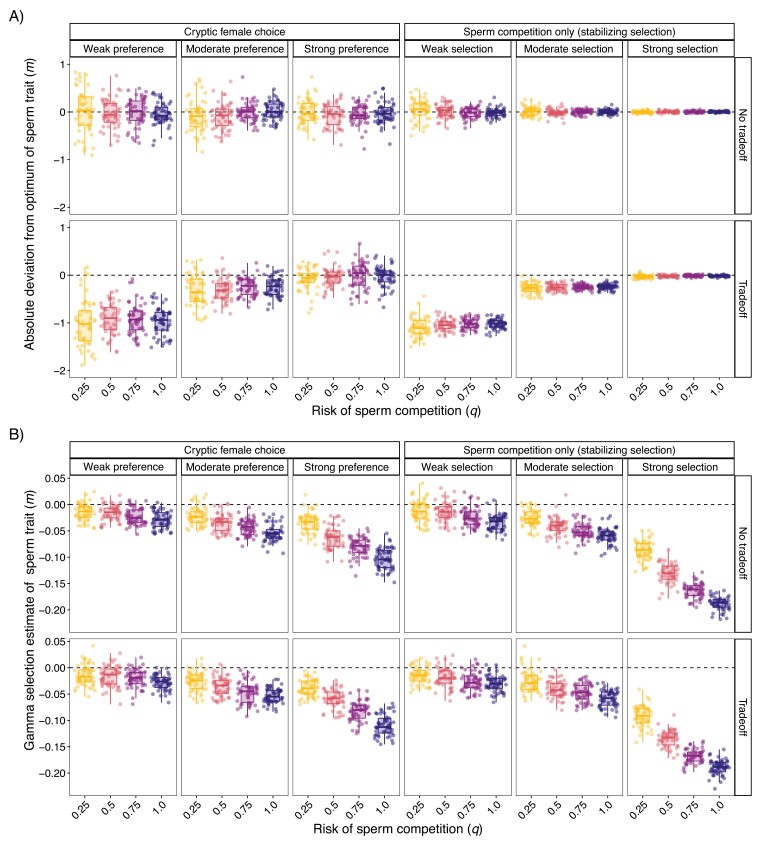
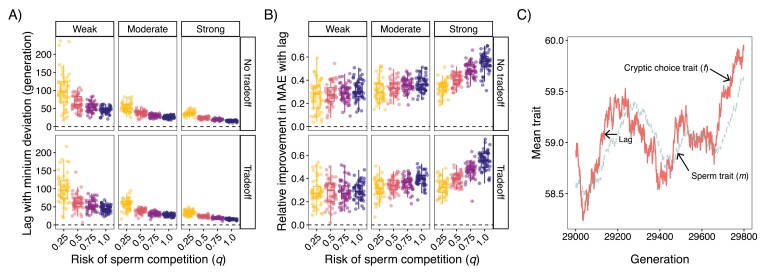
In contrast to sexual selection on traits that affect interactions between the sexes before mating, little theoretical research has focused on the coevolution of postmating traits via cryptic female choice (when females bias fertilization toward specific males). We used simulation models to ask (a) whether and, if so, how nondirectional cryptic female choice (female-by-male interactions in fertilization success) causes deviations from models that focus exclusively on male-mediated postmating processes, and (b) how the risk of sperm competition, the strength of cryptic female choice, and tradeoffs between sperm number and sperm traits interact to influence the coevolutionary dynamics between cryptic female choice and sperm traits. We found that incorporating cryptic female choice can result in males investing much less in their ejaculates than predicted by models with sperm competition only. We also found that cryptic female choice resulted in the evolution of genetic correlations between cryptic female choice and sperm traits, even when the strength of cryptic female choice was weak, and the risk of sperm competition was low. This suggests that cryptic female choice may be important even in systems with low multiple mating. These genetic correlations increased with the risk of sperm competition and as the strength of cryptic female choice increased. When the strength of cryptic female choice and risk of sperm competition was high, extreme codivergence of sperm traits and cryptic female choice preference occurred even when the sperm trait traded off with sperm number. We also found that male traits lagged behind the evolution of female traits; this lag decreased with increasing strength of cryptic female choice and risk of sperm competition. Overall, our results suggest that cryptic female choice deserves more attention theoretically and may be driving trait evolution in ways just beginning to be explored.

Keywords: Fisherian Runaway Selection; individual-based model; postcopulatory sexual selection; reproductive isolation; sperm competition.


Figures

Figure 1.
Figure 1.
Strong selection and high risk of sperm competition results in higher trait divergence across populations but lower trait variation within populations. (A) Box plots and jittered points of population average of cryptic choice (f; left circles), sperm trait (m; center triangles), and sperm number (s; right squares) at generation 30,000. (B) Box plots and jittered points of within-population coefficient of variation of all traits at generation 30,000. Similar graphs at other parameter combinations can be made on the SI web app.
Figure 2.
Figure 2.
Cryptic female choice can result in less ejaculate investment than models with sperm competition only. (A) Scatter plots of average population sperm trait (m) and sperm number (s) at generation 30,000 with dashed lines indicating predicted sperm number from the game theory model (xe). Line shown is the best fit local polynomial regression (“LOESS” function) between m and s. Similar graphs at other parameter combinations can be made on the SI web app. (B) Box plots and jittered points of the population average relative deviation of simulations at generation 30,000 compared to the analytical model’s predicted investment (simulation   investment-predicted   investment   predicted   investment). Values at the black dashed line indicate that a simulation exactly matched the game theory model prediction; values above the line indicate more investment than predicted; values below the line represent lower investment than predicted. Simulations of sperm competition only are from simulations with stabilizing selection, fair raffle results are shown in Supplementary Figure S5.
Figure 3.
Figure 3.
Cryptic female choice results in coevolution even with weak selection and low risks of sperm competition. (A) Genetic correlations between cryptic female choice trait (f) and sperm trait (m) evolve within the first 200 generations and are maintained due to linkage disequilibrium. Black dashed line is at zero representing no correlation. Lines represent mean and bands represent standard deviation of 50 populations (separate runs) at each parameter combination. (B) When looking across populations, average f and m are highly correlated. Shown are the highest, lowest, and two random population trajectories of average f and m when there was a tradeoff and for different preference strengths (weak, strong) and risks of sperm competition (1.0, 0.25). Black dashed line represents a perfect correlation; black square represents starting values; circle dots represent the population ending point after 30,000 generations with different colors representing different populations. Note that the axes differ for the different subpanels. Only every 50 generations are shown due to computer memory constraints when plotting. Similar graphs at other parameter combinations can be made on the SI web app.
Figure 4.
Figure 4.
Cryptic female choice results in more deviation from sperm trait optimum than sperm competition only. (A) Box plots and jittered points of simulation deviation from “optimal” sperm trait value (m; the value where fertilization is maximized when only considering m) at generation 30,000. For cryptic female choice, deviation was calculated by subtracting mean m from mean cryptic female choice trait (f). For sperm competition only, deviation was calculated by subtracting mean m from 50, the optimum set during those runs. Black dashed line indicates zero or no deviation from the optimum. (B) Box plots and jittered points of gamma quadratic selection estimates of m after 30,000 generations (Lande & Arnold, 1983). Zero means no quadratic selection (black dashed line), negative values represent stabilizing selection, positive values represent disruptive selection. Coefficient estimates remained stable after 10,000 generations. Similar graphs at other parameter combinations can be made on the SI web.
Figure 5.
Figure 5.
Evolution of sperm trait lags cryptic female choice trait and the length of this lag decreases with strength of cryptic female choice and risk of sperm competition. (A) Box plots and jittered points of generational lag that resulted in minimum mean absolute error (MAE) for different replicates during the last 2,000 generations of the simulation. Dashed horizontal line is at zero indicating no lag best fits the data. (B) Box plots and jittered points of the relative improvement in MAE of incorporating the best fit generational lag versus no lag. Dashed horizontal line is at zero indicating lag did not improve fit. (C) Line plot of an example population showing how the evolution of sperm trait (m; dashed) lags the evolution of cryptic choice trait (f; solid). The optimal lag in this example population was 49 generations and is when there was no tradeoff, risk of sperm competition was 0.25, and selection was strong.

Similar articles

Cited by

References

    1. Ah-King, M. (2022). The history of sexual selection research provides insights as to why females are still understudied. Nature Communications, 13(1), 6976. 10.1038/s41467-022-34770-z - DOI - PMC - PubMed
    1. Ball, M. A., & Parker, G. A. (2003). Sperm competition games: Sperm selection by females. Journal of Theoretical Biology, 224(1), 27–42. 10.1016/s0022-5193(03)00118-8 - DOI - PubMed
    1. Beirão, J., Purchase, C. F., Wringe, B. F., & Fleming, I. A. (2015). Inter-population ovarian fluid variation differentially modulates sperm motility in Atlantic cod Gadus morhua. Journal of Fish Biology, 87(1), 54–68. 10.1111/jfb.12685 - DOI - PubMed
    1. Bezanson, J., Edelman, A., Karpinski, S., & Shah, V. B. (2017). Julia: A fresh approach to numerical computing. SIAM Review, 59(1), 65–98. 10.1137/141000671 - DOI
    1. Birkhead, T. R., & Pizzari, T. (2002). Postcopulatory sexual selection. Nature Reviews Genetics, 3(4), 262–273. 10.1038/nrg774 - DOI - PubMed