

Socioeconomic determinants of stay-at-home policies during the first COVID-19 wave
- PMID: 37475770
- PMCID: PMC10354257
- DOI: 10.3389/fpubh.2023.1193100
Socioeconomic determinants of stay-at-home policies during the first COVID-19 wave
Abstract
Introduction: The COVID-19 pandemic has had a significant impact on public health and social systems worldwide. This study aims to evaluate the efficacy of various policies and restrictions implemented by different countries to control the spread of the virus.
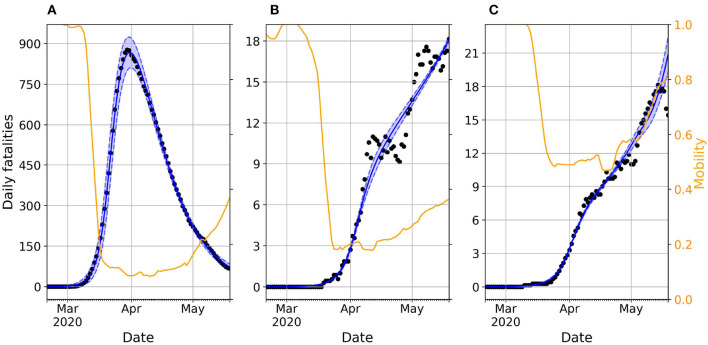
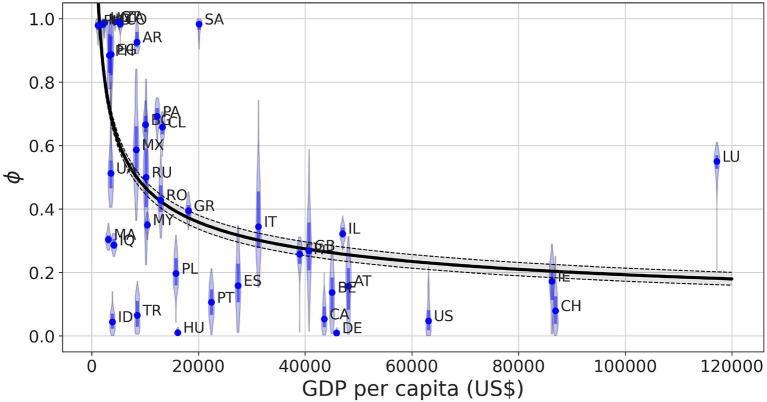
Methods: To achieve this objective, a compartmental model is used to quantify the "social permeability" of a population, which reflects the inability of individuals to remain in confinement and continue social mixing allowing the spread of the virus. The model is calibrated to fit and recreate the dynamics of the epidemic spreading of 42 countries, mainly taking into account reported deaths and mobility across the populations.
Results: The results indicate that low-income countries have a harder time slowing the advance of the pandemic, even if the virus did not initially propagate as fast as in wealthier countries, showing the disparities between countries in their ability to mitigate the spread of the disease and its impact on vulnerable populations.
Discussion: This research contributes to a better understanding of the socioeconomic and environmental factors that affect the spread of the virus and the need for equitable policy measures to address the disparities in the global response to the pandemic.
Keywords: Bayesian inference; COVID-19; compartmental models; epidemic modeling; non-pharmaceutical containment policies.
Copyright © 2023 Valgañón, Lería, Soriano-Paños and Gómez-Gardeñes.
Conflict of interest statement
The authors declare that the research was conducted in the absence of any commercial or financial relationships that could be construed as a potential conflict of interest.
Figures


Similar articles
-
Quantifying the heterogeneous impact of lockdown policies on different socioeconomic classes during the first COVID-19 wave in Colombia.Sci Rep. 2023 Sep 30;13(1):16481. doi: 10.1038/s41598-023-43685-8. Sci Rep. 2023. PMID: 37777581 Free PMC article.
-
Estimating the COVID-19 Spread Through Real-time Population Mobility Patterns: Surveillance in Low- and Middle-Income Countries.J Med Internet Res. 2021 Jun 14;23(6):e22999. doi: 10.2196/22999. J Med Internet Res. 2021. PMID: 33950850 Free PMC article.
-
Social distancing policies in 22 African countries during the COVID-19 pandemic: a desk review.Pan Afr Med J. 2020 Dec 14;37(Suppl 1):46. doi: 10.11604/pamj.supp.2020.37.46.27026. eCollection 2020. Pan Afr Med J. 2020. PMID: 33552374 Free PMC article. Review.
-
The need for holistic, longitudinal and comparable, real-time assessment of the emotional, behavioral and societal impact of the COVID-19 pandemic across nations.Psychiatriki. 2021 Apr 19;32(1):15-18. doi: 10.22365/jpsych.2021.010. Epub 2021 Mar 8. Psychiatriki. 2021. PMID: 33759804 English, Greek, Modern.
-
Lifting non-pharmaceutical interventions following the COVID-19 pandemic - the quiet before the storm?Expert Rev Vaccines. 2022 Nov;21(11):1541-1553. doi: 10.1080/14760584.2022.2117693. Epub 2022 Sep 5. Expert Rev Vaccines. 2022. PMID: 36039786 Review.
Cited by
-
Quantifying the heterogeneous impact of lockdown policies on different socioeconomic classes during the first COVID-19 wave in Colombia.Sci Rep. 2023 Sep 30;13(1):16481. doi: 10.1038/s41598-023-43685-8. Sci Rep. 2023. PMID: 37777581 Free PMC article.
References
-
- Kapitsinis N. The underlying factors of the COVID-19 spatially uneven spread. Initial evidence from regions in nine EU countries. Region Sci Policy Pract. (2020) 12:1027–45. 10.1111/rsp3.12340 - DOI
Publication types
MeSH terms
LinkOut - more resources
Full Text Sources
Medical