. 2023 Jul 5:14:1190844.
doi: 10.3389/fimmu.2023.1190844. eCollection 2023.

T cell receptor β repertoires in patients with COVID-19 reveal disease severity signatures

Affiliations

T cell receptor β repertoires in patients with COVID-19 reveal disease severity signatures

Jing Xu et al. Front Immunol. .

Abstract

Background: The immune responses to severe acute respiratory syndrome coronavirus 2 (SARS-CoV-2) are crucial in maintaining a delicate balance between protective effects and harmful pathological reactions that drive the progression of coronavirus disease 2019 (COVID-19). T cells play a significant role in adaptive antiviral immune responses, making it valuable to investigate the heterogeneity and diversity of SARS-CoV-2-specific T cell responses in COVID-19 patients with varying disease severity.

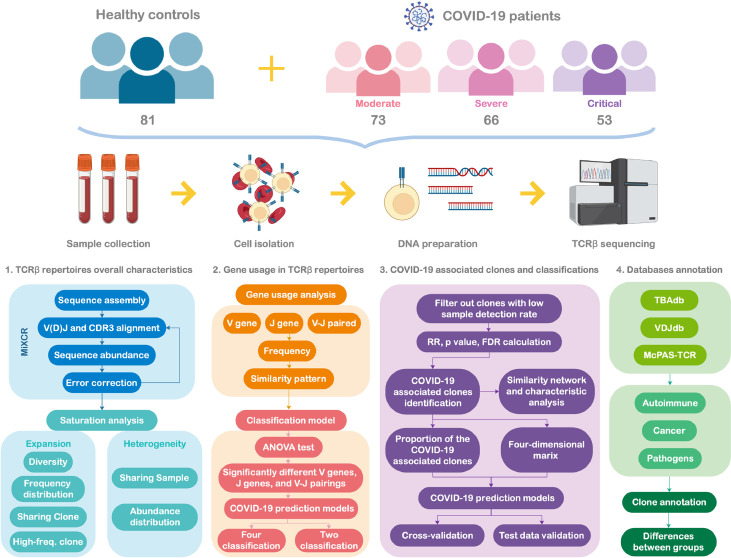
Methods: In this study, we employed high-throughput T cell receptor (TCR) β repertoire sequencing to analyze TCR profiles in the peripheral blood of 192 patients with COVID-19, including those with moderate, severe, or critical symptoms, and compared them with 81 healthy controls. We specifically focused on SARS-CoV-2-associated TCR clonotypes.

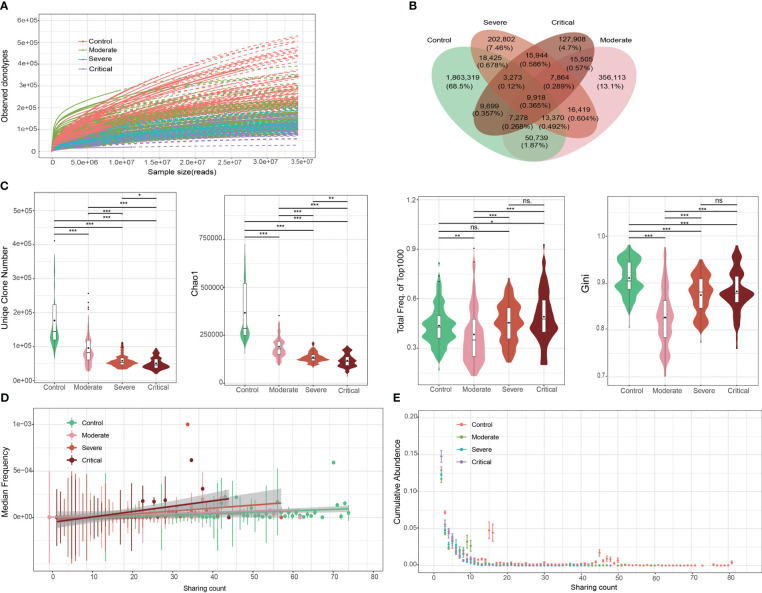
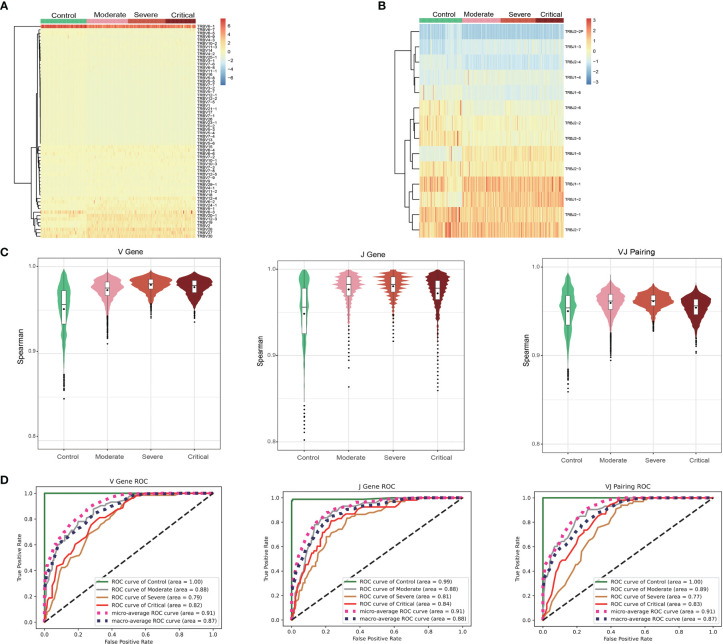
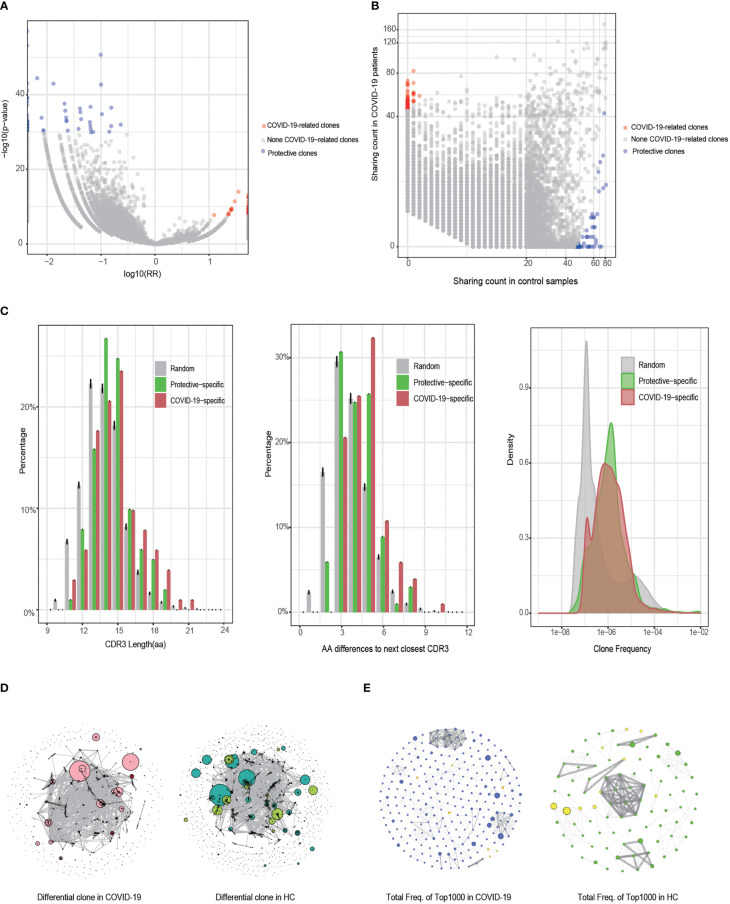
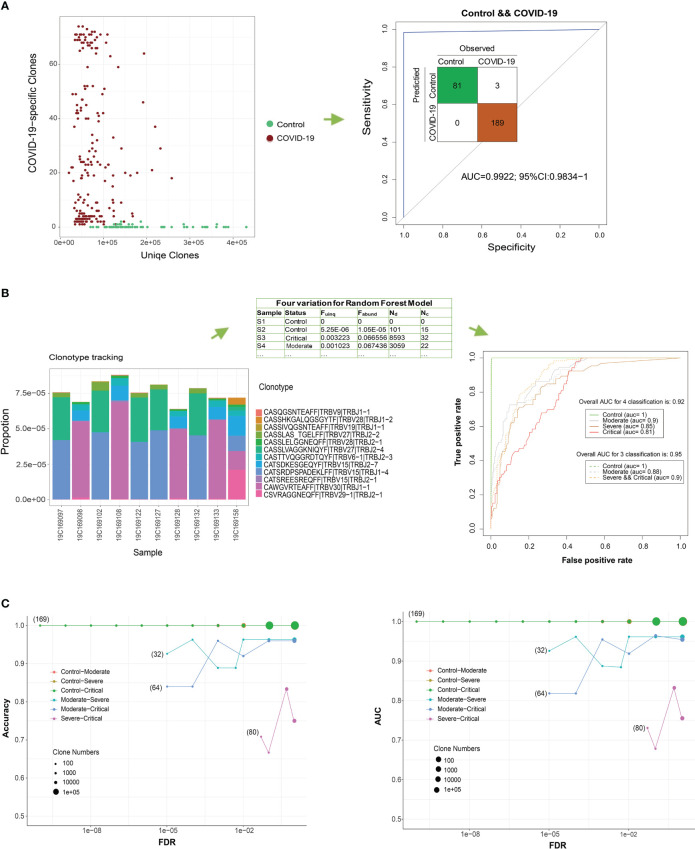
Results: We observed a decrease in the diversity of TCR clonotypes in COVID-19 patients compared to healthy controls. However, the overall abundance of dominant clones increased with disease severity. Additionally, we identified significant differences in the genomic rearrangement of variable (V), joining (J), and VJ pairings between the patient groups. Furthermore, the SARS-CoV-2-associated TCRs we identified enabled accurate differentiation between COVID-19 patients and healthy controls (AUC > 0.98) and distinguished those with moderate symptoms from those with more severe forms of the disease (AUC > 0.8). These findings suggest that TCR repertoires can serve as informative biomarkers for monitoring COVID-19 progression.

Conclusions: Our study provides valuable insights into TCR repertoire signatures that can be utilized to assess host immunity to COVID-19. These findings have important implications for the use of TCR β repertoires in monitoring disease development and indicating disease severity.

Keywords: T cell receptor β repertoire; T cells; coronavirus disease 2019; immunology; machine learning.


Conflict of interest statement

The authors declare that the research was conducted in the absence of any commercial or financial relationships that could be construed as a potential conflict of interest.

Figures

Figure 1
Figure 1
Study flowchart.
Figure 2
Figure 2
Overall characteristics of the T cell receptor (TCR) β repertoires in patients with COVID-19 and healthy controls (HCs). (A) Saturation analysis of each group. Sequencing data were randomly selected to determine the number of clonotypes detected and extrapolated to the size of the largest samples. Solid and dashed lines represent the interpolated and extrapolated regions of the rarefaction curves, respectively, and points indicate the exact sample size and diversity. (B) Overlap between each group of public clones. (C) Obvious clonal expansion from the aspects of TCR β repertoire diversity in COVID-19 development. Horizontal line is the median, and dot is the average value in the boxplot. (D) Trend of changes in the average abundance of clones under different detection sample numbers for each group. (E) Trend of changes between the total abundance of clones under different detection sample numbers for each group. ***P ≤ 0.001, **P ≤ 0.01, *P ≤ 0.05. ns = no significance.
Figure 3
Figure 3
Gene usage analysis of the T cell receptor (TCR) β repertoires. Frequency of V gene (A) and J gene (B) usage in different samples. (C) Frequency of the similar patterns of V gene, J gene, and VJ pairing in different groups. (D) ROC curves showing the performance of the classification into four groups using the V gene, J gene, and VJ pairing via 10-fold cross-validation.
Figure 4
Figure 4
Identification and characteristic analysis of COVID-19-associated T cell receptor (TCR) β clones. (A) Differences in the detected clones between the COVID-19 and healthy control (HC) groups (Fisher’s exact test). The horizontal axis is the clone’s relative risk (RR) index and the vertical axis is the FDR value after correction using Fisher’s exact test. (B) Distribution of the clone detection sample numbers between the COVID-19 and HC groups. (C) Comparison of COVID-19-specific, protective, and random clones in terms of CDR3 length, CDR3 sequence similarity, and clone abundance. (D) Similarity network of the CDR3 sequences of the clones with a difference in FDR values of < 0.001 between the COVID-19 and HC groups. Clones identified as dark red dots are COVID-19-specific clones, whereas those identified as light green dots are protective clones. The size of the dot represents the clone’s cumulative frequency in all samples. (E) Similarity network of CDR3 sequences in the 1000 clones (dominant clones) with the highest frequency in the COVID-19 and HC groups. The node degree of the cluster graph in (D, E) is > 2.
Figure 5
Figure 5
COVID-19 detection using T cell receptor (TCR) β clones from different classification models. (A) Distribution of the number of COVID-19-related clones in all the unique TCR βs of the sample. ROC curve showing the performance of all COVID-19 samples according to this ratio. (B) Frequency distribution bar plot of the 12 most significant COVID-19-related clones (FDR < 1e−8). ROC curve showing the performance of the test COVID-19 samples according to the random forest model using four variables. (C) Classification performance evaluations of the accuracy and AUC of the test set for two groups under different FDR thresholds.
Figure 6
Figure 6
(A) Database annotation of the T cell receptor (TCR) β repertoire for each sample using TBAdb, VDJdb, and McPAS-TCR. (B) The percentage of annotated specific clones for significantly different groups. **P ≤ 0.01, *P ≤ 0.05 and ns P > 0.05. ns = no significance.

Similar articles

Cited by

References

    1. Zhou P, Yang XL, Wang XG, Hu B, Zhang L, Zhang W, et al. . A pneumonia outbreak associated with a new coronavirus of probable bat origin. Nature (2020) 579(7798):270–3. doi: 10.1038/s41586-020-2012-7 - DOI - PMC - PubMed
    1. Brouwer PJM, Caniels TG, van der Straten K, Snitselaar JL, Aldon Y, Bangaru S, et al. . Potent neutralizing antibodies from covid-19 patients define multiple targets of vulnerability. Science (2020) 369(6504):643–50. doi: 10.1126/science.abc5902 - DOI - PMC - PubMed
    1. Taylor L. Covid-19: true global death toll from pandemic is almost 15 million, says who. Bmj (2022) 377:o1144. doi: 10.1136/bmj.o1144 - DOI - PubMed
    1. Huang C, Wang Y, Li X, Ren L, Zhao J, Hu Y, et al. . Clinical features of patients infected with 2019 novel coronavirus in wuhan, China. Lancet (2020) 395(10223):497–506. doi: 10.1016/s0140-6736(20)30183-5 - DOI - PMC - PubMed
    1. Zhou F, Yu T, Du R, Fan G, Liu Y, Liu Z, et al. . Clinical course and risk factors for mortality of adult inpatients with covid-19 in wuhan, China: a retrospective cohort study. Lancet (2020) 395(10229):1054–62. doi: 10.1016/s0140-6736(20)30566-3 - DOI - PMC - PubMed

Publication types

Substances