. 2023 Jul 5:14:1171083.
doi: 10.3389/fimmu.2023.1171083. eCollection 2023.

An oncolytic adenovirus coding for a variant interleukin 2 cytokine improves response to chemotherapy through enhancement of effector lymphocyte cytotoxicity, fibroblast compartment modulation and mitotic slippage

Affiliations

An oncolytic adenovirus coding for a variant interleukin 2 cytokine improves response to chemotherapy through enhancement of effector lymphocyte cytotoxicity, fibroblast compartment modulation and mitotic slippage

Santeri Pakola et al. Front Immunol. .

Abstract

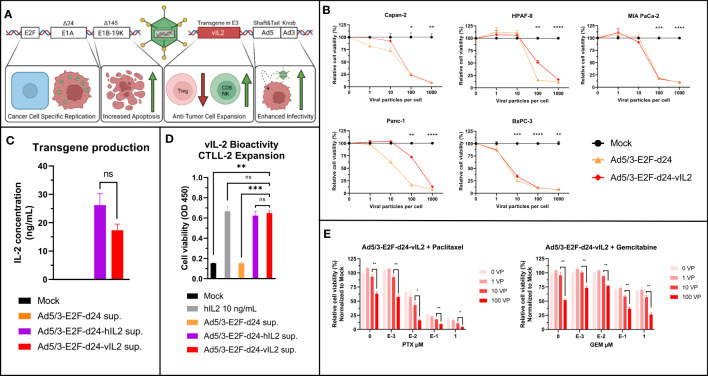
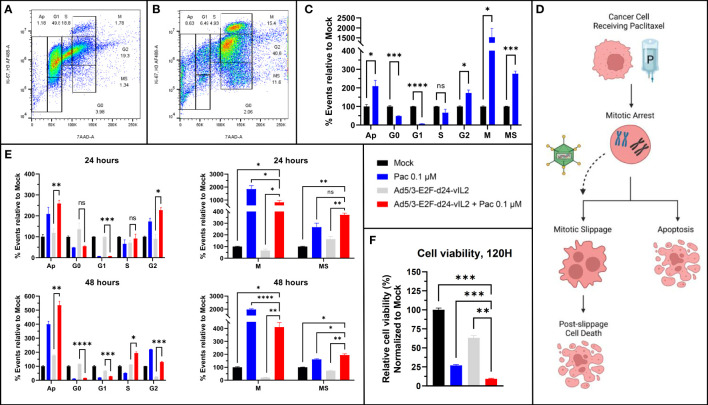
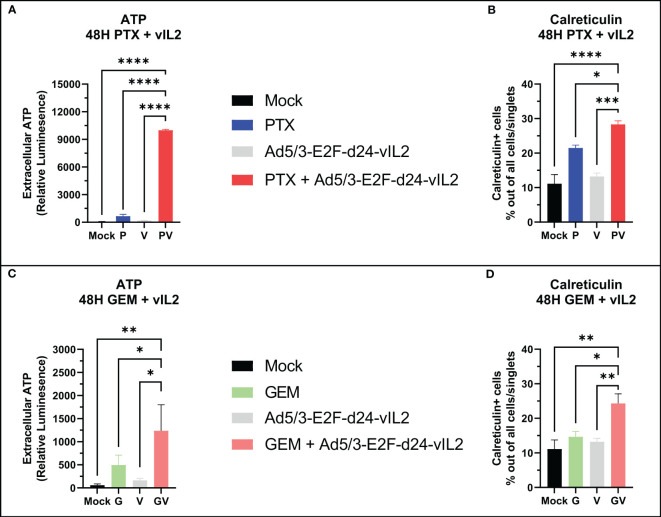
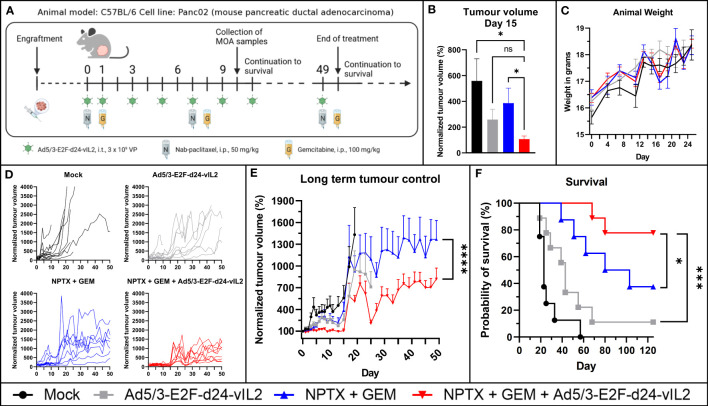
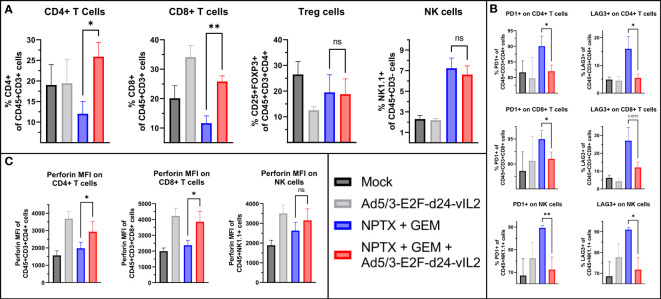
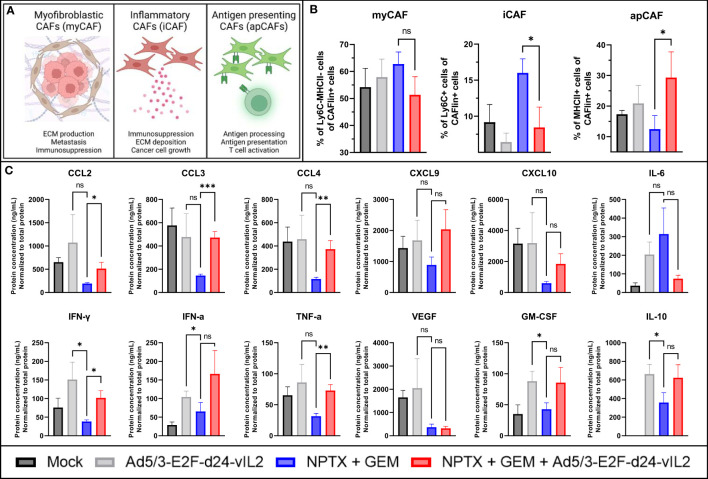
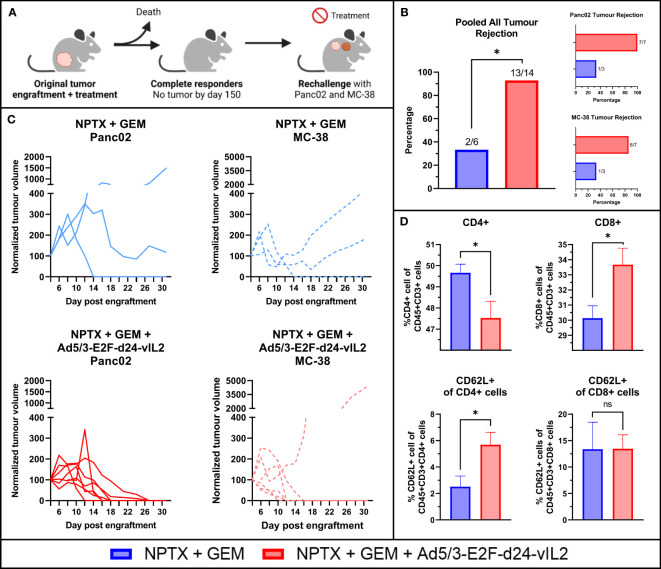
Pancreatic ductal adenocarcinoma (PDAC) is a highly treatment-resistant cancer. Currently, the only curative treatment for PDAC is surgery, but most patients are diagnosed with metastatic disease and thus outside the scope of surgery. The majority of metastatic patients receive chemotherapy, but responses are limited. New therapeutics are thus urgently needed for PDAC. One major limitation in treating PDAC has been the highly immunosuppressive tumor microenvironment (TME) which inhibits anti-cancer immune responses. We have constructed an oncolytic adenovirus coding for a variant the interleukin 2 molecule, Ad5/3-E2F-d24-vIL2 (also known as TILT-452, and "vIL-2 virus"), with preferential binding to IL-2 receptors on the surface of effector lymphocytes over T regulatory cells (T regs). In the present study this virus was evaluated in combination with nab-paclitaxel and gemcitabine chemotherapy in Panc02 mouse model. Ad5/3-E2F-d24-vIL2 showed marked PDAC cell killing in vitro, alongside induction of mitotic slippage and immunogenic cell death in PDAC cell lines, when combined with chemotherapy. Increased survival was seen in vivo with 80% of animals surviving long term, when compared to chemotherapy alone. Moreover, combination therapy mediated enhanced tumor growth control, without observable toxicities in internal organs or external features. Survival and tumor control benefits were associated with activation of tumor infiltrating immune cells, downregulation of inhibitory signals, change in fibroblast populations in the tumors and changes in intratumoral cytokines, with increased chemokine amounts (CCL2, CCL3, CCL4) and anti-tumor cytokines (IFN-γ and TNFα). Furthermore, vIL-2 virus in combination with chemotherapy efficiently induced tumor protection upon rechallenge, that was extended to a previously non-encountered cancer cell line. In conclusion, Ad5/3-E2F-d24-vIL2 is a promising immunotherapy candidate when combined with nab-paclitaxel and gemcitabine.

Keywords: adenovirus; chemotherapy; immunotherapy; interleukin 2; oncolytic virus.


Conflict of interest statement

AH is a shareholder in Targovax ASA. AH, JC, VCC, JMS are an employees and shareholders in TILT Biotherapeutics Ltd. DQ, EJ, LH, RH are employees of TILT Biotherapeutics Ltd. The remaining authors declare that the research was conducted in the absence of any commercial or financial relationships that could be construed as a potential conflict of interest.

Figures

Figure 1
Figure 1
Ad5/3-E2F-d24-vIL2 (TILT-452) viral structure and in vitro testing. (A) Graphical illustration of Ad5/3-d24-E2F-vIL2 genetic structure. (B) Human commercial PDAC cell lines used for testing the oncolytic ability of Ad5/3-E2F-d24-vIL2. Relative cell viability by MTS and statistical difference to Mock on day 5 shown. (C) Transgene production in supernatants from Panc-1 cells infected with unarmed, human IL2 and variant IL2 coding viruses for 48 hours. (D) Variant IL2 bioactivity assessed by CTLL-2 expansion following supernatant or human recombinant IL2 administration. (E) In vitro evaluation of combination of Ad5/3-d24-E2F-vIL2 in combination with paclitaxel and gemcitabine in Panc-1 cells 5 days post treatment. Difference between 100 VP group and all other groups calculated by unpaired t-test with Welch’s correction. Significance between 10 and 100 VP shown. Error presented as +/- SEM. Significance denoted as p-value < 0.05 = *, < 0.01 = **, < 0.001 = ***, <0.0001 = ****. N=3 biological replicates for all experiments. ns = not significant.
Figure 2
Figure 2
Cell cycle analysis. (A) Untreated Panc-1 cells and (B) Panc-1 cells treated with paclitaxel after 48 hours. (C) Changes in cell cycle population proportions after paclitaxel treatment, showing G2 and M-stasis. (D) Graphical illustration of proposed mechanism of action. (E) Cell population changes after 24 and 48 hours of treatment with paclitaxel, Ad5/3-E2F-d24-vIL2 and combination of Ad5/3-E2F-d24-vIL2 to paclitaxel. Cell proportions normalized to untreated cells. (F) Cell viability after 120 hours after treatment. N=3. Difference between groups measured by an unpaired T-test with Welch’s correction. Error presented as SEM. Significance denoted as p-value < 0.05 = *, < 0.01 = **, < 0.001 = ***, <0.0001 = ****.
Figure 3
Figure 3
In vitro immunogenic cell death evaluation. (A) Extracellular ATP release and (B) calreticulin expression from Panc-1 cells when vIL-2 virus is combined with paclitaxel. (C) Extracellular ATP release and (D) calreticulin expression from Panc-1 cells when vIL-2 virus is combined with gemcitabine. Difference between groups measured by an unpaired T-test with Welch’s correction. Error presented as SEM. Significance denoted as p-value < 0.05 = *, < 0.01 = **, < 0.001 = ***, <0.0001 = ****. N=3 biological replicates for all experiments.
Figure 4
Figure 4
In vivo evaluation of Ad5/3-E2F-d24-vIL2 in combination with nab-paclitaxel and gemcitabine in Panc02 mouse model. (A) Animal experiment plan and treatment schedule. (B) Short term tumor control. (C) Animal weight changes during the therapy. Difference measured with unpaired t-test with Welch’s correction. (D) Individual tumor growth curves. (E) Long term tumor growth curves. Group plotted until 70% of the animals in the group are alive. Difference measured with linear mix-model analysis. (F) Kapplan-Meier survival plot of the animals. N=8 or 9 per group. Difference measured with weighted log-rank test. Error presented as SEM. Significance denoted as p-value < 0.05 = *, <0.001 = ***, <0.0001 = ****. ns = not significant.
Figure 5
Figure 5
Flow cytometric analysis of tumors collected on day 10. (A) Changes in intratumoral CD4+, CD8+ T cells and NK cells between the groups. (B) Changes in intratumoral PD1+ and LAG3+ CD4+, CD8+ T cells and NK cells. (C) Changes in perforin surface density of intratumoral CD4+, CD8+ T and NK cells. Difference between groups measured by an unpaired T-test with Welch’s correction. Error presented as SEM. Significance denoted as p-value < 0.05 = *, < 0.01 = **. N=5 biological replicates for all experiments.
Figure 6
Figure 6
In vivo evaluation of TME on day 10. (A) Graphical representation of different CAFs and their functions. (B) Evaluation of intratumoral CAF subsets by flow cytometry. CAFlin = CD45-EPCAM-PDPN+ (C) Changes in intratumoral cytokines. Difference between groups measured by an unpaired T-test with Welch’s correction. Error presented as SEM. Significance denoted as p-value < 0.05 = *, < 0.01 = **, < 0.001 = ***. N=5 biological replicates for all experiments.
Figure 7
Figure 7
Re-challenge animal experiment. (A) Rechallenge animal experiment plan. (B) Pooled all tumor rejection, rejection of original Panc02 and rejection of un-encountered MC-38. (C) Individual tumor growth curves (D) Evaluation of CD4+, CD8+ splenocytes and their CD62L positivity evaluating memory formation in splenocytes after 31 days. N=7 for NPTX + GEM + vIL2 group, N=3 for NPTX + GEM. Difference in tumor rejection measured with Fisher’s exact test. Difference in immune cells between groups measured by an unpaired T-test with Welch’s correction. Error presented as SEM. Significance denoted as p-value < 0.05 = *.

Similar articles

Cited by

References

    1. Rawla P, Sunkara T, Gaduputi V. Epidemiology of pancreatic cancer: global trends, etiology and risk factors. World J Oncol (2019) 10(1):10–27. doi: 10.14740/wjon1166 - DOI - PMC - PubMed
    1. Mizrahi JD, Surana R, Valle JW, Shroff RT. Pancreatic cancer. Lancet. (2020) 395(10242):2008–20. doi: 10.1016/S0140-6736(20)30974-0 - DOI - PubMed
    1. Cascinu S, Falconi M, Valentini V, Jelic S, Group EGW. Pancreatic cancer: ESMO clinical practice guidelines for diagnosis, treatment and follow-up. Ann Oncol (2010) 21 Suppl 5:v55–8. doi: 10.1093/annonc/mdq165 - DOI - PubMed
    1. Von Hoff DD, Ervin T, Arena FP, Chiorean EG, Infante J, Moore M, et al. . Increased survival in pancreatic cancer with nab-paclitaxel plus gemcitabine. N Engl J Med (2013) 369(18):1691–703. doi: 10.1056/NEJMoa1304369 - DOI - PMC - PubMed
    1. Conroy T, Desseigne F, Ychou M, Bouche O, Guimbaud R, Becouarn Y, et al. . FOLFIRINOX versus gemcitabine for metastatic pancreatic cancer. N Engl J Med (2011) 364(19):1817–25. doi: 10.1056/NEJMoa1011923 - DOI - PubMed

Publication types