Randomized Controlled Trial
. 2023 Jul 4:13:1091083.
doi: 10.3389/fcimb.2023.1091083. eCollection 2023.

Anti-osteoporotic drugs affect the pathogenesis of gut microbiota and its metabolites: a clinical study

Affiliations
Randomized Controlled Trial

Anti-osteoporotic drugs affect the pathogenesis of gut microbiota and its metabolites: a clinical study

Rui-Kun Zhang et al. Front Cell Infect Microbiol. .

Abstract

Background: Disordered gut microbiota (GM) structure and function may contribute to osteoporosis (OP). This study explores how traditional Chinese medicine (TCM) intervention affects the structure and function of the GM in patients with OP.

Method: In a 3-month clinical study, 43 patients were randomly divided into two groups receiving conventional treatment and combined TCM (Yigu decoction, YGD) treatment. The correlation between the intestinal flora and its metabolites was analyzed using 16S rDNA and untargeted metabolomics and the combination of the two.

Results: After three months of treatment, patients in the treatment group had better bone mineral density (BMD) than those in the control group (P < 0.05). Patients in the treatment group had obvious abundance changes in GM microbes, such as Bacteroides, Escherichia-Shigella, Faecalibacterium, Megamonas, Blautia, Klebsiella, Romboutsia, Akkermansia, and Prevotella_9. The functional changes observed in the GM mainly involved changes in metabolic function, genetic information processing and cellular processes. The metabolites for which major changes were observed were capsazepine, Phe-Tyr, dichlorprop, D-pyroglutamic acid and tamsulosin. These metabolites may act through metabolic pathways, the citrate cycle (TCA cycle) and beta alanine metabolism. Combined analysis showed that the main acting metabolites were dichlorprop, capsazepine, D-pyroglutamic acid and tamsulosin.

Conclusion: This study showed that TCM influenced the structure and function of the GM in patients with OP, which may be one mechanism by which TCM promotes the rehabilitation of patients with OP through the GM.

Keywords: 16S rDNA; clinical study; gut microbiota; osteoporosis; untargeted metabolism.


Conflict of interest statement

The authors declare that the research was conducted in the absence of any commercial or financial relationships that could be construed as a potential conflict of interest.

Figures
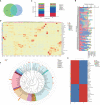
Figure 1
Figure 1
species annotation of the GM in the two groups of OP patients. FRA represents the control group and YGD represents the treatment group. (A) Venn diagram based on OTUs. (B) The species relative abundance display for each sample at the genus level. (C) The top 10 ranked species in abundance at the genus level in both groups. (D) Species abundance clustering. (E) Species abundance clustering Heatmap. (F) Genus level species evolution tree.
Figure 2
Figure 2
Diversity analysis and statistical tests. (A) Species diversity curves. (B) Alpha Diversity Index Difference Analysis Between Groups. ***represents p < 0.01. (C) PCoA analysis based on two groups of species. (D) Beta Diversity Index Difference Analysis Between Groups. **represents p < 0.05. (E) Weighted UniFrac distance matrix UPGMA clustering tree. (F) Unweighted Unifrac distance matrix UPGMA clustering tree. (G) Differential species analysis between groups (T-test). The figure on the left shows the difference in species abundance between groups. (H) Differential species analysis between groups (Simper). (I) Differential species analysis between groups (LEfSe) - LDA value distribution histogram. (J) Differential species analysis between groups (LEfSe) - Evolutionary branch diagram. Red represents the Biomarker of the different species with obvious changes in the control group, green represents the Biomarker of the different species with obvious changes in the treatment group, and yellow represents the Biomarker of the different species with no obvious difference.
Figure 3
Figure 3
Figure of association analysis, model and functional prediction among species. (A) Network analysis. (B) Functional annotation relative abundance display. (C) T-test for differential function between groups. (D) Functional relative abundance cluster analysis.
Figure 4
Figure 4
The analysis of the difference of metabolites. (A) The orthogonal partial least squares discriminant analysis (OPLS-DA) - S-plot figure. (B) OPLS-DA model validation. (C) Differential metabolite volcano plot. (D) Differential metabolite bar plot. (E) Differential metabolite KEGG enrichment analysis.
Figure 5
Figure 5
Joint analysis of gut microbiota and differential metabolites. (A) Metabolite principal component analysis, score plots of the first 2 PCA principal components. (B) Principal component analysis of bacterial groups, score plots of the first 2 PCA principal components. (C) Spearman correlation chord plot of differential microbial and differential metabolites. (D) Pearson correlation and string plot of differential microbes with differential metabolites. (E) Spearman correlation network plots of differential microbes and differential metabolites. (F) Pearson correlation network plots of differential microbes and differential metabolites.

References

    1. An J., Yang H., Zhang Q., Liu C., Zhao J., Zhang L., et al. (2016). Natural products for treatment of osteoporosis: the effects and mechanisms on promoting osteoblast-mediated bone formation. Life Sci. 147, 46–58. doi: 10.1016/j.lfs.2016.01.024 - DOI - PubMed
    1. An Y., Zhang H., Wang C., Jiao F., Xu H., Wang X., et al. (2019). Activation of ROS/MAPKs/NF-κB/NLRP3 and inhibition of efferocytosis in osteoclast-mediated diabetic osteoporosis. FASEB J. 33, 12515–12527. doi: 10.1096/fj.201802805RR - DOI - PMC - PubMed
    1. Cattaneo A., Cattane N., Galluzzi S., Provasi S., Lopizzo N., Festari C., et al. (2017). Association of brain amyloidosis with pro-inflammatory gut bacterial taxa and peripheral inflammation markers in cognitively impaired elderly. Neurobiol. Aging 49, 60–68. doi: 10.1016/j.neurobiolaging.2016.08.019 - DOI - PubMed
    1. Chen L., Lu W., Wang L., Xing X., Chen Z., Teng X., et al. (2021. a). Metabolite discovery through global annotation of untargeted metabolomics data. Nat. Methods 18, 1377–1385. doi: 10.1038/s41592-021-01303-3 - DOI - PMC - PubMed
    1. Chen Z., Xie L., Xu J., Lin X., Ye J., Shao R., et al. (2021. b). Changes in alkaline phosphatase, calcium, c-reactive protein, d-dimer, phosphorus and hemoglobin in elderly osteoporotic hip fracture patients. Ann. Palliat Med. 10, 1079–1088. doi: 10.21037/apm-20-218 - DOI - PubMed

Publication types