. 2023 Jul 5:17:1208121.
doi: 10.3389/fncel.2023.1208121. eCollection 2023.

Locus coeruleus inhibition of vibrissal responses in the trigeminal subnucleus caudalis are reduced in a diabetic mouse model

Affiliations

Locus coeruleus inhibition of vibrissal responses in the trigeminal subnucleus caudalis are reduced in a diabetic mouse model

Alberto Mesa-Lombardo et al. Front Cell Neurosci. .

Abstract

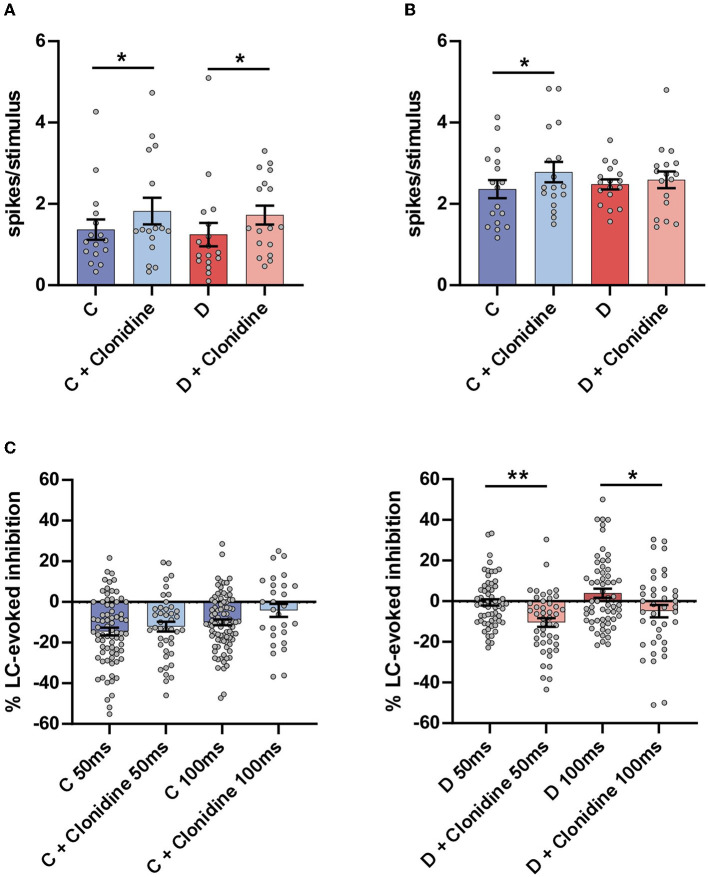
Diabetic neuropathy is the loss of sensory function beginning distally in the lower extremities, which is also characterized by pain and substantial morbidity. Furthermore, the locus coeruleus (LC) nucleus has been proposed to play an important role in descending pain control through the activation of α2-noradrenergic (NA) receptors in the spinal dorsal horn. We studied, on control and diabetic mice, the effect of electrical stimulation of the LC nucleus on the tactile responses in the caudalis division of the spinal trigeminal nucleus (Sp5C), which is involved in the relay of orofacial nociceptive information. Diabetes was induced in young adult C57BL/6J mice with one intraperitoneal injection of streptozotocin (50 mg/kg) daily for 5 days. The diabetic animals showed pain in the orofacial area because they had a decrease in the withdrawal threshold to the mechanical stimulation in the vibrissal pad. LC electrical stimulation induced the inhibition of vibrissal responses in the Sp5C neurons when applied at 50 and 100 ms before vibrissal stimulation in the control mice; however, the inhibition was reduced in the diabetic mice. These effects may be due to a reduction in the tyrosine hydroxylase positive (TH+) fibers in the Sp5C, as was observed in diabetic mice. LC-evoked inhibition was decreased by an intraperitoneal injection of the antagonist of the α2-NA receptors, yohimbine, indicating that it was due to the activation of α2-NA receptors. The decrease in the LC-evoked inhibition in the diabetic mice was partially recovered when clonidine, a non-selective α2-agonist, was injected intraperitoneally. These findings suggest that in diabetes, there is a reduction in the NA inputs from the LC in the Sp5C that may favor the development of chronic pain.

Keywords: clonidine; diabetes; hyperglycemia; neuropathic pain; noradrenergic transmission; yohimbine; α2-noradrenergic receptor.


Conflict of interest statement

The authors declare that the research was conducted in the absence of any commercial or financial relationships that could be construed as a potential conflict of interest.

Figures

Figure 1
Figure 1
Diabetic mice showed a reduction in their TH+ cells in LC and TH+ terminals in Sp5C. (A) Representative photomicrographs of TH+ labeled cells in the LC of the control (left) and the diabetic mice (right). Two different anteroposterior planes are shown [−5.4 mm (upper) and −5.68 mm (lower) from bregma photographs; 20 X]. Note the reduction in the TH+ labeled cells in diabetic mice. (B) Representative photomicrographs of TH+ labeled fibers in the Sp5C of the control (left) and diabetic mice (right) at −7.6 mm from bregma (40X). A clear reduction in TH+ fibers is observed in lamina II and laminae III–IV in diabetic mice. In the control section (left) short, white bars indicate the approximate boundaries between the trigeminal tract (T) and lamina I (I), lamina II (II), and laminae III-IV (III–IV). These sections were among those used for densitometric measures. (C) Representative photomicrographs of TH+ labeled cells in the TG of the control (left) and the diabetic mice (right). These sections were among those used for densitometric measures. (D–F) Density measures of TH+ immunoreactivity in LC (D), lamina II, and laminae III-IV in the Sp5C (E) and TG (F). The density measures showed statistically significant differences between the control and the diabetic mice (n = 4 and 7, respectively, using hemispheres as sampling units) in all cases (p = 0.0269 in LC; p = 0.0003 in SP5C lamina II; p = 0.0053 in Sp5C laminae III-IV). Scale bar 25 μm (A) and 50 μm (B, C). In this and in the following figures *p < 0.05; **p < 0.01; ***p < 0.001.
Figure 2
Figure 2
LC electrical stimulation induced an inhibition of the vibrissal responses in the control mice but not in the diabetic mice. (A) A scheme of the stimulation protocol is shown. The upper insets show representative PSTHs of the vibrissal responses (30 stimuli) in a control case and an example of the unit recordings (green traces). The black vertical arrows indicate vibrissal stimulation; the brown vertical arrow indicates LC stimulation. The vibrissal response was reduced when LC stimulation occurred 50 ms before vibrissal stimulation. (B) Plot of the percentage of LC-evoked inhibition in the control and the diabetic animals when LC stimulation preceded 50 ms vibrissal stimulation. (C) Plots of the mean vibrissal response in a basal period and when the LC and vibrissal stimulation were paired at 50, 100, and 300 ms. The response was reduced in the control mice (left plot) at a 50 and 100 ms delay. By contrast, LC stimulation did not affect the vibrissal responses at any delay in the STC-induced diabetic mice (right plot). In this and in the following figures *p < 0.05; ***p < 0.001.
Figure 3
Figure 3
Intraperitoneal injection of the antagonist of the α2-NA receptors yohimbine reduced the LC and vibrissal responses only in the control mice as well as the LC-evoked inhibition. (A) Plot of the mean LC response in the control (C; blue bars) and in the diabetic (D; red bars) mice. The LC response in the basal condition (before drug injection; strong blue color) was reduced after yohimbine injection (2 mg/kg i.p. light blue bar). However, the LC responses were not affected by yohimbine in the diabetic mice (strong and light red bars). (B) Plot of the mean vibrissal response in the control (blue bars) and in the diabetic (red bars) mice. In the control mice, the vibrissal response was reduced after the yohimbine injection but not in the diabetic mice. (C) Plots of the LC-evoked inhibition at a 50 and a 100 ms delay. Yohimbine injection reduced the LC-evoked inhibition in the control mice but did not affect the inhibition in the diabetic mice. *p < 0.05.
Figure 4
Figure 4
Effect of the non-selective α2 agonist clonidine on Sp5C responses. (A) Plot of the mean LC responses in the control (C; blue bars) and in the diabetic (D; red bars) mice. The LC response (strong blue bar before drug injection) was increased after clonidine injection in the control mice (2 mg/Kg i.p.; light blue bar). The increment of LC responses in the diabetic mice did not reach statistical significance (strong and light green bars). (B) Plot of the mean vibrissal response in the control (blue bars) and in the diabetic (green) mice. In the control mice, the vibrissal response was increased after clonidine injection but not in the diabetic mice. (C) Plots of the LC-evoked inhibition at a 50 and a 100 ms delay. The clonidine injection reduced the LC-evoked inhibition slightly in the control mice, but these differences were not statistically significant. However, the LC-evoked inhibition was increased significantly in diabetic mice. *p < 0.05, **p < 0.001.
Figure 5
Figure 5
Diabetic mice showed pain in the orofacial area. (A) A scheme of the behavioral test is shown. (B) The diabetic mice showed a decrease in the withdrawal threshold to mechanical stimulation in the vibrissal pad the 2nd and 3rd week after the STZ injection by comparison with the basal values obtained before the STZ injection. Asterisks indicate the differences with the basal values; §§ differences with respect to the values obtained in the control mice. ***p < 0.001; §§p < 0.01.

Similar articles

Cited by

References

    1. Abbott C. A., Malik R. A., Van Ross E. R., Kulkarni J., Boulton A. J. (2011). Prevalence and characteristics of painful diabetic neuropathy in a large community-based diabetic population in the U.K. Diabetes Care 34, 2220–4. 10.2337/dc11-1108 - DOI - PMC - PubMed
    1. Aston-Jones G. (2005). Brain structures and receptors involved in alertness. Sleep Med, 6(Suppl 1), S3–7. 10.1016/S1389-9457(05)80002-4 - DOI - PubMed
    1. Bae Y. C., Ihn H. J., Park M. J., Ottersen O. P., Moritani M., Yoshida A., et al. . (2000). Identification of signal substances in synapses made between primary afferents and their associated axon terminals in the rat trigeminal sensory nuclei. J. Comp. Neurol. 418, 299–309. 10.1002/(SICI)1096-9861(20000313)418:3andlt;299::AID-CNE5andgt;3.0.CO;2-I - DOI - PubMed
    1. Balasubramanyan S., Stemkowski P. L., Stebbing M. J., Smith P. A. (2006). Sciatic chronic constriction injury produces cell-type-specific changes in the electrophysiological properties of rat substantia gelatinosa neurons. J. Neurophysiol. 96, 579–90. 10.1152/jn.00087.2006 - DOI - PubMed
    1. Benarroch E. E. (2018). Locus coeruleus. Cell Tissue Res. 373, 221–232. 10.1007/s00441-017-2649-1 - DOI - PubMed

LinkOut - more resources