

Label-free atherosclerosis diagnosis through a blood drop of apolipoprotein E knockout mouse model using surface-enhanced Raman spectroscopy validated by machine learning algorithm
- PMID: 37476064
- PMCID: PMC10354754
- DOI: 10.1002/btm2.10529
Label-free atherosclerosis diagnosis through a blood drop of apolipoprotein E knockout mouse model using surface-enhanced Raman spectroscopy validated by machine learning algorithm
Abstract
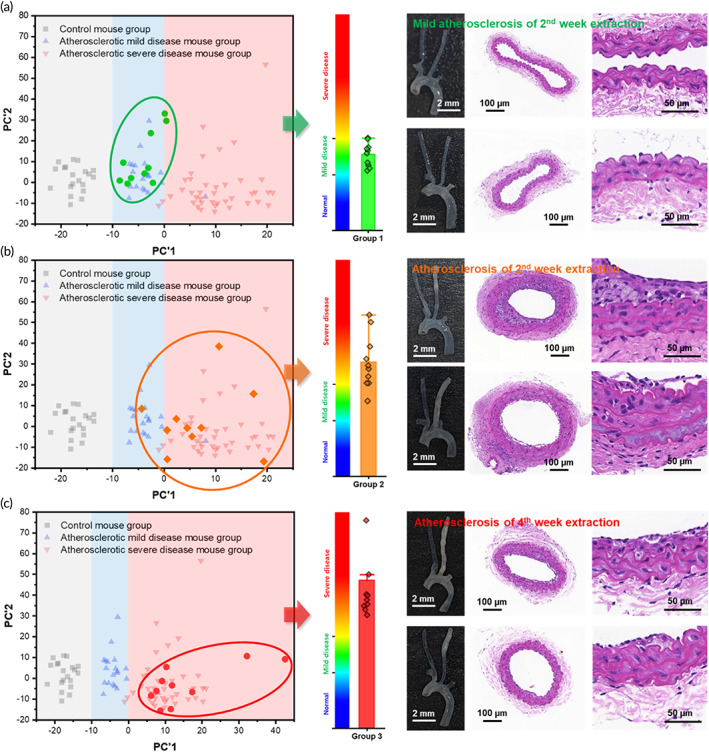
The direct preventative detection of flow-induced atherosclerosis remains a significant challenge, impeding the development of early treatments and prevention measures. This study proposes a method for diagnosing atherosclerosis in the carotid artery using nanometer biomarker measurements through surface-enhanced Raman spectroscopy (SERS) from single-drop blood samples. Atherosclerotic acceleration is induced in apolipoprotein E knockout mice which underwent a partial carotid ligation and were fed a high-fat diet to rapidly induce disturbed flow-induced atherosclerosis in the left common carotid artery while using the unligated, contralateral right carotid artery as control. The progressive atherosclerosis development of the left carotid artery was verified by micro-magnetic resonance imaging (micro-MRI) and histology in comparison to the right carotid artery. Single-drop blood samples are deposited on chips of gold-coated ZnO nanorods grown on silicon wafers that filter the nanometer markers and provide strong SERS signals. A diagnostic classifier was established based on principal component analysis (PCA), which separates the resultant spectra into the atherosclerotic and control groups. Scoring based on the principal components enabled the classification of samples into control, mild, and severe atherosclerotic disease. The PCA-based analysis was validated against an independent test sample and compared against the PCA-PLS-DA machine learning algorithm which is known for applicability to Raman diagnosis. The accuracy of the PCA modification-based diagnostic criteria was 94.5%, and that of the machine learning algorithm 97.5%. Using a mouse model, this study demonstrates that diagnosing and classifying the severity of atherosclerosis is possible using a single blood drop, SERS technology, and machine learning algorithm, indicating the detectability of biomarkers and vascular factors in the blood which correlate with the early stages of atherosclerosis development.
Keywords: ApoE KO mouse; atherosclerosis; nano‐sized biomarker; principal component analysis; surface‐enhanced Raman spectroscopy.
© 2023 The Authors. Bioengineering & Translational Medicine published by Wiley Periodicals LLC on behalf of American Institute of Chemical Engineers.
Conflict of interest statement
Jun Ki Kim is a scientific advisor to the startup Apollon Inc. (Korea), which may develop diagnostic devices based on this work. The authors have declared that no other competing interests exist.
Figures


Similar articles
-
Early-stage diagnosis of bladder cancer using surface-enhanced Raman spectroscopy combined with machine learning algorithms in a rat model.Biosens Bioelectron. 2024 Feb 15;246:115915. doi: 10.1016/j.bios.2023.115915. Epub 2023 Dec 8. Biosens Bioelectron. 2024. PMID: 38081101
-
Diagnosis in a Preclinical Model of Bladder Pain Syndrome Using a Au/ZnO Nanorod-based SERS Substrate.Nanomaterials (Basel). 2019 Feb 7;9(2):224. doi: 10.3390/nano9020224. Nanomaterials (Basel). 2019. PMID: 30736472 Free PMC article.
-
Contralateral artery enlargement predicts carotid plaque progression based on machine learning algorithm models in apoE-/- mice.Biomed Eng Online. 2016 Dec 28;15(Suppl 2):146. doi: 10.1186/s12938-016-0265-z. Biomed Eng Online. 2016. PMID: 28155719 Free PMC article.
-
Comparison of surface-enhanced Raman spectral data sets of filtrate portions of serum samples of hepatitis B and Hepatitis C infected patients obtained by centrifugal filtration.Photodiagnosis Photodyn Ther. 2023 Jun;42:103532. doi: 10.1016/j.pdpdt.2023.103532. Epub 2023 Mar 22. Photodiagnosis Photodyn Ther. 2023. PMID: 36963645
-
Raman spectroscopy and surface-enhanced Raman spectroscopy (SERS) spectra of salivary glands carcinoma, tumor and healthy tissues and their homogenates analyzed by chemometry: Towards development of the novel tool for clinical diagnosis.Anal Chim Acta. 2021 Sep 8;1177:338784. doi: 10.1016/j.aca.2021.338784. Epub 2021 Jun 18. Anal Chim Acta. 2021. PMID: 34482902
Cited by
-
Post-Transplant Liver Monitoring Utilizing Integrated Surface-Enhanced Raman and AI in Hepatic Ischemia-Reperfusion Injury Animal Model.Int J Nanomedicine. 2025 May 27;20:6743-6755. doi: 10.2147/IJN.S497900. eCollection 2025. Int J Nanomedicine. 2025. PMID: 40452789 Free PMC article.
-
Diagnostic accuracy of machine learning approaches to identify psoriatic arthritis: a meta-analysis.Clin Exp Med. 2025 Aug 9;25(1):284. doi: 10.1007/s10238-025-01734-8. Clin Exp Med. 2025. PMID: 40782250 Free PMC article. Review.
-
Machine learning-assisted point-of-care diagnostics for cardiovascular healthcare.Bioeng Transl Med. 2025 Feb 3;10(4):e70002. doi: 10.1002/btm2.70002. eCollection 2025 Jul. Bioeng Transl Med. 2025. PMID: 40708978 Free PMC article. Review.
-
Role of Flow-Sensitive Endothelial Genes in Atherosclerosis and Antiatherogenic Therapeutics Development.J Cardiovasc Transl Res. 2024 Jun;17(3):609-623. doi: 10.1007/s12265-023-10463-w. Epub 2023 Nov 27. J Cardiovasc Transl Res. 2024. PMID: 38010480 Review.
-
Wall Shear Stress (WSS) Analysis in Atherosclerosis in Partial Ligated Apolipoprotein E Knockout Mouse Model through Computational Fluid Dynamics (CFD).Int J Mol Sci. 2024 Sep 12;25(18):9877. doi: 10.3390/ijms25189877. Int J Mol Sci. 2024. PMID: 39337364 Free PMC article.
References
-
- Libby P. Inflammation in atherosclerosis. Nature. 2002;420:868‐874. - PubMed
-
- Lind L. Circulating markers of inflammation and atherosclerosis. Atherosclerosis. 2003;169:203‐214. - PubMed
-
- O'Donnell MJ, Xavier D, Liu L, et al. Risk factors for ischaemic and intracerebral haemorrhagic stroke in 22 countries (the INTERSTROKE study): a case‐control study. Lancet. 2010;376:112‐123. - PubMed
-
- Stary HC, Chandler AB, Dinsmore RE, et al. A definition of advanced types of atherosclerotic lesions and a histological classification of atherosclerosis – a report from the Committee on Vascular‐Lesions of the Council on Arteriosclerosis, American Heart Association. Circulation. 1995;92:1355‐1374. - PubMed
LinkOut - more resources
Full Text Sources
Research Materials
Miscellaneous
