. 2023 Jul 19;3(7):1286-1311.
doi: 10.1158/2767-9764.CRC-22-0427. eCollection 2023 Jul.

Metronomic Administration of Topotecan Alone and in Combination with Docetaxel Inhibits Epithelial-mesenchymal Transition in Aggressive Variant Prostate Cancers

Affiliations

Metronomic Administration of Topotecan Alone and in Combination with Docetaxel Inhibits Epithelial-mesenchymal Transition in Aggressive Variant Prostate Cancers

Taraswi Mitra Ghosh et al. Cancer Res Commun. .

Abstract

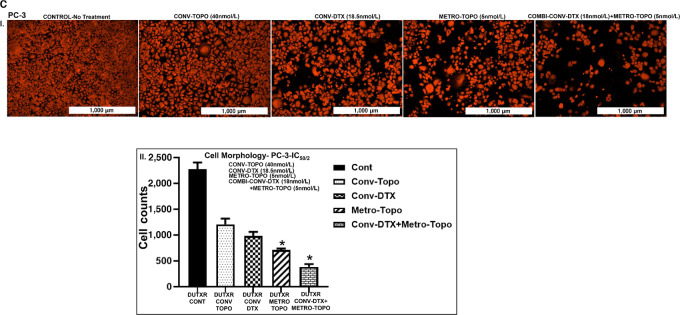
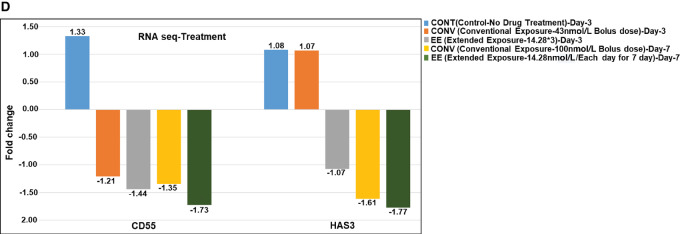
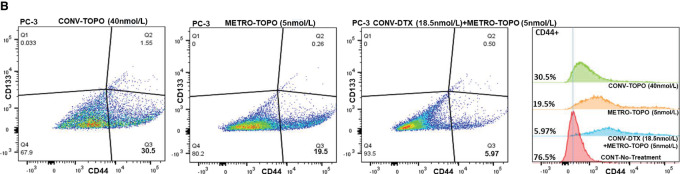
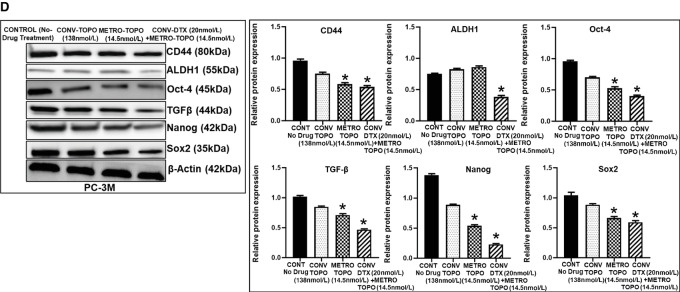
Prostate cancer is the second leading cause of noncutaneous cancer-related deaths in American men. Androgen deprivation therapy (ADT), radical prostatectomy, and radiotherapy remain the primary treatment for patients with early-stage prostate cancer (castration-sensitive prostate cancer). Following ADT, many patients ultimately develop metastatic castration-resistant prostate cancer (mCRPC). Standard chemotherapy options for CRPC are docetaxel (DTX) and cabazitaxel, which increase median survival, although the development of resistance is common. Cancer stem-like cells possess mesenchymal phenotypes [epithelial-to-mesenchymal transition (EMT)] and play crucial roles in tumor initiation and progression of mCRPC. We have shown that low-dose continuous administration of topotecan (METRO-TOPO) inhibits prostate cancer growth by interfering with key cancer pathway genes. This study utilized bulk and single-cell or whole-transcriptome analysis [(RNA sequencing (RNA-seq) and single-cell RNA sequencing (scRNA-seq)], and we observed greater expression of several EMT markers, including Vimentin, hyaluronan synthase-3, S100 calcium binding protein A6, TGFB1, CD44, CD55, and CD109 in European American and African American aggressive variant prostate cancer (AVPC) subtypes-mCRPC, neuroendocrine variant (NEPC), and taxane-resistant. The taxane-resistant gene FSCN1 was also expressed highly in single-cell subclonal populations in mCRPC. Furthermore, metronomic-topotecan single agent and combinations with DTX downregulated these EMT markers as well as CD44+ and CD44+/CD133+ "stem-like" cell populations. A microfluidic chip-based cell invasion assay revealed that METRO-TOPO treatment as a single agent or in combination with DTX was potentially effective against invasive prostate cancer spread. Our RNA-seq and scRNA-seq analysis were supported by in silico and in vitro studies, suggesting METRO-TOPO combined with DTX may inhibit oncogenic progression by reducing cancer stemness in AVPC through the inhibition of EMT markers and multiple oncogenic factors/pathways.

Significance: The utilization of metronomic-like dosing regimens of topotecan alone and in combination with DTX resulted in the suppression of makers associated with EMT and stem-like cell populations in AVPC models. The identification of molecular signatures and their potential to serve as novel biomarkers for monitoring treatment efficacy and disease progression response to treatment efficacy and disease progression were achieved using bulk RNA-seq and single-cell-omics methodologies.


Figures

FIGURE 1
FIGURE 1
NGS and single-cell transcriptomics identified signatures of EMT markers in ARHigh/mCSPC, ARLow/mCRPC/NEPC, ARLow/mCSPC/NEPCtaxane resistant EA/Caucasian and AA prostate cancer subtypes. A, Heat map representing DEG signature from bulk RNA-seq. (I) DEGs among ARHigh/mCSPC (LNCaP, VCAP, 22RV1) versus ARLow/mCRPC/NEPC (PC-3, PC-3M, DU145) prostate cancer and normal prostate cell lines (RWPE1, RWPE2; P < 0.05). (II) DEGs among top 100 genes in ARHigh/mCSPC (EA-LNCaP, VCAP, 22RV1 vs. AA-MDA-Pca-2b, RC77T/E, RC165T) and ARLow/mCRPC (EA-DU145, PC-3, PC-3M vs. AA-RC43T; P < 0.05). (III) DEGs among top EMT markers in ARHigh/mCSPC (EA-LNCaP, VCAP, 22RV1 vs. AA-MDA-Pca-2b, RC77T/E, RC165T) and ARLow/mCRPC/NEPC (EA-DU145, PC-3, PC-3M vs. AA-RC43T) prostate cancer cell lines (P < 0.05). B, EMT markers in ARHigh/mCSPC versus ARLow/mCRPC (scRNA-seq): Single-cell RNA sequencing using the droplet sequencing method (10X Genomics) was performed on the prostate cancer cell lines. Each dot represents a single cell. Contaminated (doublet) cells were not included. t-SNE plots showing the comparison between the single-cell clusters. (I) Subclonal distribution in all cell lines ARHigh/mCSPC (LNCaP, 22RV1) and ARLow/mCRPC/NEPC (PC-3, PC-3M, DU145). (II) Subclonal distribution of top two EMT markers (CD44 and HAS3) in all prostate cancer cell lines. (III and IV) Subclonal distribution of major EMT markers (AHNAK2, LOXL2, S1000A6, TGFB1, TGFBR2, UCHL1, VIM, ANXA2, ANXA2P2, ANXA3, CD55, CD109) in all prostate cancer cell lines. (V) Subclonal distribution of top taxane resistance marker FSCN1 in all prostate cancer cell lines. Results exhibiting EMT and taxane resistance marker expression were higher in ARLow/mCRPC/NEPC compared with ARHigh/mCSPC. (VI) Subclonal populations for all prostate cancer subtypes. The relative representation of each subclone between the prostate cancer cell lines was also provided using comparative pie charts. Results showed the intratumor heterogeneity and several clusters which are unique to each prostate cancer cell line, in addition to the shared subclusters possibly representing gene signatures common to the biology of prostate cancer. C, EMT markers in ARLow/mCRPC/NEPC versus ARLow/mCSPC/NEPCtaxane-resistant prostate cancer: UMAP-distributed stochastic neighbor embedded plots showing the comparison between the single-cell clusters. (I) Subclonal distribution between ARLow/mCRPC/NEPC (DU145) and ARLow/mCSPC/NEPCtaxane-resistant (DUTXR). (II) Subclonal distribution of top two EMT markers CD44 and HAS3 in DU145 versus DUTXR. Pie charts represent percentages of subclonal distribution of EMT markers. CD44 expression is higher in DUTXR and HAS-3 expression higher in DU145. (III) Subclonal distribution of major EMT markers (AHNAK2, LOXL2, S1000A6, TGFB1, TGFBR2, UCHL1, VIM. (IV) ANXA2, ANXA2P2, ANXA3, CD55, CD109) in DU145 versus DUTXR. Pie chart represented majority of EMT markers (LOXL2, TGFB1, UCHL1, VIM, ANXA2P2, CD55, CD109) expressed higher in DUTXR cell line. Results exhibiting EMT marker expression were high (EMT markets nonexpressing cells were low) in the ARLow/mCSPC/NEPCtaxane-resistant prostate cancer cell line (DUTXR). V, Top genes representing single-cell clusters that were shared and which were unique between DU145 and DUTXR. Common and unique DEGs between RNA-seq and scRNA-seq were also identified for all prostate cancer subtypes. Common genes were EMT markers, for example, VIM, AHNAK2, ANXA1, ANXA2, CD109, CD44, CD59, GPRC5A, HAS, S100A6, TGFBR2 (Supplementary Figs. S4 and S5; Supplementary Table S7).
FIGURE 1
FIGURE 1
NGS and single-cell transcriptomics identified signatures of EMT markers in ARHigh/mCSPC, ARLow/mCRPC/NEPC, ARLow/mCSPC/NEPCtaxane resistant EA/Caucasian and AA prostate cancer subtypes. A, Heat map representing DEG signature from bulk RNA-seq. (I) DEGs among ARHigh/mCSPC (LNCaP, VCAP, 22RV1) versus ARLow/mCRPC/NEPC (PC-3, PC-3M, DU145) prostate cancer and normal prostate cell lines (RWPE1, RWPE2; P < 0.05). (II) DEGs among top 100 genes in ARHigh/mCSPC (EA-LNCaP, VCAP, 22RV1 vs. AA-MDA-Pca-2b, RC77T/E, RC165T) and ARLow/mCRPC (EA-DU145, PC-3, PC-3M vs. AA-RC43T; P < 0.05). (III) DEGs among top EMT markers in ARHigh/mCSPC (EA-LNCaP, VCAP, 22RV1 vs. AA-MDA-Pca-2b, RC77T/E, RC165T) and ARLow/mCRPC/NEPC (EA-DU145, PC-3, PC-3M vs. AA-RC43T) prostate cancer cell lines (P < 0.05). B, EMT markers in ARHigh/mCSPC versus ARLow/mCRPC (scRNA-seq): Single-cell RNA sequencing using the droplet sequencing method (10X Genomics) was performed on the prostate cancer cell lines. Each dot represents a single cell. Contaminated (doublet) cells were not included. t-SNE plots showing the comparison between the single-cell clusters. (I) Subclonal distribution in all cell lines ARHigh/mCSPC (LNCaP, 22RV1) and ARLow/mCRPC/NEPC (PC-3, PC-3M, DU145). (II) Subclonal distribution of top two EMT markers (CD44 and HAS3) in all prostate cancer cell lines. (III and IV) Subclonal distribution of major EMT markers (AHNAK2, LOXL2, S1000A6, TGFB1, TGFBR2, UCHL1, VIM, ANXA2, ANXA2P2, ANXA3, CD55, CD109) in all prostate cancer cell lines. (V) Subclonal distribution of top taxane resistance marker FSCN1 in all prostate cancer cell lines. Results exhibiting EMT and taxane resistance marker expression were higher in ARLow/mCRPC/NEPC compared with ARHigh/mCSPC. (VI) Subclonal populations for all prostate cancer subtypes. The relative representation of each subclone between the prostate cancer cell lines was also provided using comparative pie charts. Results showed the intratumor heterogeneity and several clusters which are unique to each prostate cancer cell line, in addition to the shared subclusters possibly representing gene signatures common to the biology of prostate cancer. C, EMT markers in ARLow/mCRPC/NEPC versus ARLow/mCSPC/NEPCtaxane-resistant prostate cancer: UMAP-distributed stochastic neighbor embedded plots showing the comparison between the single-cell clusters. (I) Subclonal distribution between ARLow/mCRPC/NEPC (DU145) and ARLow/mCSPC/NEPCtaxane-resistant (DUTXR). (II) Subclonal distribution of top two EMT markers CD44 and HAS3 in DU145 versus DUTXR. Pie charts represent percentages of subclonal distribution of EMT markers. CD44 expression is higher in DUTXR and HAS-3 expression higher in DU145. (III) Subclonal distribution of major EMT markers (AHNAK2, LOXL2, S1000A6, TGFB1, TGFBR2, UCHL1, VIM. (IV) ANXA2, ANXA2P2, ANXA3, CD55, CD109) in DU145 versus DUTXR. Pie chart represented majority of EMT markers (LOXL2, TGFB1, UCHL1, VIM, ANXA2P2, CD55, CD109) expressed higher in DUTXR cell line. Results exhibiting EMT marker expression were high (EMT markets nonexpressing cells were low) in the ARLow/mCSPC/NEPCtaxane-resistant prostate cancer cell line (DUTXR). V, Top genes representing single-cell clusters that were shared and which were unique between DU145 and DUTXR. Common and unique DEGs between RNA-seq and scRNA-seq were also identified for all prostate cancer subtypes. Common genes were EMT markers, for example, VIM, AHNAK2, ANXA1, ANXA2, CD109, CD44, CD59, GPRC5A, HAS, S100A6, TGFBR2 (Supplementary Figs. S4 and S5; Supplementary Table S7).
FIGURE 2
FIGURE 2
In silico and in vitro validation of top EMT marker's association with disease progression, patient survival, and disease aggressiveness. A,In silico correlation of EMT signatures using TCGA database: Top EMT marker TGFB1 and taxane resistance marker FSCN1 were associated with DFS of patients with prostate cancer. (I) High expression of FSCN1 was correlated with lower survival compared with the low expression group of patients (P < 0.0001). (II) Higher expression of TGFB1 showed less survival compared with the low expression group of patients (P < 0.0001). B, Assessment of “stem-like” cells (CD44high/CD133high) population in prostate cancer subtypes by Flowcytometry: Assessing of “stem-like” cell population among all prostate cancer subtypes. (I) Baseline (no drug treatment) CD44+ cells were higher in EA-ARLow/mCRPC (PC-3-76.5%, PC-3M-90.0%, DU145-69.0%) compared with EA-ARHigh/mCSPC (LNCaP-5.60%, VCaP-6.69%, 22RV1-4.51%). Taxane-resistant ARLow/mCRPC (DUTXR) cells showed the highest percent of “stem-like” cells (CD44+ cells 96.4%). Furthermore, AA-ARHigh /mCSPC (MDA-PCa-2b) showed higher percent of CD44+ (16.6%) cells compared with EA-ARHigh/mCSPC (LNCaP, VCaP, 22RV1). Whereas in contrast, another AA-ARHigh/mCSPC (RC77T/E) showed low percent CD44+ cells population (5.69%). EA-ARPresent/mCRPC (C4-2B) showed CD44+ cell population (8.50%). (II) and (III) Bar graphs represented a comparison among CD44+ and CD44+/CD133+ cells in all prostate cancer subtypes. (*, P ≤ 0.05). Results represented higher stemlike cell population in ARLow/mCRPC and taxane-resistant mCRPC. C, Immunoblotting: Higher expression of EMT proteins (CD44, ALDH1, Oct-4, TGFβ, Nanog, and Sox2) was observed in ARLow/mCRPC/NEPC (PC-3, PC-3M, DU145) prostate cancer cell lines compared with ARHigh/mCSPC (LNCaP, VCaP, 22RV1) cell lines. Furthermore, higher expression of EMT proteins (CD44, ALDH1, Oct-4, TGFβ, Nanog, and Sox2) was observed in AA-ARHigh/mCSPC (MDA-PCa-2b, RC77T/E) compared with EA-ARHigh/mCSPC (LNCaP, VCaP, 22RV1) prostate cancer cell lines. Highest amount of EMT protein was expressed in taxane-resistant (DUTXR and PC-3TXR) prostate cancer cell lines. Immunoblotting results corroborated with DEGs. Densitometry plots represented a comparison of protein expression among all prostate cancer subtypes. Actin-β was used as a control housekeeping gene to normalize the protein expression of other genes for immunoblotting experiments (*, P ≤ 0.05).
FIGURE 2
FIGURE 2
In silico and in vitro validation of top EMT marker's association with disease progression, patient survival, and disease aggressiveness. A,In silico correlation of EMT signatures using TCGA database: Top EMT marker TGFB1 and taxane resistance marker FSCN1 were associated with DFS of patients with prostate cancer. (I) High expression of FSCN1 was correlated with lower survival compared with the low expression group of patients (P < 0.0001). (II) Higher expression of TGFB1 showed less survival compared with the low expression group of patients (P < 0.0001). B, Assessment of “stem-like” cells (CD44high/CD133high) population in prostate cancer subtypes by Flowcytometry: Assessing of “stem-like” cell population among all prostate cancer subtypes. (I) Baseline (no drug treatment) CD44+ cells were higher in EA-ARLow/mCRPC (PC-3-76.5%, PC-3M-90.0%, DU145-69.0%) compared with EA-ARHigh/mCSPC (LNCaP-5.60%, VCaP-6.69%, 22RV1-4.51%). Taxane-resistant ARLow/mCRPC (DUTXR) cells showed the highest percent of “stem-like” cells (CD44+ cells 96.4%). Furthermore, AA-ARHigh /mCSPC (MDA-PCa-2b) showed higher percent of CD44+ (16.6%) cells compared with EA-ARHigh/mCSPC (LNCaP, VCaP, 22RV1). Whereas in contrast, another AA-ARHigh/mCSPC (RC77T/E) showed low percent CD44+ cells population (5.69%). EA-ARPresent/mCRPC (C4-2B) showed CD44+ cell population (8.50%). (II) and (III) Bar graphs represented a comparison among CD44+ and CD44+/CD133+ cells in all prostate cancer subtypes. (*, P ≤ 0.05). Results represented higher stemlike cell population in ARLow/mCRPC and taxane-resistant mCRPC. C, Immunoblotting: Higher expression of EMT proteins (CD44, ALDH1, Oct-4, TGFβ, Nanog, and Sox2) was observed in ARLow/mCRPC/NEPC (PC-3, PC-3M, DU145) prostate cancer cell lines compared with ARHigh/mCSPC (LNCaP, VCaP, 22RV1) cell lines. Furthermore, higher expression of EMT proteins (CD44, ALDH1, Oct-4, TGFβ, Nanog, and Sox2) was observed in AA-ARHigh/mCSPC (MDA-PCa-2b, RC77T/E) compared with EA-ARHigh/mCSPC (LNCaP, VCaP, 22RV1) prostate cancer cell lines. Highest amount of EMT protein was expressed in taxane-resistant (DUTXR and PC-3TXR) prostate cancer cell lines. Immunoblotting results corroborated with DEGs. Densitometry plots represented a comparison of protein expression among all prostate cancer subtypes. Actin-β was used as a control housekeeping gene to normalize the protein expression of other genes for immunoblotting experiments (*, P ≤ 0.05).
FIGURE 3
FIGURE 3
Metronomic topotecan in combination with DTX showed potency against prostate cancer subtypes, ARLow/mCRPC/NEPC (PC-3, PC-3M, DU145) and ARLow/mCSPC/NEPCtaxane resistant (DUTXR) cells. Cytotoxicity: In vitro effect of metronomic and conventional administration of topotecan on prostate cancer cell lines was assessed. A, MTT assay: Cytotoxicity was measured following 72 hours of CONV-TOPO, CONV-DTX, METRO-TOPO, and the combination of CONV-DTX+METRO-TOPO treatment in PC-3, PC-3M, DU145, DUTXR cell lines using mitochondrial activity [3-(4, 5-Dimethylthiazol-2-yl)-2,5-diphenyltetrazolium bromide] or the MTT assay. In all cell lines, METRO-TOPO (lower dose) reduced cell growth more compared with CONV (high dose) treatment at IC50/2. The greatest reduction in cell growth was observed following CONV-DTX + METRO-TOPO combination treatment in all prostate cancer cell lines tested (*, P ≤ 0.05). B, Apoptosis (caspase 3/7 assay): Levels of caspase 3/7 enzyme (a marker of apoptosis) activities measured followed CONV-TOPO, CONV-DTX, METRO-TOPO, and the combination of CONV-DTX + METRO-TOPO 72 hours treatment. Results showed significant increases in caspase 3/7 activity following each treatment compared with control. Results confirmed significantly greater treatment-induced apoptosis was observed for post-METRO-TOPO treatment compared with CONV-TOPO and DTX. The highest treatment-induced apoptosis was observed in combination with CONV-DTX+METRO-TOPO in all cell lines (*, P ≤ 0.05). C, Microscope images (Cytation5): Cell morphologic study reported micrographs of prostate cancer cells exposed to all dosing regimens showed decreases in cell density compared with control cells. Results showed that METRO-TOPO reduces higher cell density compared with CONV-TOPO and CONV-DTX. Highest cell death observed in CONV-DTX+METRO-TOPO combination treatment compared with CONV-TOPO, CONV-DTX, and METRO-TOPO single-drug treatment (*, P ≤ 0.05).
FIGURE 3
FIGURE 3
Metronomic topotecan in combination with DTX showed potency against prostate cancer subtypes, ARLow/mCRPC/NEPC (PC-3, PC-3M, DU145) and ARLow/mCSPC/NEPCtaxane resistant (DUTXR) cells. Cytotoxicity: In vitro effect of metronomic and conventional administration of topotecan on prostate cancer cell lines was assessed. A, MTT assay: Cytotoxicity was measured following 72 hours of CONV-TOPO, CONV-DTX, METRO-TOPO, and the combination of CONV-DTX+METRO-TOPO treatment in PC-3, PC-3M, DU145, DUTXR cell lines using mitochondrial activity [3-(4, 5-Dimethylthiazol-2-yl)-2,5-diphenyltetrazolium bromide] or the MTT assay. In all cell lines, METRO-TOPO (lower dose) reduced cell growth more compared with CONV (high dose) treatment at IC50/2. The greatest reduction in cell growth was observed following CONV-DTX + METRO-TOPO combination treatment in all prostate cancer cell lines tested (*, P ≤ 0.05). B, Apoptosis (caspase 3/7 assay): Levels of caspase 3/7 enzyme (a marker of apoptosis) activities measured followed CONV-TOPO, CONV-DTX, METRO-TOPO, and the combination of CONV-DTX + METRO-TOPO 72 hours treatment. Results showed significant increases in caspase 3/7 activity following each treatment compared with control. Results confirmed significantly greater treatment-induced apoptosis was observed for post-METRO-TOPO treatment compared with CONV-TOPO and DTX. The highest treatment-induced apoptosis was observed in combination with CONV-DTX+METRO-TOPO in all cell lines (*, P ≤ 0.05). C, Microscope images (Cytation5): Cell morphologic study reported micrographs of prostate cancer cells exposed to all dosing regimens showed decreases in cell density compared with control cells. Results showed that METRO-TOPO reduces higher cell density compared with CONV-TOPO and CONV-DTX. Highest cell death observed in CONV-DTX+METRO-TOPO combination treatment compared with CONV-TOPO, CONV-DTX, and METRO-TOPO single-drug treatment (*, P ≤ 0.05).
FIGURE 4
FIGURE 4
Pretreatment versus posttreatment single-cell transcriptomics and RNA-seq analysis showed extended exposure of metronomic topotecan (EE) downregulates signatures of EMT and taxane-resistant markers in ARLow/mCRPC/NEPC prostate cancer tumor model. scRNA-seq using the droplet sequencing method (10X Genomics) was performed on the tumor model (PC-3; 3D spheroid). Each dot represented a single cell. Doublet cells were not included. A, METRO-TOPO treatment effects on subclonal population distribution of ARLow/mCRPC tumor based on EMT markers: t-SNE plots represented the comparison between the single-cell clusters representing control (no drug treatment), 6-week EE-TOPO (extended exposure metronomic TOPO treatment) and 6-week CONV-TOPO treatment. Single-cell population for each treatment well segregated from each other, because they represented differential scRNA expression profiles. B, TOPO-METRO treatment reduces EMT-specific subclonal population distribution in ARLow/mCRPC tumors: Results exhibited nine subclonal populations (clusters) based on scRNA expression profiling in ARLow/mCRPC tumors. Furthermore, 6 weeks of EE-TOPO (extended exposure) reduced subclonal populations (clusters) from nine to six. Clusters two, four, and nine disappeared after 6 weeks of EE-TOPO (extended exposure) treatment, which includes EMT and drug resistance markers (S100A9, ESRP1, ASPM, EPCAM, CLDN7, CDH1, INPP4B, CD70, FN1, CDH11, SERPINE1, ESM1, TOP2A). C, METRO-TOPO treatment reduces EMT markers in ARLow/mCRPC single-cell subclonal populations: t-SNE plots showing the comparison in single-cell clusters among all treatment groups in ARLow/mCRPC/NEPC (PC-3) tumor model. Top EMT and taxane-resistant marker HAS3 expression was downregulated by 6-week EE-TOPO (extended exposure) 54% to 47%, whereas 6-week CONV-TOPO treatment upregulated 54% to 59%. EMT marker TGFB1 showed the same trend (Supplementary Fig. S5). Furthermore, taxane resistance marker FSCN1 expression increased less after 6-week EE compared with CONV-TOPO treatment (69% to71% for EE-TOPO whereas 69% to 84% for CONV-TOPO). D, METRO-TOPO treatment reduces EMT GE in ARLow/mCRPC tumors (RNA-seq): RNA-sequencing analysis showed reduction (downregulation) of top EMT markers (CD55 and HAS3) by 6-week EE-TOPO compared with CONV-TOPO treatment.
FIGURE 4
FIGURE 4
Pretreatment versus posttreatment single-cell transcriptomics and RNA-seq analysis showed extended exposure of metronomic topotecan (EE) downregulates signatures of EMT and taxane-resistant markers in ARLow/mCRPC/NEPC prostate cancer tumor model. scRNA-seq using the droplet sequencing method (10X Genomics) was performed on the tumor model (PC-3; 3D spheroid). Each dot represented a single cell. Doublet cells were not included. A, METRO-TOPO treatment effects on subclonal population distribution of ARLow/mCRPC tumor based on EMT markers: t-SNE plots represented the comparison between the single-cell clusters representing control (no drug treatment), 6-week EE-TOPO (extended exposure metronomic TOPO treatment) and 6-week CONV-TOPO treatment. Single-cell population for each treatment well segregated from each other, because they represented differential scRNA expression profiles. B, TOPO-METRO treatment reduces EMT-specific subclonal population distribution in ARLow/mCRPC tumors: Results exhibited nine subclonal populations (clusters) based on scRNA expression profiling in ARLow/mCRPC tumors. Furthermore, 6 weeks of EE-TOPO (extended exposure) reduced subclonal populations (clusters) from nine to six. Clusters two, four, and nine disappeared after 6 weeks of EE-TOPO (extended exposure) treatment, which includes EMT and drug resistance markers (S100A9, ESRP1, ASPM, EPCAM, CLDN7, CDH1, INPP4B, CD70, FN1, CDH11, SERPINE1, ESM1, TOP2A). C, METRO-TOPO treatment reduces EMT markers in ARLow/mCRPC single-cell subclonal populations: t-SNE plots showing the comparison in single-cell clusters among all treatment groups in ARLow/mCRPC/NEPC (PC-3) tumor model. Top EMT and taxane-resistant marker HAS3 expression was downregulated by 6-week EE-TOPO (extended exposure) 54% to 47%, whereas 6-week CONV-TOPO treatment upregulated 54% to 59%. EMT marker TGFB1 showed the same trend (Supplementary Fig. S5). Furthermore, taxane resistance marker FSCN1 expression increased less after 6-week EE compared with CONV-TOPO treatment (69% to71% for EE-TOPO whereas 69% to 84% for CONV-TOPO). D, METRO-TOPO treatment reduces EMT GE in ARLow/mCRPC tumors (RNA-seq): RNA-sequencing analysis showed reduction (downregulation) of top EMT markers (CD55 and HAS3) by 6-week EE-TOPO compared with CONV-TOPO treatment.
FIGURE 5
FIGURE 5
Metronomic topotecan treatment as a single agent and in combination with DTX reduces EMT/stemness in ARLow/mCRPC/NEPC clonally derived highly metastatic prostate cancer cell lines. A, Single-cell transcriptomics: Identified differential expression of EMT markers in ARLow/mCRPC/NEPC (PC-3 vs. PC-3M) cells. scRNA-seq using the Droplet sequencing method (10X Genomics) was performed on the prostate cancer cell lines. Each dot represents a single cell. (I) t-SNE plots showing the comparison between the single-cell clusters represented ARLow/mCRPC/NEPC (PC-3 vs. PC-3M) cells. (II) Top EMT transdifferentiation markers in PC-3 and PC-3M, included EZH2, Snail (SNAI1), Slug (SNAI2), TWIST1 genes. SNAI1 and SNAl2 are markers for cell invasion. SNSI1 and SNSI2 increased CD44+ expressing cells in prostate cancer populations. All EMT markers were expressed at higher levels in PC-3M compared with PC-3 cells, which indicated more stemness and cell invasion character for PC-3M cells. B, Assessment of posttreated “stem-like” cells (CD44high/CD133high) population in ARLow/mCRPC cell lines by Flowcytometry: prostate cancer cell lines stained with stemness markers (CD44, CD133, and both CD44/133) after CONV-TOPO, METRO-TOPO, and combination (CONV-DTX+METRO-TOPO) treatment. CONV-TOPO, METRO-TOPO and combination (CONV-DTX+METRO-TOPO) treatment reduces CD44high cells 30.5%, 19.5%, and 5.97%, respectively, in ARLow/mCRPC (PC-3) cell line. Therefore, METRO-TOPO as a single agent and in combination with DTX reduced higher percentages of “stem-like” CD44high cell population compared with CONV-TOPO treatment. Data for PC-3M and DU145 cells are shown in (Supplementary Fig. S6A and S6B; Table 2). C, Baseline ALDH: aldehyde dehydrogenase (ALDH) was assessed using an Aldefluor kit according to the manufacturer's instructions (Stem Cell Technologies).In ARLow/mCRPC/NEPCP prostate cancer cell lines (PC-3 vs. PC-3M), ALDH was marginally higher in PC-3M compared with PC-3, indicating the presence of a “stem-like phenotype.” The ALDH inhibitor DEAB was used as a negative control. The cells without inhibitor shifted to the right were considered ALDH+ cells (right). D, Immunoblot analysis: EMT proteins were significantly downregulated in METRO-TOPO versus CONV-TOPO in ARLow/mCSPC/NEPC (PC-3M) prostate cancer cells. Combination treatment, CONV-DTX+METRO-TOPO exhibited the highest downregulation of EMT proteins compared with other treatments. Posttreatment protein expression downregulation was following orders: CONV-TOPO>CONV-DTX>METRO-TOPO. Beta-actin was used as a control housekeeping gene to normalize the protein expression of other genes (*, P ≤ 0.05). E, PDMS-based microchannel cell migration assay: This assay allows the study of cancer cell invasion into physically restricted spaces. I, Representative images showed that PC-3M cells entered confining microchannels (30 μm2) more effectively compared with PC-3 cells, suggesting that PC-3M cells were more invasive. However, the differential percentage of cell entry into partially confined microchannels (100 μm2) was not statistically significant between PC-3 and PC-3M cells (video). (II) Bar graphs represented the quantification of (I). Figure demonstrated that PC-3M was more invasive compared with PC-3 cells (P < 0.05). (III) Assessed the entry of post-drug exposure PC-3M cells into confining microchannels. Experiments showed that treatment with METRO-TOPO (lower dose) reduced cell invasion more compared with treatment with CONV-TOPO (high dose). Combination (CONV-DTX+METRO-TOPO) treatment showed highest reduction of posttreatment cell invasion compared with other treatments. ANOVA followed by multiple comparisons (**, Bonferroni P ≤ 0.01).
FIGURE 5
FIGURE 5
Metronomic topotecan treatment as a single agent and in combination with DTX reduces EMT/stemness in ARLow/mCRPC/NEPC clonally derived highly metastatic prostate cancer cell lines. A, Single-cell transcriptomics: Identified differential expression of EMT markers in ARLow/mCRPC/NEPC (PC-3 vs. PC-3M) cells. scRNA-seq using the Droplet sequencing method (10X Genomics) was performed on the prostate cancer cell lines. Each dot represents a single cell. (I) t-SNE plots showing the comparison between the single-cell clusters represented ARLow/mCRPC/NEPC (PC-3 vs. PC-3M) cells. (II) Top EMT transdifferentiation markers in PC-3 and PC-3M, included EZH2, Snail (SNAI1), Slug (SNAI2), TWIST1 genes. SNAI1 and SNAl2 are markers for cell invasion. SNSI1 and SNSI2 increased CD44+ expressing cells in prostate cancer populations. All EMT markers were expressed at higher levels in PC-3M compared with PC-3 cells, which indicated more stemness and cell invasion character for PC-3M cells. B, Assessment of posttreated “stem-like” cells (CD44high/CD133high) population in ARLow/mCRPC cell lines by Flowcytometry: prostate cancer cell lines stained with stemness markers (CD44, CD133, and both CD44/133) after CONV-TOPO, METRO-TOPO, and combination (CONV-DTX+METRO-TOPO) treatment. CONV-TOPO, METRO-TOPO and combination (CONV-DTX+METRO-TOPO) treatment reduces CD44high cells 30.5%, 19.5%, and 5.97%, respectively, in ARLow/mCRPC (PC-3) cell line. Therefore, METRO-TOPO as a single agent and in combination with DTX reduced higher percentages of “stem-like” CD44high cell population compared with CONV-TOPO treatment. Data for PC-3M and DU145 cells are shown in (Supplementary Fig. S6A and S6B; Table 2). C, Baseline ALDH: aldehyde dehydrogenase (ALDH) was assessed using an Aldefluor kit according to the manufacturer's instructions (Stem Cell Technologies).In ARLow/mCRPC/NEPCP prostate cancer cell lines (PC-3 vs. PC-3M), ALDH was marginally higher in PC-3M compared with PC-3, indicating the presence of a “stem-like phenotype.” The ALDH inhibitor DEAB was used as a negative control. The cells without inhibitor shifted to the right were considered ALDH+ cells (right). D, Immunoblot analysis: EMT proteins were significantly downregulated in METRO-TOPO versus CONV-TOPO in ARLow/mCSPC/NEPC (PC-3M) prostate cancer cells. Combination treatment, CONV-DTX+METRO-TOPO exhibited the highest downregulation of EMT proteins compared with other treatments. Posttreatment protein expression downregulation was following orders: CONV-TOPO>CONV-DTX>METRO-TOPO. Beta-actin was used as a control housekeeping gene to normalize the protein expression of other genes (*, P ≤ 0.05). E, PDMS-based microchannel cell migration assay: This assay allows the study of cancer cell invasion into physically restricted spaces. I, Representative images showed that PC-3M cells entered confining microchannels (30 μm2) more effectively compared with PC-3 cells, suggesting that PC-3M cells were more invasive. However, the differential percentage of cell entry into partially confined microchannels (100 μm2) was not statistically significant between PC-3 and PC-3M cells (video). (II) Bar graphs represented the quantification of (I). Figure demonstrated that PC-3M was more invasive compared with PC-3 cells (P < 0.05). (III) Assessed the entry of post-drug exposure PC-3M cells into confining microchannels. Experiments showed that treatment with METRO-TOPO (lower dose) reduced cell invasion more compared with treatment with CONV-TOPO (high dose). Combination (CONV-DTX+METRO-TOPO) treatment showed highest reduction of posttreatment cell invasion compared with other treatments. ANOVA followed by multiple comparisons (**, Bonferroni P ≤ 0.01).
FIGURE 6
FIGURE 6
Metronomic topotecan treatment as a single agent and in combination with DTX reduces EMT/stemness in ARLow/mCRPC/NEPC clonally derived taxane-resistant prostate cancer subtypes. A, Assessment of posttreated “stem-like” cells (CD44high/CD133high) population in taxane-resistant ARLow/mCRPC cell lines by Flow cytometry: DUTXR cells line stained with stemness markers (CD44, CD33, and both CD44/133) after CONV-TOPO, METRO-TOPO, and combination (CONV-DTX+METRO-TOPO) treatments. CONV-TOPO, METRO-TOPO, and combination (CONV-DTX+METRO-TOPO) treatments reduced CD44high cells 81.0%, 71.5%, and 63.4%, respectively, in taxane-resistant ARLow mCRPC DUTXR cells. Therefore, METRO-TOPO as single agent and in combination treatment reduced the highest percentage of “stem like” cell population load (P < 0.05; Table 2). B, Colony-forming assay: Number and size of colonies were reduced after all treatments compared with control (no-drug treatment). Next, combination treatment with CONV-DTX+METRO-TOPO reduced the number and size of colonies the greatest compared with CONV-TOPO, CONV-DTX, and METRO-TOPO treatments in the DUTXR cell line. Posttreatment colony number and size reduction in the following order: CONV-TOPO>CONV-DTX>METRO-TOPO>Combination (METRO-TOPO+CONV-DTX). Therefore, METRO-TOPO as a single agent or in combination reduced highest number of the colony and size compared with other treatments. Colonies were developed for 21 days (*, P ≤ 0.05). C, Immunoblot analysis: Proteins representing top EMT markers were downregulated significantly after METRO-TOPO treatment compared with CONV-TOPO treatment in ARLow/mCSPC/NEPCtaxane-resistant (DUTXR) prostate cancer cell lines. Combination treatment (CONV-DTX+METRO-TOPO) exhibited the highest downregulation of EMT marker proteins compared with other treatments. Posttreatment protein expression downregulation was following orders: CONV-TOPO>CONV-DTX>METRO-TOPO. Beta-actin was used as a control housekeeping gene (*, P ≤ 0.05). D, Assessment of treatment effect on “stem-like” cells (CD44high) population in taxane-resistant ARLow/mCRPC cell lines by FACS: DUTXR cell line stained with stemness markers (CD44) and sorted CD44+ versus CD44 cells, followed by CONV-TOPO, METRO-TOPO, CONV-DTX, and combination (CONV-DTX+METRO-TOPO) treatments. Next, cell cytotoxicity (MTT) and caspase 3/7 activity (apoptosis) were assessed. (I) Cytotoxicity profiling by MTT showed that combination (CONV-DTX+METRO-TOPO) treatment reduced highest cell survival or cell growth compared with other treatments. Posttreatment cell survival or cell growth reduction was following orders: CONV-TOPO>CONV-DTX>METRO-TOPO. (II) Combination (CONV-DTX+METRO-TOPO) treatment induced greater apoptosis compared with other treatments in taxane-resistant ARLow/mCRPC-DUTXR cell lines. (III and IV) CD44 cells showed no significant differences for all treatments (*, P ≤ 0.05). E, Pretreatment and posttreatment microscope imaging: Results showed significantly higher cell death in METRO-TOPO and combination (CONV-DTX+METRO-TOPO) treatments compared with CONV treatment for both the drugs (TOPO and DTX). Images were captured by Cytation5 Cell Imaging Multimode Reader at a 1,000 μm scale. ImageJ analysis showed a significant difference in cell density for CONV versus METRO versus combination TOPO treatments (*, P ≤ 0.05).
FIGURE 6
FIGURE 6
Metronomic topotecan treatment as a single agent and in combination with DTX reduces EMT/stemness in ARLow/mCRPC/NEPC clonally derived taxane-resistant prostate cancer subtypes. A, Assessment of posttreated “stem-like” cells (CD44high/CD133high) population in taxane-resistant ARLow/mCRPC cell lines by Flow cytometry: DUTXR cells line stained with stemness markers (CD44, CD33, and both CD44/133) after CONV-TOPO, METRO-TOPO, and combination (CONV-DTX+METRO-TOPO) treatments. CONV-TOPO, METRO-TOPO, and combination (CONV-DTX+METRO-TOPO) treatments reduced CD44high cells 81.0%, 71.5%, and 63.4%, respectively, in taxane-resistant ARLow mCRPC DUTXR cells. Therefore, METRO-TOPO as single agent and in combination treatment reduced the highest percentage of “stem like” cell population load (P < 0.05; Table 2). B, Colony-forming assay: Number and size of colonies were reduced after all treatments compared with control (no-drug treatment). Next, combination treatment with CONV-DTX+METRO-TOPO reduced the number and size of colonies the greatest compared with CONV-TOPO, CONV-DTX, and METRO-TOPO treatments in the DUTXR cell line. Posttreatment colony number and size reduction in the following order: CONV-TOPO>CONV-DTX>METRO-TOPO>Combination (METRO-TOPO+CONV-DTX). Therefore, METRO-TOPO as a single agent or in combination reduced highest number of the colony and size compared with other treatments. Colonies were developed for 21 days (*, P ≤ 0.05). C, Immunoblot analysis: Proteins representing top EMT markers were downregulated significantly after METRO-TOPO treatment compared with CONV-TOPO treatment in ARLow/mCSPC/NEPCtaxane-resistant (DUTXR) prostate cancer cell lines. Combination treatment (CONV-DTX+METRO-TOPO) exhibited the highest downregulation of EMT marker proteins compared with other treatments. Posttreatment protein expression downregulation was following orders: CONV-TOPO>CONV-DTX>METRO-TOPO. Beta-actin was used as a control housekeeping gene (*, P ≤ 0.05). D, Assessment of treatment effect on “stem-like” cells (CD44high) population in taxane-resistant ARLow/mCRPC cell lines by FACS: DUTXR cell line stained with stemness markers (CD44) and sorted CD44+ versus CD44 cells, followed by CONV-TOPO, METRO-TOPO, CONV-DTX, and combination (CONV-DTX+METRO-TOPO) treatments. Next, cell cytotoxicity (MTT) and caspase 3/7 activity (apoptosis) were assessed. (I) Cytotoxicity profiling by MTT showed that combination (CONV-DTX+METRO-TOPO) treatment reduced highest cell survival or cell growth compared with other treatments. Posttreatment cell survival or cell growth reduction was following orders: CONV-TOPO>CONV-DTX>METRO-TOPO. (II) Combination (CONV-DTX+METRO-TOPO) treatment induced greater apoptosis compared with other treatments in taxane-resistant ARLow/mCRPC-DUTXR cell lines. (III and IV) CD44 cells showed no significant differences for all treatments (*, P ≤ 0.05). E, Pretreatment and posttreatment microscope imaging: Results showed significantly higher cell death in METRO-TOPO and combination (CONV-DTX+METRO-TOPO) treatments compared with CONV treatment for both the drugs (TOPO and DTX). Images were captured by Cytation5 Cell Imaging Multimode Reader at a 1,000 μm scale. ImageJ analysis showed a significant difference in cell density for CONV versus METRO versus combination TOPO treatments (*, P ≤ 0.05).

Similar articles

Cited by

References

    1. Wen S, Niu Y, Lee SO, Chang C. Androgen receptor (AR) positive vs negative roles in prostate cancer cell deaths including apoptosis, anoikis, entosis, necrosis and autophagic cell death. Cancer Treat Rev 2014;40:31–40. - PMC - PubMed
    1. Magnan S, Zarychanski R, Pilote L, Bernier L, Shemilt M, Vigneault E, et al. . Intermittent vs continuous androgen deprivation therapy for prostate cancer: a systematic review and meta-analysis. JAMA Oncol 2015;1:1261–9. - PubMed
    1. Hamdy FC, Donovan JL, Lane JA, Mason M, Metcalfe C, Holding P, et al. . 10-year outcomes after monitoring, surgery, or radiotherapy for localized prostate cancer. N Engl J Med 2016;375:1415–24. - PubMed
    1. Scher HI, Solo K, Valant J, Todd MB, Mehra M. Prevalence of prostate cancer clinical states and mortality in the United States: estimates using a dynamic progression model. PLoS One 2015;10:e0139440. - PMC - PubMed
    1. Yadav SS, Li J, Stockert JA, Herzog B, O'Connor J, Garzon-Manco L, et al. . Induction of neuroendocrine differentiation in prostate cancer cells by dovitinib (TKI-258) and its therapeutic implications. Transl Oncol 2017;10:357–66. - PMC - PubMed