. 2023 Jul 5:14:1202521.
doi: 10.3389/fpls.2023.1202521. eCollection 2023.

Comparative transcriptomics reveals the role of altered energy metabolism in the establishment of single-cell C4 photosynthesis in Bienertia sinuspersici

Affiliations

Comparative transcriptomics reveals the role of altered energy metabolism in the establishment of single-cell C4 photosynthesis in Bienertia sinuspersici

Sang-Yun Han et al. Front Plant Sci. .

Abstract

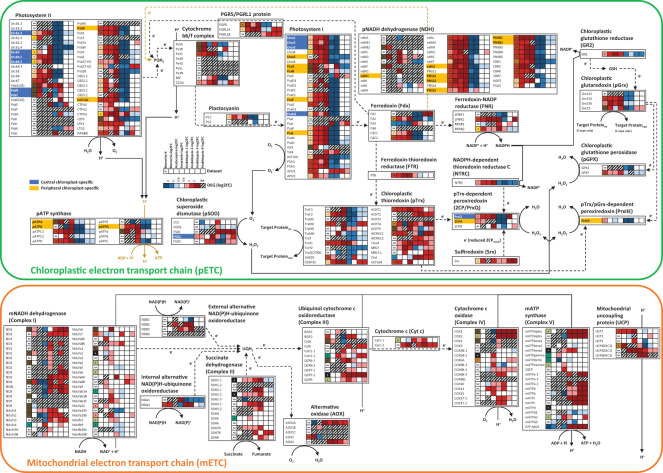
Single-cell C4 photosynthesis (SCC4) in terrestrial plants without Kranz anatomy involves three steps: initial CO2 fixation in the cytosol, CO2 release in mitochondria, and a second CO2 fixation in central chloroplasts. Here, we investigated how the large number of mechanisms underlying these processes, which occur in three different compartments, are orchestrated in a coordinated manner to establish the C4 pathway in Bienertia sinuspersici, a SCC4 plant. Leaves were subjected to transcriptome analysis at three different developmental stages. Functional enrichment analysis revealed that SCC4 cycle genes are coexpressed with genes regulating cyclic electron flow and amino/organic acid metabolism, two key processes required for the production of energy molecules in C3 plants. Comparative gene expression profiling of B. sinuspersici and three other species (Suaeda aralocaspica, Amaranthus hypochondriacus, and Arabidopsis thaliana) showed that the direction of metabolic flux was determined via an alteration in energy supply in peripheral chloroplasts and mitochondria via regulation of gene expression in the direction of the C4 cycle. Based on these results, we propose that the redox homeostasis of energy molecules via energy metabolism regulation is key to the establishment of the SCC4 pathway in B. sinuspersici.

Keywords: Amaranthus hypochondriacus; Bienertia sinuspersici; Suaeda aralocaspica; dimorphic chloroplast; malate valve; mitochondria; single-cell C4 photosynthesis; transcriptome.


Conflict of interest statement

The authors declare that the research was conducted in the absence of any commercial or financial relationships that could be construed as a potential conflict of interest.

Figures

Figure 1
Figure 1
Transcriptional profiling of Bienertia leaf samples at three different developmental stages. (A) Benchmarking Universal Single-Copy Orthologs (BUSCO) transcriptome scores of Bienertia along with those of three comparative species, Arabidopsis thaliana (C3 type), Amaranthus hypochondriacus (NAD-ME/Kranz-C4 type), and Suaeda aralocaspica (NAD-ME/SCC4 type). (B) Classical multidimensional scaling (cMDS) plot. (C) Heatmap of differentially expressed genes (DEG) obtained by min-max normalized TPMTMM (blue [0, min] and red [1, max], respectively), dendrogram (trees), and K-means clustering data (colored bars). X-axis represents three biological replicates of RNA-seq samples taken from different stages of leaf development: Young leaf (BsY1, BsY2, BsY3), Intermediate leaf (BsI1, BsI2, BsI3), and Mature leaf (BsM1, BsM2, BsM3). Y-axis represents genes to visualize the variations in gene expression across different stages of leaf development. (D) Log2-transformed expression levels of genes in K-means clusters, with the gene number and mean-centered graph marked by colors assigned to each cluster. (E) Relative gene expression levels by qRT-PCR (n = 3, mean ± S.D.). The expression level was calculated by the 2−ΔΔCt method. One-tailed Student’s T-tests were performed to determine significant differences between groups (Young vs. Intermediate or Young vs. Mature), and significance was denoted by asterisks (*p < 0.05; **p < 0.01; ***p < 0.001; ****p < 0.0001; ns, not significant). Gene abbreviations: PPDK (BS50819_c1_g1_i1), PEPC1 (BS15679_c0_g1_i1), NAD-ME2 (BS38916_c0_g1_i1), CAb1 (BS301_c2_g1_i2), CAb2 (BS7750_c0_g1_i10), ASP-AT1 (BS6226_c0_g1_i3), ASP-AT2 (BS1932_c0_g1_i7), cMDH1 (BS95047_c2_g1_i1), mMDH2 (BS6222_c0_g1_i2), DTC (BS12288_c0_g1_i2), UCP1 (BS2112_c0_g1_i4), TPT (BS25442_c1_g1_i1).
Figure 2
Figure 2
Functional enrichment analysis of DEGs using Metascape. (A) Heatmap of all statistically enriched functional categories (GO terms and KEGG/WP pathways) with hierarchical clustering (Group I to VIII). Accumulative hypergeometric p-values (-log10[P]) were used for filtering, and the remaining significant functional categories were hierarchically clustered into a tree, based on kappa similarity (κ). The κ value of 0.3 was applied as the threshold to cast the tree into category clusters. Red arrow indicates the ‘C4-dicarboxylic acid cycle, NAD-malic enzyme type’ (M00171) pathway. (B) GO/KEGG/WP semantic network marked by K-means clusters. Color ratio in each circular sector represents K-means cluster of genes within functional category (node). Purple lines (edges) indicate κ > 0.3 between nodes, and thickness of edges indicates the strength of the relationship between functional categories.
Figure 3
Figure 3
Heatmap of Bienertia genes exhibiting (A) single-cell C4-specific expression, (B) NAD-ME type C4 metabolic enzymes, and (C) NAD-ME type C4 metabolic transporters. Change in gene expression levels (left) is represented by log2 fold change (Log2FC). Red and blue colors indicate upregulated and downregulated genes, respectively. The significance of Log2FC (middle; yellow) is represented by FDR< 0.05 (EdgeR) or q > 0.8 (NOISeq). Purple color (right) indicates the gene expression level (avgTPMTMM). Gray color represents no data (NA). X-axis represents K-means clusters (K) or Log2FC of samples: Bienertia (Bienertia sinuspersici, Young vs Mature), Aralocaspica (Suaeda aralocaspica, Young vs Mature), Amaranth (Amaranthus hypochondriacus, Young vs Mature), Arabidopsis-1 (Arabidopsis thaliana, Young vs Mature, CT-aCT), Arabidopsis-2 (Arabidopsis thaliana, Young vs Mature, CTSAM-SCLF), Arabidopsis-3 (Arabidopsis thaliana, Non-stress vs Stress, RC-RH), Arabidopsis-4 (Arabidopsis thaliana, Non-stress vs Stress, RC-RSH). Y-axis represents gene names or Araport11 identifiers. Detailed information of abbreviations is provided in Dataset S3 and S4 .
Figure 4
Figure 4
Model depicting central carbon metabolism in Bienertia marked by K-means cluster, transcript abundance, and reversible/irreversible enzyme bioinformatic information. The most probable unigene is selected for the representative metabolic pathway model. Detailed information of abbreviations is provided in Dataset S6 .
Figure 5
Figure 5
The electron transport chain pathway of chloroplasts and mitochondria in Bienertia. Solid lines, metabolic flows; dotted lines, electron flows; blue color, central chloroplast (CC)-specific localization; yellow color, peripheral chloroplast (PC)-specific localization. Upregulated and downregulated genes are marked in red and blue, respectively, based on the Log2FC data. No data (NA) is indicated in gray. X-axis of the heatmap represents K-means clusters (K) or Log2FC of samples: Bienertia (Bienertia sinuspersici, Young vs Mature), Aralocaspica (Suaeda aralocaspica, Young vs Mature), Amaranth (Amaranthus hypochondriacus, Young vs Mature), Arabidopsis-1 (Arabidopsis thaliana, Young vs Mature, CT-aCT), Arabidopsis-2 (Arabidopsis thaliana, Young vs Mature, CTSAM-SCLF), Arabidopsis-3 (Arabidopsis thaliana, Non-stress vs Stress, RC-RH), Arabidopsis-4 (Arabidopsis thaliana, Non-stress vs Stress, RC-RSH); Y-axis of the heatmap represents genes. The details of abbreviations are provided in Dataset S7 .
Figure 6
Figure 6
Model depicting establishment of single-cell C4 (SCC4) cycle in Bienertia. (A) C3 photosynthesis when CBB cycle and TCA cycle are operated by chloroplastic NADPH and mitochondrial NAD+, respectively. (B) Hypothetical transient state in photosynthesis by altered energy metabolism: electron flow change of pETC by disassembly of LHCII-PSII supercomplex and deactivated mETC. (C) Metabolic direction of SCC4 cycle (red arrows) established by supplies of peripheral chloroplastic ATP from CEF and mitochondrial NADH from photorespiratory GCS. CBB cycle (Calvin-Benson-Bassham cycle), TCA cycle (Tricarboxylic acid cycle), LHCII (Light harvesting complex II), PSII (Photosystem II core complex), LEF-pETC (Linear electron flow of chloroplastic electron transport chain [Photosystem]), CEF-pETC (Cyclic electron flow of chloroplastic electron transport chain [Photosystem]), mETC (Mitochondrial electron transport chain [Oxidative phosphorylation]), GCS (Glycine cleavage system), STN7 (Serine/threonine-protein kinase 7), PsbS (Photosystem II 22 kDa protein), APE1 (Acclimation of photosynthesis to environment 1), PEP (Phosphoenolpyruvate), Pyr (Pyruvate), Asp (Aspartate), OAA (Oxaloacetate), Mal (malate), NADPH (Reduced form of nicotinamide adenine dinucleotide phosphate), NADP+ (Oxidized form of nicotinamide adenine dinucleotide phosphate), NADH (Reduced form of nicotinamide adenine dinucleotide), NAD+ (Oxidized form of nicotinamide adenine dinucleotide), ATP (Adenosine triphosphate), ADP (Adenosine diphosphate), CO2 (Carbon dioxide).

Similar articles

Cited by

References

    1. Andrews S. (2010). “FastQC: a quality control tool for high throughput sequence data,” in Babraham bioinformatics (United Kingdom: Babraham Institute, Cambridge; ). Available at: https://www.bioinformatics.babraham.ac.uk/projects/fastqc/.
    1. Aubry S., Brown N. J., Hibberd J. M. (2011). The role of proteins in C(3) plants prior to their recruitment into the C(4) pathway. J. Exp. Bot. 62 (9), 3049–3059. doi: 10.1093/jxb/err012 - DOI - PubMed
    1. Bakkali M., Martin-Blazquez R., Ruiz-Estevez M., Garrido-Ramos M. A. (2021). De Novo sporophyte transcriptome assembly and functional annotation in the endangered fern species vandenboschia speciosa (Willd.) g. kunkel. Genes (Basel) 12 (7):1017. doi: 10.3390/genes12071017 - DOI - PMC - PubMed
    1. Bandehagh A., Taylor N. L. (2020). Can alternative metabolic pathways and shunts overcome salinity induced inhibition of central carbon metabolism in crops? Front. Plant Sci. 11. doi: 10.3389/fpls.2020.01072 - DOI - PMC - PubMed
    1. Bansal P., Morgat A., Axelsen K. B., Muthukrishnan V., Coudert E., Aimo L., et al. . (2022). Rhea, the reaction knowledgebase in 2022. Nucleic Acids Res. 50 (D1), D693–D700. doi: 10.1093/nar/gkab1016 - DOI - PMC - PubMed