

Genome-wide genotyping data renew knowledge on genetic diversity of a worldwide alfalfa collection and give insights on genetic control of phenology traits
- PMID: 37476178
- PMCID: PMC10354441
- DOI: 10.3389/fpls.2023.1196134
Genome-wide genotyping data renew knowledge on genetic diversity of a worldwide alfalfa collection and give insights on genetic control of phenology traits
Abstract
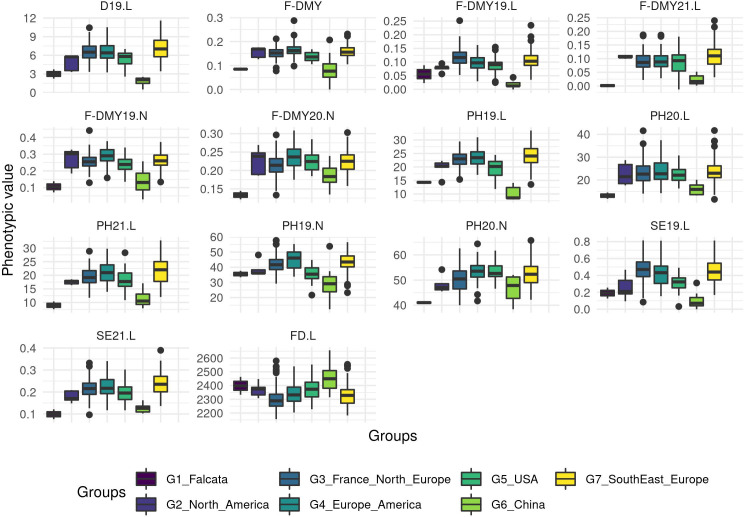
China's and Europe's dependence on imported protein is a threat to the food self-sufficiency of these regions. It could be solved by growing more legumes, including alfalfa that is the highest protein producer under temperate climate. To create productive and high-value varieties, the use of large genetic diversity combined with genomic evaluation could improve current breeding programs. To study alfalfa diversity, we have used a set of 395 alfalfa accessions (i.e. populations), mainly from Europe, North and South America and China, with fall dormancy ranging from 3 to 7 on a scale of 11. Five breeders provided materials (617 accessions) that were compared to the 400 accessions. All accessions were genotyped using Genotyping-by-Sequencing (GBS) to obtain SNP allele frequency. These genomic data were used to describe genetic diversity and identify genetic groups. The accessions were phenotyped for phenology traits (fall dormancy and flowering date) at two locations (Lusignan in France, Novi Sad in Serbia) from 2018 to 2021. The QTL were detected by a Multi-Locus Mixed Model (mlmm). Subsequently, the quality of the genomic prediction for each trait was assessed. Cross-validation was used to assess the quality of prediction by testing GBLUP, Bayesian Ridge Regression (BRR), and Bayesian Lasso methods. A genetic structure with seven groups was found. Most of these groups were related to the geographical origin of the accessions and showed that European and American material is genetically distinct from Chinese material. Several QTL associated with fall dormancy were found and most of these were linked to genes. In our study, the infinitesimal methods showed a higher prediction quality than the Bayesian Lasso, and the genomic prediction achieved high (>0.75) predicting abilities in some cases. Our results are encouraging for alfalfa breeding by showing that it is possible to achieve high genomic prediction quality.
Keywords: GWAS; alfalfa; genetic diversity; genomic prediction; phenology.
Copyright © 2023 Pégard, Barre, Delaunay, Surault, Karagić, Milić, Zorić, Ruttink and Julier.
Conflict of interest statement
The authors declare that the research was conducted in the absence of any commercial or financial relationships that could be construed as a potential conflict of interest.
Figures


Similar articles
-
Genetic diversity, population structure, and genome-wide association study for the flowering trait in a diverse panel of 428 moth bean (Vigna aconitifolia) accessions using genotyping by sequencing.BMC Plant Biol. 2023 Apr 29;23(1):228. doi: 10.1186/s12870-023-04215-w. BMC Plant Biol. 2023. PMID: 37120525 Free PMC article.
-
Genome-wide association mapping and genomic prediction of agronomical traits and breeding values in Iranian wheat under rain-fed and well-watered conditions.BMC Genomics. 2022 Dec 15;23(1):831. doi: 10.1186/s12864-022-08968-w. BMC Genomics. 2022. PMID: 36522726 Free PMC article.
-
QTL mapping of flowering time and biomass yield in tetraploid alfalfa (Medicago sativa L.).BMC Plant Biol. 2019 Aug 16;19(1):359. doi: 10.1186/s12870-019-1946-0. BMC Plant Biol. 2019. PMID: 31419945 Free PMC article.
-
Genomic Prediction for 25 Agronomic and Quality Traits in Alfalfa (Medicago sativa).Front Plant Sci. 2018 Aug 20;9:1220. doi: 10.3389/fpls.2018.01220. eCollection 2018. Front Plant Sci. 2018. PMID: 30177947 Free PMC article.
-
Strategies to Increase Prediction Accuracy in Genomic Selection of Complex Traits in Alfalfa (Medicago sativa L.).Cells. 2021 Nov 30;10(12):3372. doi: 10.3390/cells10123372. Cells. 2021. PMID: 34943880 Free PMC article. Review.
Cited by
-
Optimization of high-throughput marker systems for genomic prediction in alfalfa family bulks.Plant Genome. 2025 Mar;18(1):e20526. doi: 10.1002/tpg2.20526. Epub 2024 Dec 5. Plant Genome. 2025. PMID: 39635923 Free PMC article.
-
Assessment of Genetic Diversity in Alfalfa Using DNA Polymorphism Analysis and Statistical Tools.Plants (Basel). 2024 Oct 11;13(20):2853. doi: 10.3390/plants13202853. Plants (Basel). 2024. PMID: 39458800 Free PMC article.
-
Including marker x environment interactions improves genomic prediction in red clover (Trifolium pratense L.).Front Plant Sci. 2024 Jun 10;15:1407609. doi: 10.3389/fpls.2024.1407609. eCollection 2024. Front Plant Sci. 2024. PMID: 38916032 Free PMC article.
-
Pre-breeding in alfalfa germplasm develops highly differentiated populations, as revealed by genome-wide microhaplotype markers.Sci Rep. 2025 Jan 8;15(1):1253. doi: 10.1038/s41598-024-84262-x. Sci Rep. 2025. PMID: 39779777 Free PMC article.
-
QTL detection and genomic prediction for resistance to anthracnose in alfalfa (Medicago sativa).Plant Genome. 2025 Sep;18(3):e70085. doi: 10.1002/tpg2.70085. Plant Genome. 2025. PMID: 40765523 Free PMC article.
References
-
- Adhikari L., Lindstrom O. M., Markham J., Missaoui A. M. (2018)QTLs associated with fall dormancy & winter-hardiness in alfalfa shows potential for independent improvement of the two traits. In: ASA-CSSA-SSSA. Available at: https://scisoc.confex.com/scisoc/2018am/meetingapp.cgi/Paper/112970 (Accessed 26, 2022).
-
- Akaike H. (1974). A new look at the statistical model identification. IEEE transactions on automatic control. 19 (6), 716–723.
LinkOut - more resources
Full Text Sources