. 2023 Jun 12;14(10):1707-1724.
doi: 10.7150/jca.84215. eCollection 2023.

High Expression of Microtubule-associated Protein TBCB Predicts Adverse Outcome and Immunosuppression in Acute Myeloid Leukemia

Affiliations

High Expression of Microtubule-associated Protein TBCB Predicts Adverse Outcome and Immunosuppression in Acute Myeloid Leukemia

Bichen Wang et al. J Cancer. .

Abstract

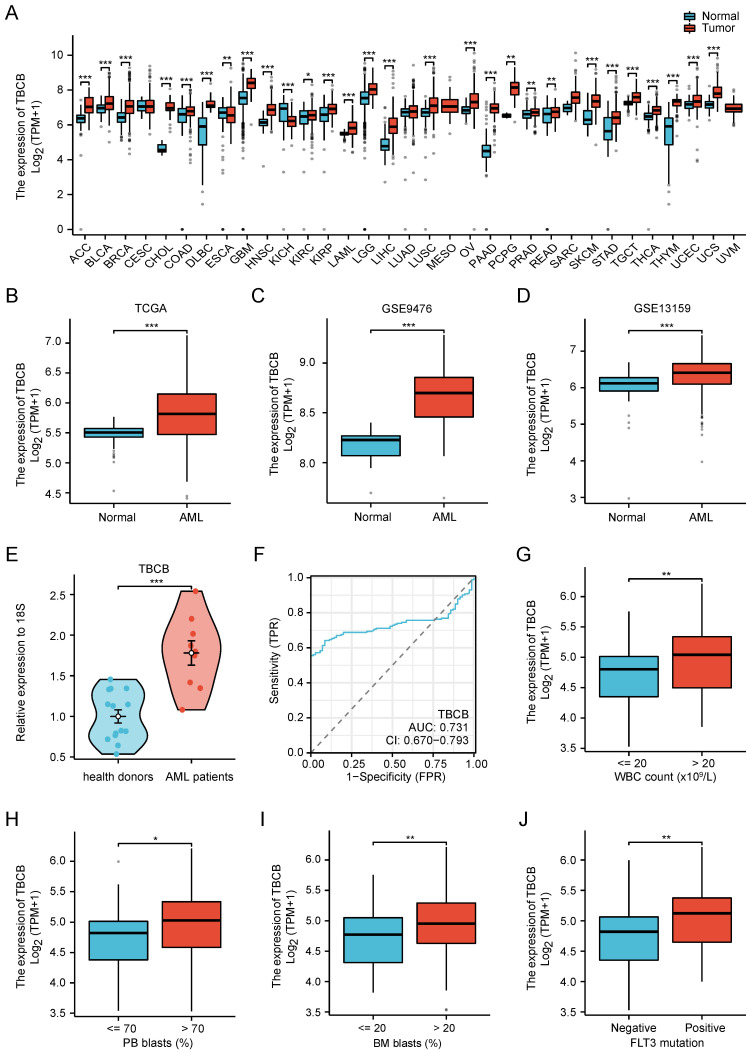
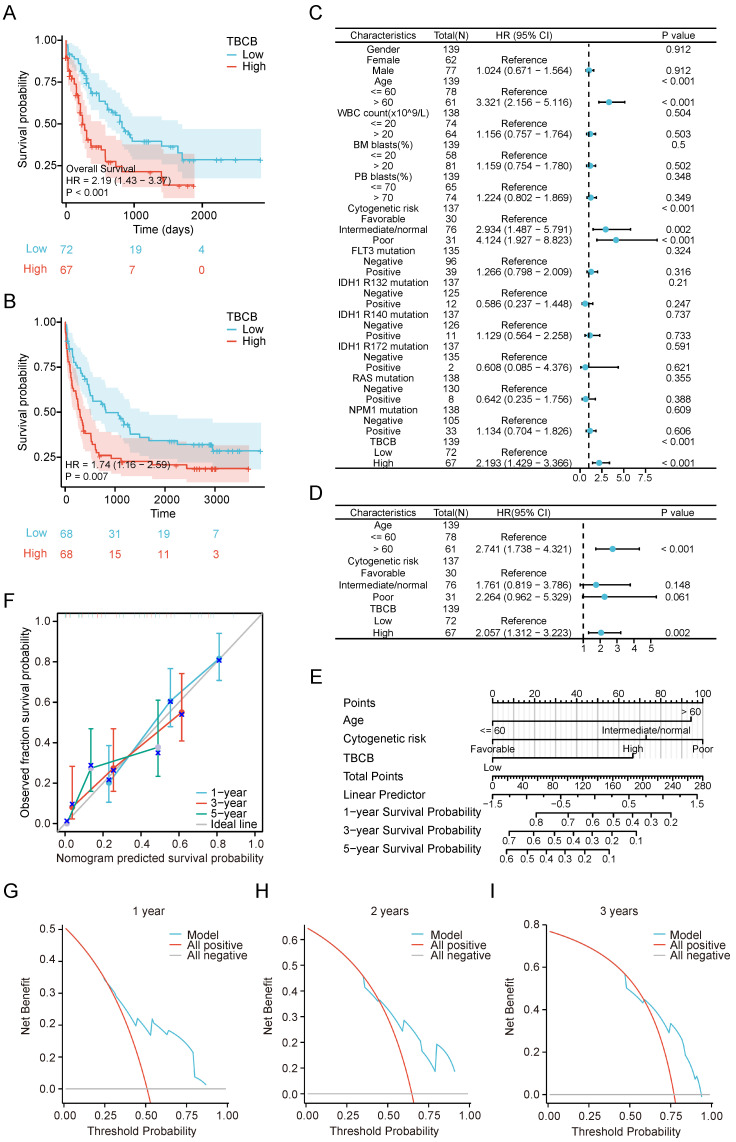
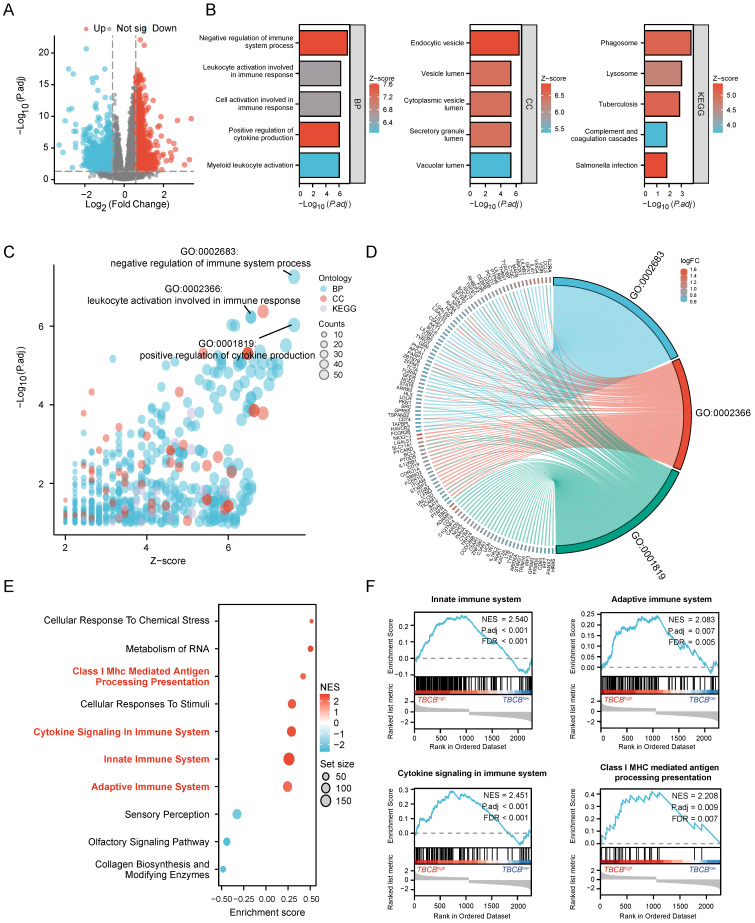
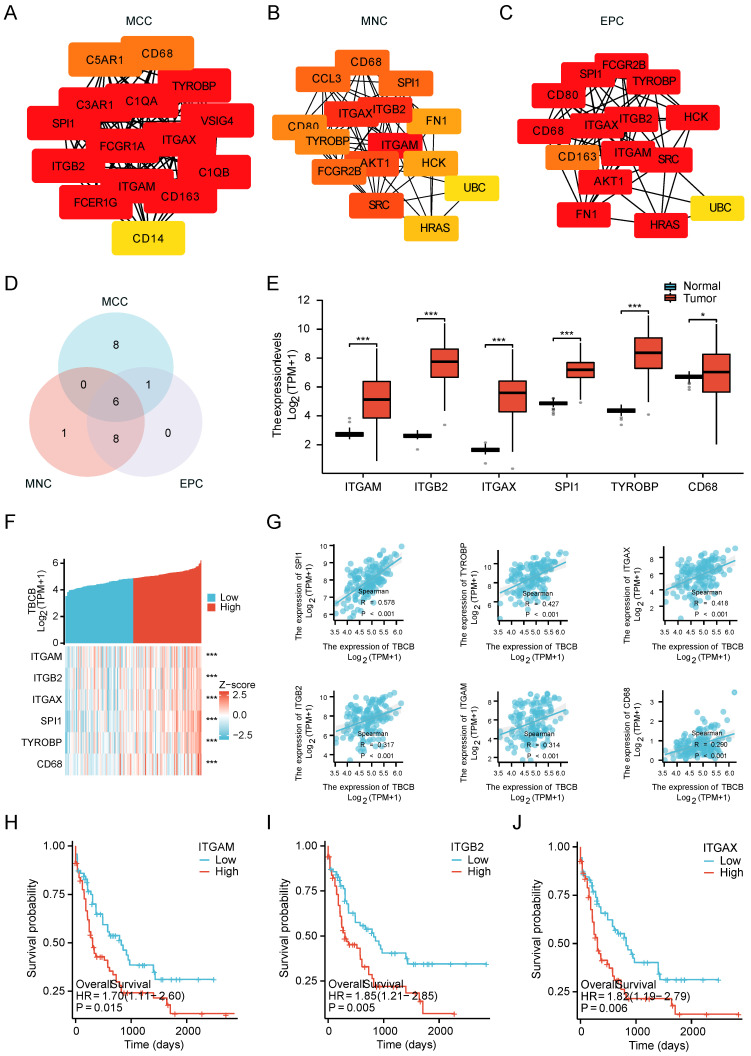
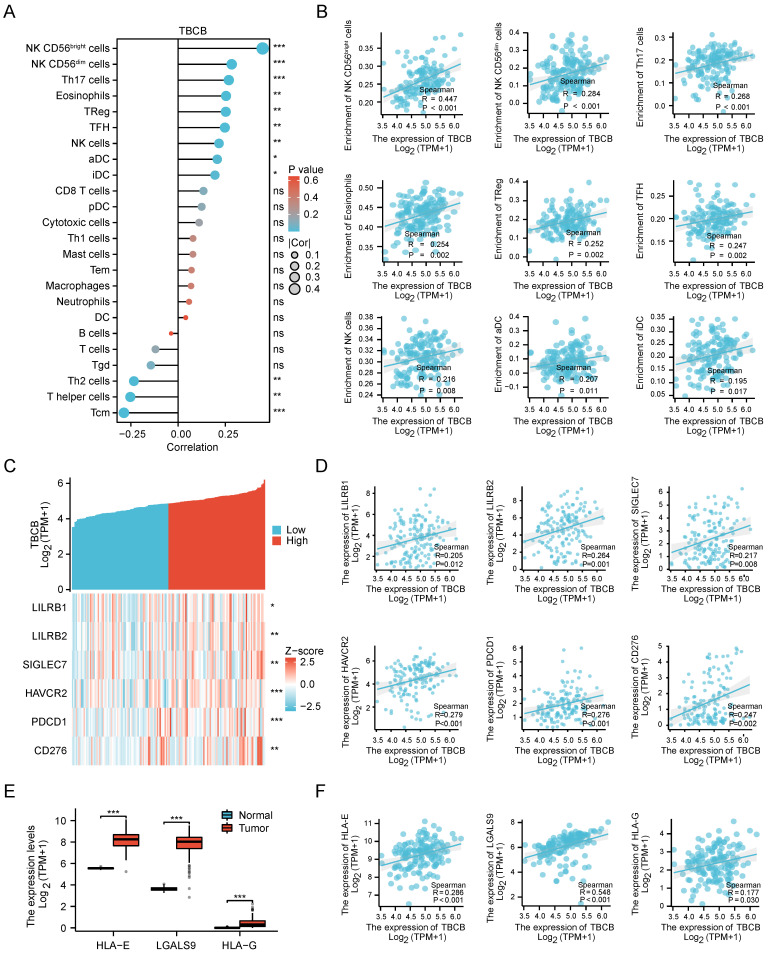
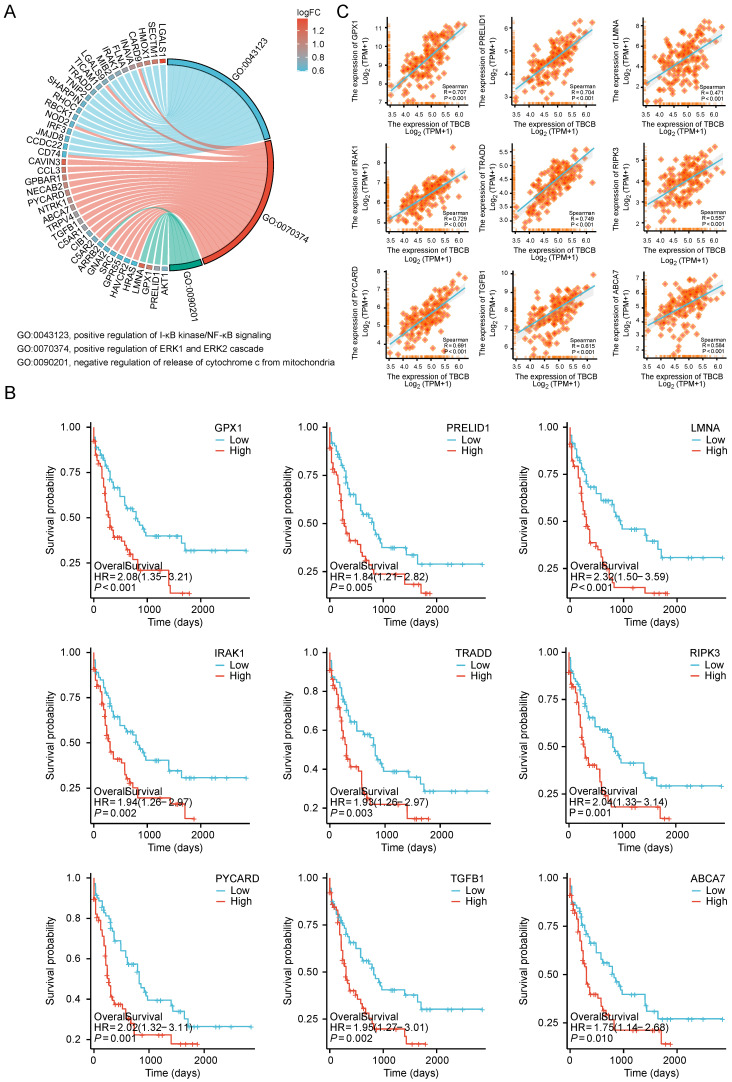
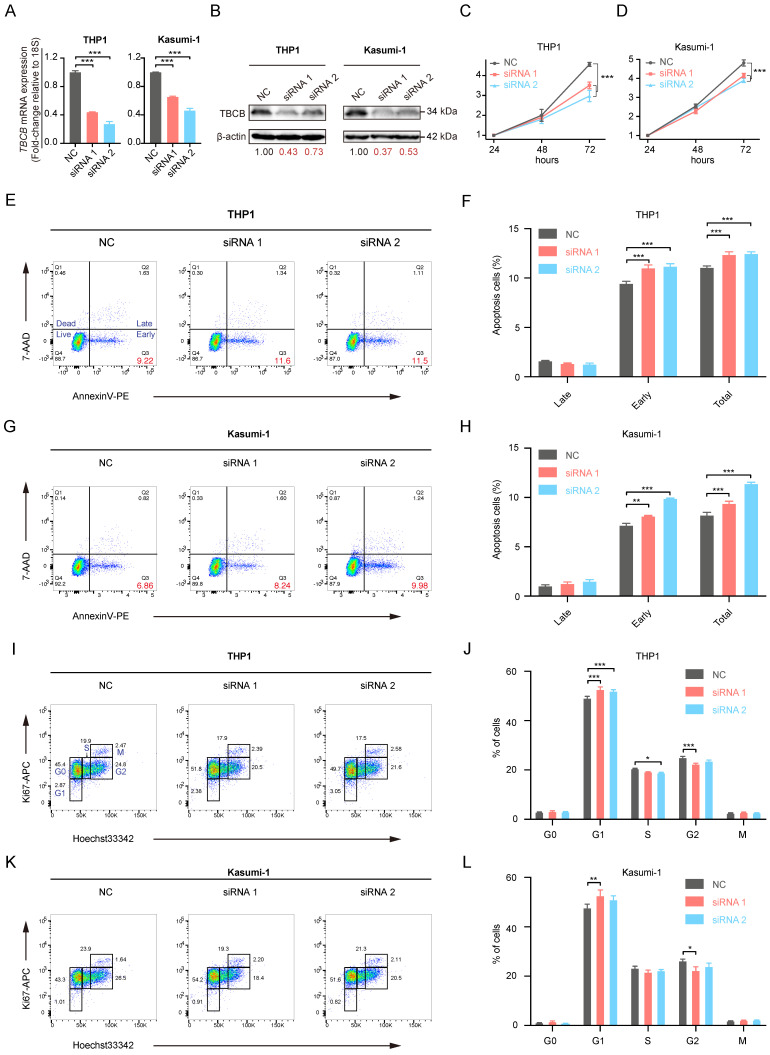
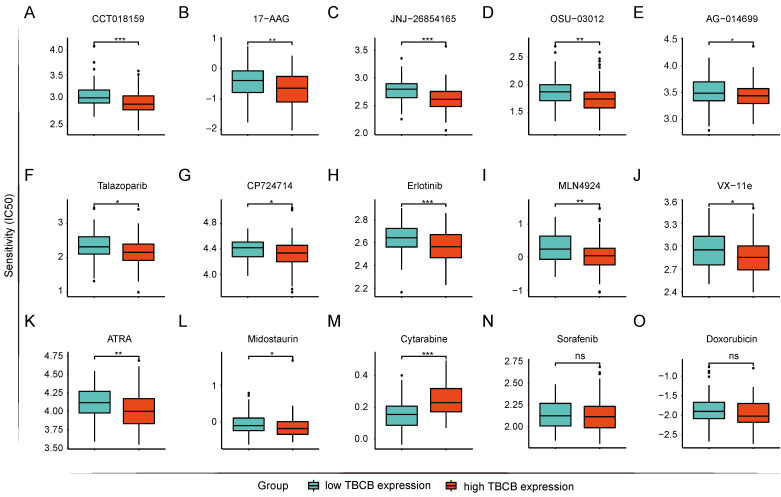
Acute myeloid leukemia (AML) is a devastating blood cancer with high heterogeneity and ill-fated outcome. Despite numerous advances in AML treatment, the prognosis remains poor for a significant proportion of patients. Consequently, it is necessary to accurately and comprehensively identify biomarkers as soon as possible to enhance the efficacy of diagnosis, prognosis and treatment of AML. In this study, we aimed to identify prognostic markers of AML by analyzing the cohorts from TCGA-LAML database and GEO microarray datasets. Interestingly, the transcriptional level of microtubule-associated protein TBCB in AML patients was noticeably increased when compared with normal individuals, and this was verified in two independent cohorts (GSE9476 and GSE13159) and with our AML patients. Furthermore, univariate and multivariate regression analysis revealed that high TBCB expression was an independent poor prognostic factor for AML. GO and GSEA enrichment analysis hinted that immune-related signaling pathways were enriched in up-regulated DEGs between two populations separated by the median expression level of TBCB. By constructing a protein-protein interaction network, we obtained six hub genes, all of which are immune-related molecules, and their expression levels were positively linked to that of TBCB. In addition, the high expression of three hub genes was significantly associated with a poor prognosis in AML. Moreover, we found that the tumor microenvironment in AML with high TBCB expression tended to be infiltrated by NK cells, especially CD56bright NK cells. The transcriptional levels of NK cell inhibitory receptors and their ligands were positively related to that of TBCB, and their high expression levels also predicted poor prognosis in AML. Notably, we found that the down-regulation of TBCB suppressed cell proliferation in AML cell lines by enhancing the apoptosis and cell cycle arrest. Finally, drug sensitivity prediction illustrated that cells with high TBCB expression were more responsive to ATRA and midostaurin but resistant to cytarabine, dasatinib, and imatinib. In conclusion, our findings shed light on the feasibility of TBCB as a potential predictor of poor outcome and to be an alternative target of treatment in AML.

Keywords: TBCB; acute myeloid leukemia; bioinformatics; drug sensitivity; immune evasion; prognosis.


Conflict of interest statement

Competing Interests: The authors have declared that no competing interest exists.

Figures

Figure 1
Figure 1
The clinical features of AML patients highly expressed TBCB. (A) Transcriptional levels of TBCB in thirty-three different cancers. Data was originated from TCGA and GTEx database. (B) The TBCB mRNA levels of AML patients in comparison with normal subjects. Data was originated from TCGA-LAML and GTEx database. (C-D) The differentially expression of TBCB between AML patients and normal subjects from GSE9476 (C) and GSE13159 (D). (E) RT-qPCR analysis for transcriptional levels of TBCB in BMMNC from AML patients (n = 9) relative to healthy donors (n = 14). Expression levels are normalized to 18S. (F) ROC analysis of TBCB in TCGA-LAML and GTEx datasets. (G-J) Significant clinical features were demonstrated, including count of white blood cells (G), proportions of PB blasts (H) and BM blasts (I), mutation rate of FLT3 (J). *p < 0.05; **p < 0.01; ***p < 0.001.
Figure 2
Figure 2
High TBCB expression correlated with unfavorable prognosis. (A) Kaplan-Meier survival curve of OS was delineated for AML patients grouped into high versus low expressed populations in line accordance with the median expression of TBCB. Data was originated from TCGA-LAML dataset. (B) Validation of OS for TBCB in the entirely independent cohort GSE37642 (n = 136). (C-D) Forest plots of OS for AML patients from univariate (C) and multivariable (D) analysis. (E) Nomogram based on integrating TBCB and other meaningful prognostic factors of AML. (F) Calibration of the nomogram. (G-I) The DCA curves of the nomogram at 1 year (G), 2 years (H), and 3 years (I).
Figure 3
Figure 3
DEGs and their functional pathways enrichment analysis. (A) Volcano plot showing TBCB-related DEGs, |log2FC| ≥ 0.59, p-adjust< 0.05. (B) The bar diagrams display the top five terms for each GO category and KEGG analysis of the up-regulated DEGs, including biological processes (left), cellular components (medium), and KEGG pathways (right). (C-D) Bubble plot (C) and chord plot (D) showing the top 3 BP terms. (E) The first 10 gene sets of GSEA analysis using the Reactome of C2 in MSigDB database. Immune-related gene sets were marked with red. (F) GSEA analysis of immune-related gene sets in up-regulated DEGs.
Figure 4
Figure 4
Establishment of PPI network and the clinical significance of hub genes. (A-C) The top15 hub genes were acquired with PPI network on the base of MCC (A), MNC (B) and EPC (C) algorithms. (D) The Venn diagram shows the overlap among the top 15 genes sorted by the three algorithms. (E) Expression levels of six hub genes (ITGAM, ITGB2, ITGAX, SPI1, TYROBP, CD68) in TCGA-LAML and GTEx database. (F-G) Co-expression heat map (F) and correlation scatter plots (G) of TBCB with six hub genes. (H-J) The OS in AML patients, splitting into two populations with high versus low expression in the light of the median expression levels of three hub genes, were created by Kaplan-Meier analysis. ITGAM (H), ITGB2 (I), ITGAX (J). *p < 0.05, ***p < 0.001.
Figure 5
Figure 5
Correlationships between TBCB expression level and infiltrating immune cells, immune checkpoint in AML. (A) The relationship between the mRNA level of TBCB and twenty four infiltrating immune cells were examined by Spearman's correlation. (B) Correlation scatter plots for nine immune infiltrating cells positively linked to TBCB transcription level. (C-D) Co-expression heat map (C) and correlation scatter plots (D) of TBCB gene with six momentous immune checkpoint molecules in AML. (E) Expression levels of ligands for inhibitory NK cell receptors (HLA-E, HLA-G and LGALS9) in AML. Data was originated from TCGA-LAML and GTEx database. (F) Correlation scatter plots of TBCB gene with three ligands for inhibitory NK cell receptors in AML. *p < 0.05, **p < 0.01, ***p < 0.001.
Figure 6
Figure 6
UP-regulated DEGs with high versus low TBCB expression involved in cell proliferation and apoptosis gene sets in AML patient. (A) Chord plot showing the relevant GO terms of cell proliferation and apoptosis gene sets. (B-C) The Kaplan-Meier survival curves of OS (B) and correlation analysis with TBCB expression (C) for nine genes related to cell proliferation and apoptosis.
Figure 7
Figure 7
The effects of TBCB knockdown on cell proliferation in AML human cell lines. (A) RT-qPCR analysis for transcriptional levels of TBCB in AML cell line THP1 (left) and Kasumi-1 (right) transduced with NC-siRNA or siTBCB oligonucleotides. Expression levels are normalized to 18S. (B) Western blotting for TBCB expression in THP1 (left) and Kasumi-1 (right) cell lines transduced with NC-siRNA or siTBCB oligonucleotides. (C-D) Proliferation curves of control and siTBCB groups in THP1 (C) and Kasumi-1 (D) cell lines were measured by CCK8. (E-H) The apoptosis analysis of AML cell lines transfected with siTBCB and NC-siRNA. Representative flow cytometry plots of apoptotic ratio in THP1 (E) and Kasumi-1 (G) cell lines. Statistical analysis of apoptotic ratio in THP1 (F) and Kasumi-1 (H) cell lines. (I-L) The cell cycle analysis of AML cell lines transfected with siTBCB and NC-siRNA. Representative flow cytometric analysis of cell cycle in THP1 (I) and Kasumi-1 (K) cell lines. Quantification of G0, G1, S, G2 and M phases in THP1 (J) and Kasumi-1 (L) cell lines. All statistical values were presented as the means ± SEM. n = 3, *p < 0.05, **p < 0.01, ***p < 0.001, by one-way ANOVA.
Figure 8
Figure 8
Prediction of drug sensitivity based on TBCB expression. (A) CCT018159. (B) 17-AAG. (C) JNJ-268541653. (D) OSU-03012. (E) AG-0140699. (F) Talazoparib. (G) CP724714. (H) Erlotinib. (I) MLN4924. (J) VX-11e. (K) ATRA. (L) Midostaurin. (M) Cytarabine. (N) Sorafenib. (O) Doxorubicin. *p < 0.05, *p < 0.01, ***p < 0.001.

Similar articles

Cited by

References

    1. Konopleva M, Pollyea DA, Potluri J, Chyla B, Hogdal L, Busman T. et al. Efficacy and Biological Correlates of Response in a Phase II Study of Venetoclax Monotherapy in Patients with Acute Myelogenous Leukemia. Cancer discovery. 2016;6:1106–17. - PMC - PubMed
    1. Xie G, Ivica NA, Jia B, Li Y, Dong H, Liang Y. et al. CAR-T cells targeting a nucleophosmin neoepitope exhibit potent specific activity in mouse models of acute myeloid leukaemia. Nature biomedical engineering. 2021;5:399–413. - PMC - PubMed
    1. Hu Q, Sun W, Wang J, Ruan H, Zhang X, Ye Y. et al. Conjugation of haematopoietic stem cells and platelets decorated with anti-PD-1 antibodies augments anti-leukaemia efficacy. Nature biomedical engineering. 2018;2:831–40. - PMC - PubMed
    1. Dossa RG, Cunningham T, Sommermeyer D, Medina-Rodriguez I, Biernacki MA, Foster K. et al. Development of T-cell immunotherapy for hematopoietic stem cell transplantation recipients at risk of leukemia relapse. Blood. 2018;131:108–20. - PMC - PubMed
    1. Wang W, Liang Q, Zhao J, Pan H, Gao Z, Fang L. et al. Low expression of the metabolism-related gene SLC25A21 predicts unfavourable prognosis in patients with acute myeloid leukaemia. Front Genet. 2022;13:970316. - PMC - PubMed