. 2023 Mar 13;2(3):307-321.
doi: 10.1038/s44161-023-00224-y.

The angiopoietin receptor Tie2 is atheroprotective in arterial endothelium

Affiliations

The angiopoietin receptor Tie2 is atheroprotective in arterial endothelium

Andrey Anisimov et al. Nat Cardiovasc Res. .

Abstract

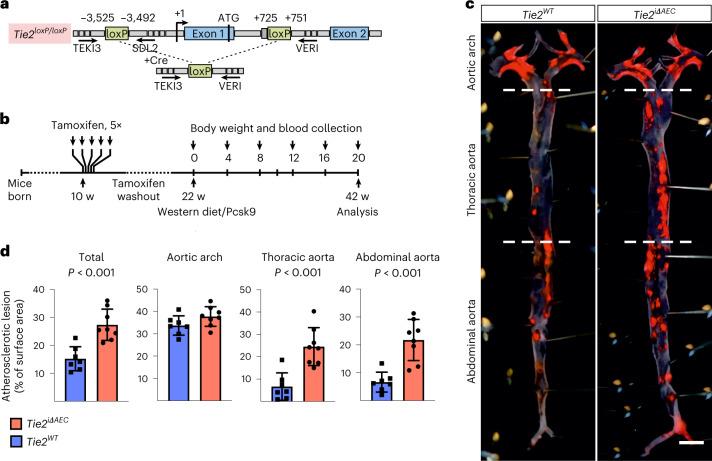
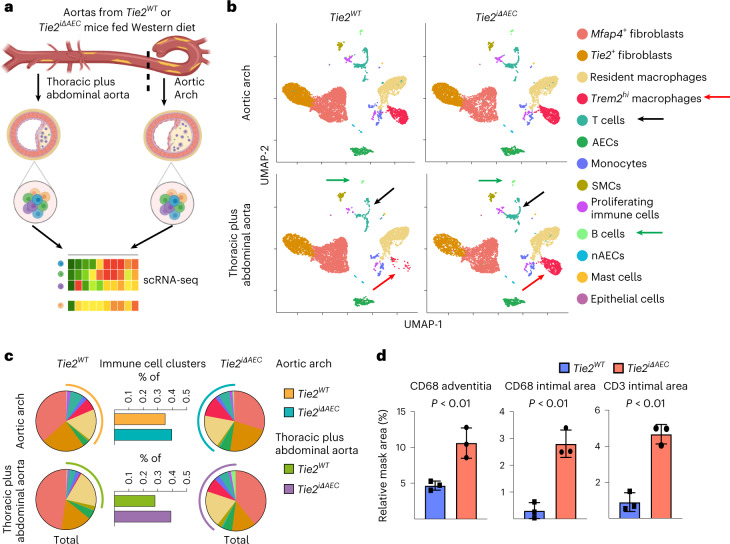
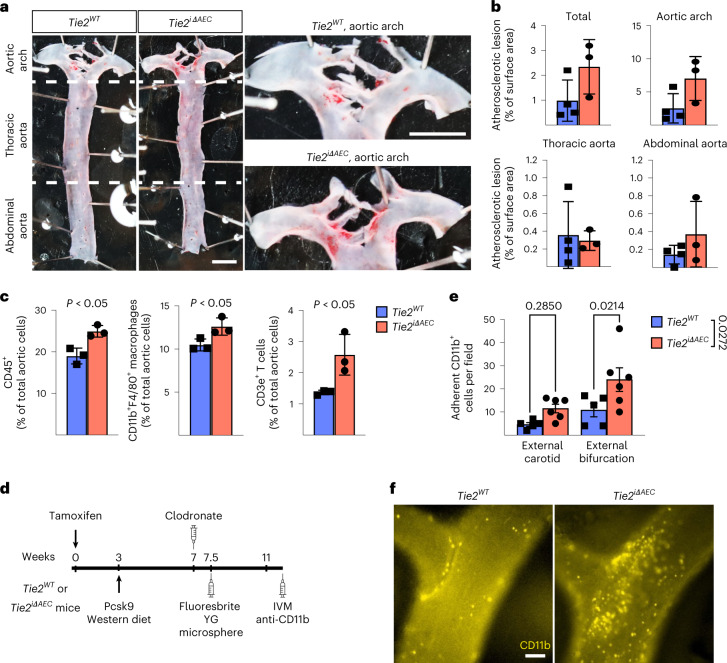
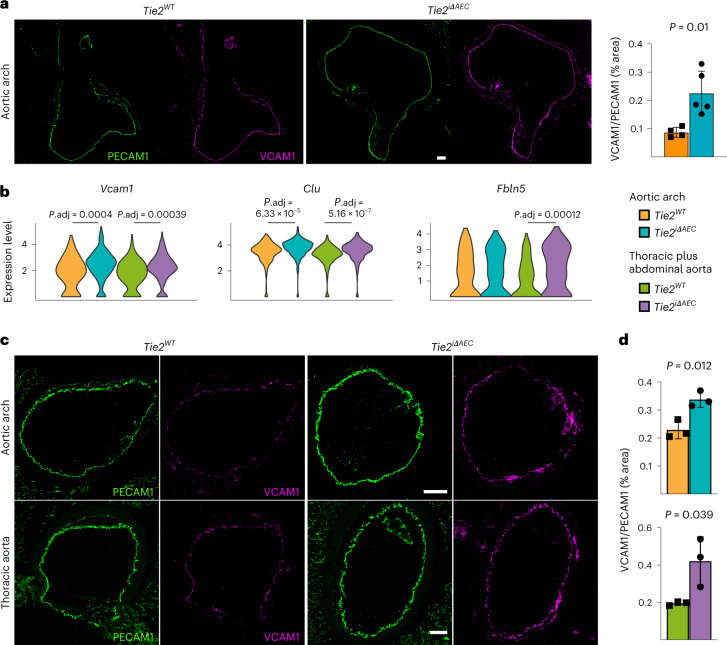
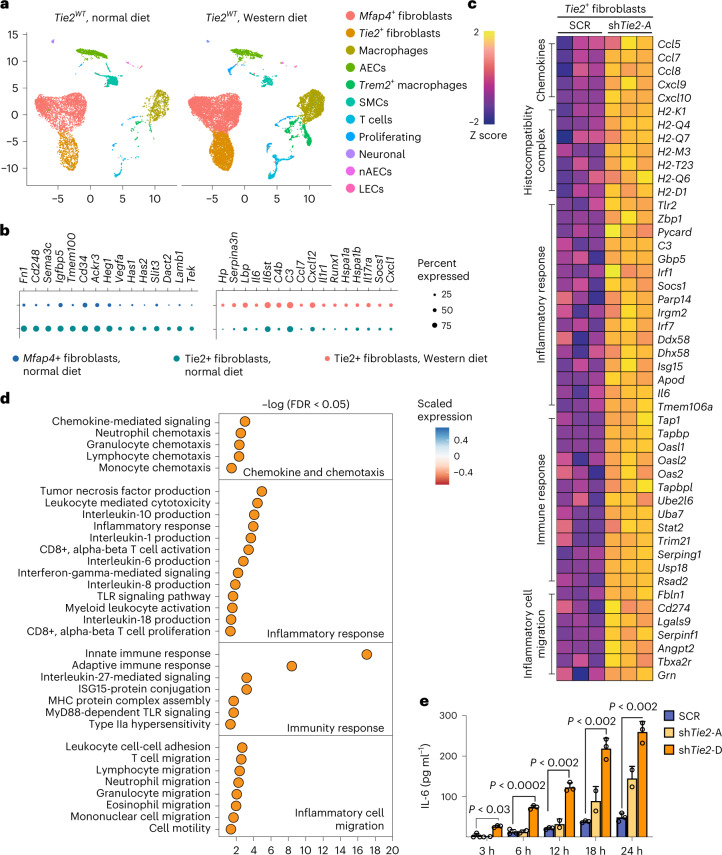
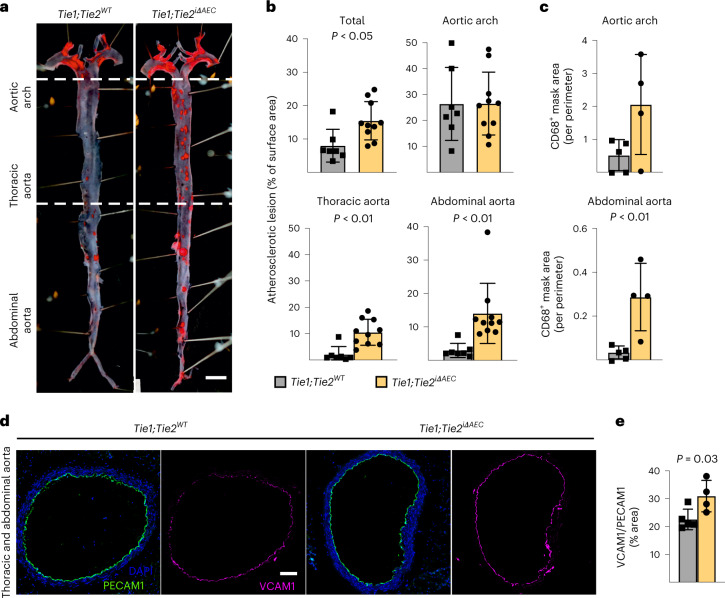
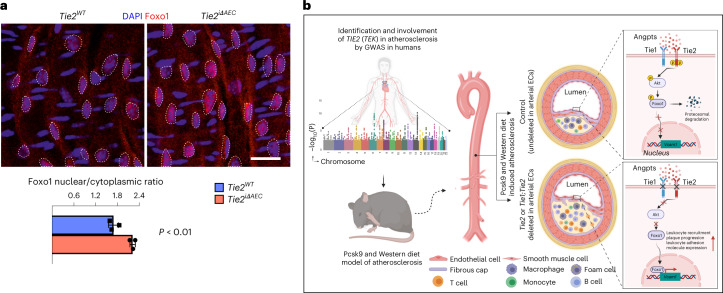
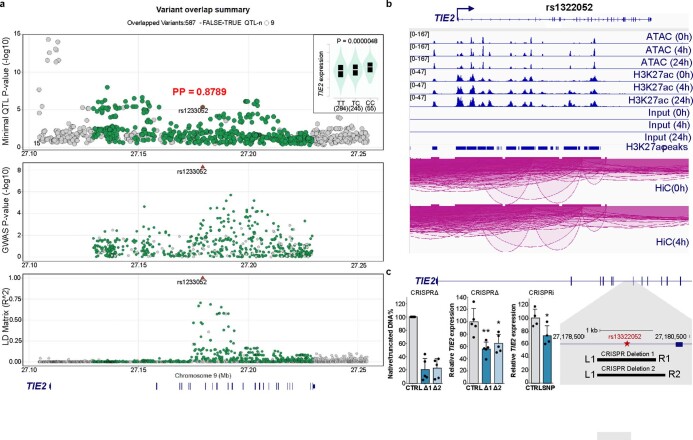
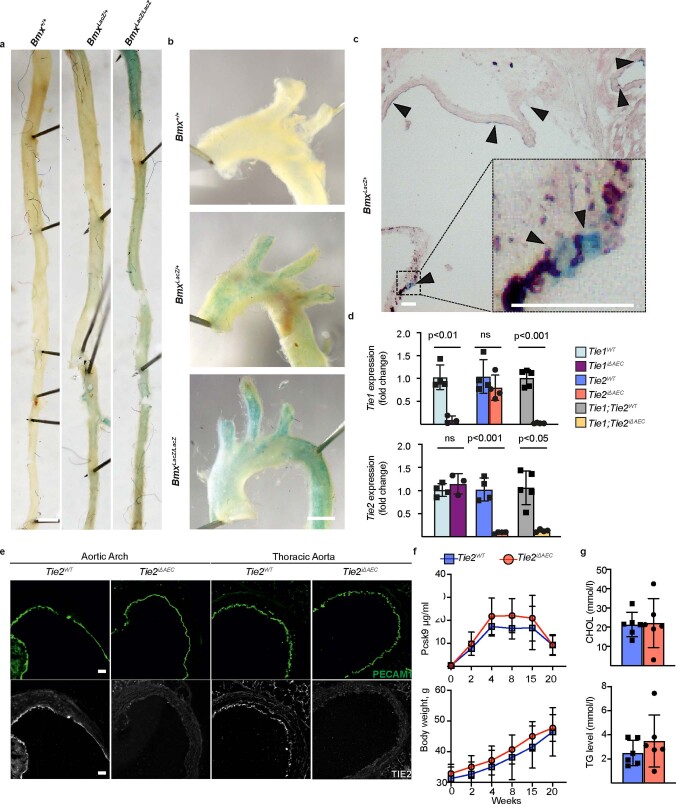
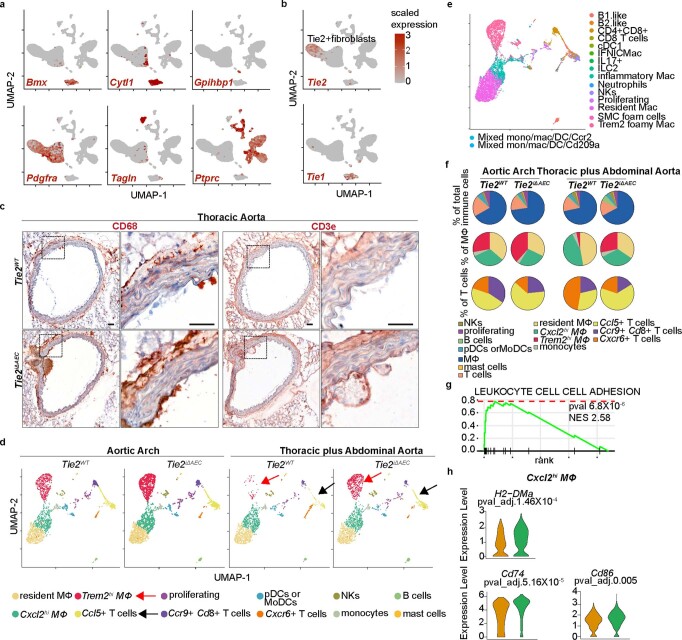
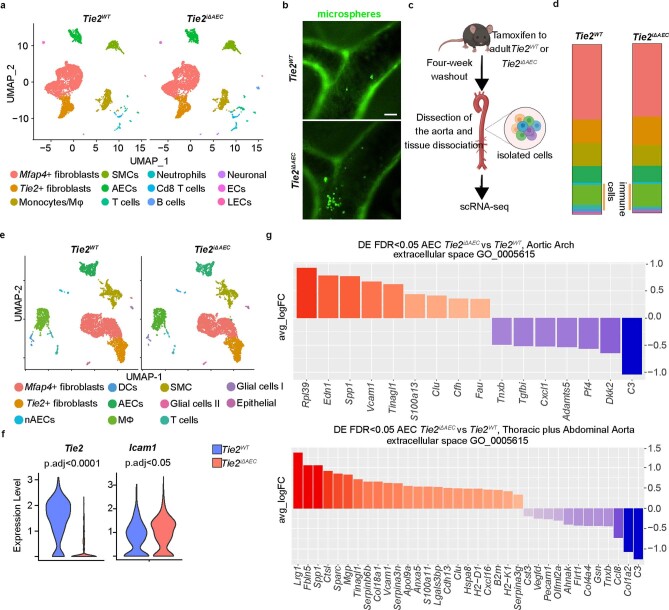
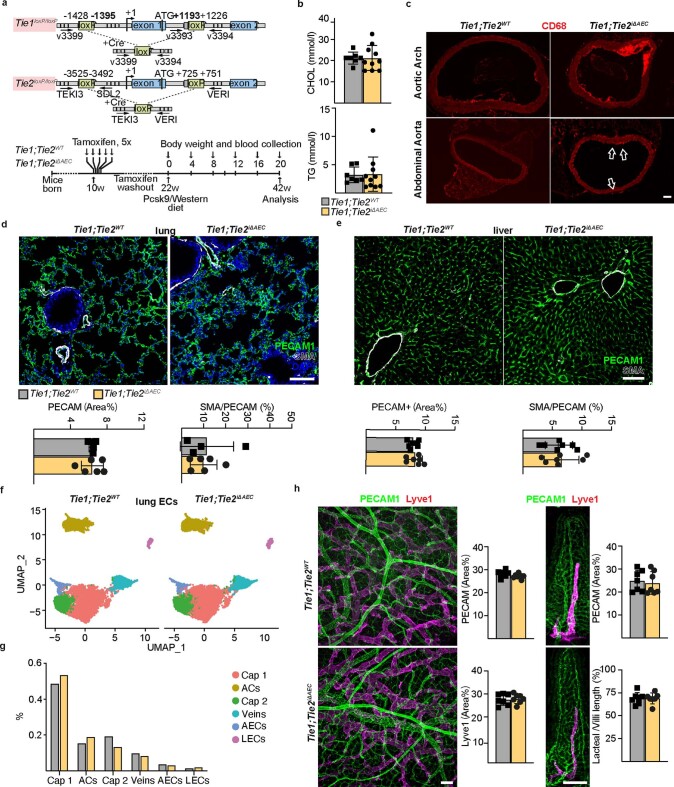
Leukocytes and resident cells in the arterial wall contribute to atherosclerosis, especially at sites of disturbed blood flow. Expression of endothelial Tie1 receptor tyrosine kinase is enhanced at these sites, and attenuation of its expression reduces atherosclerotic burden and decreases inflammation. However, Tie2 tyrosine kinase function in atherosclerosis is unknown. Here we provide genetic evidence from humans and from an atherosclerotic mouse model to show that TIE2 is associated with protection from coronary artery disease. We show that deletion of Tie2, or both Tie2 and Tie1, in the arterial endothelium promotes atherosclerosis by increasing Foxo1 nuclear localization, endothelial adhesion molecule expression and accumulation of immune cells. We also show that Tie2 is expressed in a subset of aortic fibroblasts, and its silencing in these cells increases expression of inflammation-related genes. Our findings indicate that unlike Tie1, the Tie2 receptor functions as the dominant endothelial angiopoietin receptor that protects from atherosclerosis.


Conflict of interest statement

Competing interests O.S. is named as a co-inventor on a patent on peptides disrupting chemokine heteromers (WO2017/077062A1) and two patents on peptides neutralizing extracellular histones (WO2019/122127 A1 and WO2021209465A1). These patents are outside the scope of the current manuscript. O.S. is a scientfic advisor to Novo Nordisk and ResoTher Pharma. The other authors declare no competing interests.

Figures

Fig. 1
Fig. 1. Arterial Tie2 deletion promotes atheroma formation.
a, Detailed schematic of the gene deletions. Numbers indicate nucleotide positions of the loxP sites relative to the transcription start site and names of the genotyping primers (Supplementary Table 1). b, Outline and time schedule (in weeks, w) of the experimental setup. c, Control and Tie2-deleted aortas stained with Sudan IV (n = 7 independent Tie2WT and n = 8 independent Tie2iΔAEC mice; scale bar, 2 mm). d, Quantification of aortic lesion areas (total, P = 0.0004; aortic arch, P = 0.099; thoracic aorta, P = 0.0005; abdominal aorta, P = 0.0003). Values show mean ± s.d. Statistical significance was determined using Student’s t-test (two-tailed, unpaired). Source data
Fig. 2
Fig. 2. scRNA-seq analysis of cells in the atheromatous aortas.
a, Schematic of the analysis. b, UMAP plots of aligned gene expression data from aortic cells isolated and pooled from 2–3 individual Tie2WT (n = 7,903 in the aortic arch, n = 6,310 in the thoracic plus abdominal aorta isolated and pooled from 2–3 mice) and Tie2iΔAEC (n = 6,578 and n = 6,178, respectively) mice after 20 weeks of Western diet, partitioned into 13 distinct clusters. Trem2hi macrophage (red arrow), T cell (black arrow) and B cell (green arrow) clusters showed the most obvious changes after endothelial cell Tie2 deletion. c, Proportions of immune cell clusters in the analyzed aortic regions. d, Quantification of CD68 macrophages (adventitia, P = 0.0096; intimal area, P = 0.0019) and CD3e T cells (P = 0.0010) in the atherosclerotic arotas (n = 3 independent mice per group). Values show mean ± s.d. Statistical significance was determined using Student’s t-test (two-tailed, unpaired). Source data
Fig. 3
Fig. 3. Tie2 deletion increases inflammatory cells in atherosclerotic lesions.
a, Representative images of aortas stained with Sudan IV from the Tie2WT and Tie2iΔAEC (n = 4 independent Tie2WT and n = 3 independent Tie2iΔAEC mice) mice after 4 weeks of Western diet (scale bar, 2 mm). b, Quantification of aortic lesion areas. Values show mean ± s.d. c, Quantification of CD45+ immune cells (P = 0.012), CD11b+F4/80+ macrophages (P = 0.038) and CD3e+ T cells (P = 0.034) in the aortas (n = 3 independent mice per group) using flow cytometry. Values show mean ± s.d. Statistical significance was determined using Student’s t-test (two-tailed, unpaired). d, Outline and time schedule (in weeks) of the experimental setup in the intravital microscopy analysis. e,f, Images of CD11b+ myeloid cells adherent to the carotid artery wall in the bifurcation area (f). Scale bar, 100 µm. Quantification of CD11b+ myeloid cells in the external carotid artery and its bifurcation (n = 5 independent Tie2WT and n = 6 Tie2iΔAEC mice) (e). Each data point represents one mouse. Values show mean ± s.d. Statistical significance was determined using two-way ANOVA with Sidak post hoc test. Source data
Fig. 4
Fig. 4. Expression of leukocyte adhesion receptors and transcripts associated with lymphocyte activation in the Tie2WT and Tie2iΔAEc mice.
a, Representative immunofluorescence images of aortic arch from the Tie2WT and Tie2iΔAEC mice 8 weeks after Western diet and Pcsk9 overexpression stained for platelet and endothelial cell adhesion molecule 1 (PECAM1; green) and VCAM1 (red) (left). Quantification of the VCAM1/PECAM1 ratio (n = 4 independent Tie2WT mice and n = 5 independent Tie2iΔAEC mice) (right). Scale bar, 100 μm. Values show mean ± s.d. Statistical significance was determined using Student’s t-test (two-tailed, unpaired). b, Violin plots of Vcam1, Clu and Fbln5 expression in AECs. Note that after Tie2 deletion, Vcam1 and Clu are upregulated in both parts of the aorta, whereas Fbln5 is significantly upregulated only in the thoracic and abdominal parts. Scale, log-transformed gene expression. Statistical significance was determined using a Wilcoxon rank-sum test. P value adjustment was performed using Bonferroni correction based on the total number of genes in the dataset. c, Representative immunofluorescence images of aortic sections 20 weeks after Western diet and Pcsk9 overexpression stained for PECAM1 (green) and VCAM1 (red). Scale bar, 100 μm. d, Quantification of the VCAM1/PECAM1 ratio (n = 3 independent mice per group). Values show mean ± s.d. Statistical significance was determined using Student’s t-test (two-tailed, unpaired). Source data
Fig. 5
Fig. 5. Tie2 restricts inflammatory signaling in the Tie2+ fibroblasts.
a, UMAP plots of aortic cells from adult Tie2WT mice that received normal diet and Tie2WT mice after 20 weeks of Western diet. b, Dot plots showing top changed genes in the top regulated pathways in the Tie2+ fibroblasts. c, Heatmap showing upregulated genes related to inflammatory cell migration, immune response, inflammatory response, and chemokine and chemotaxis pathways upon Tie2 silencing. d, Gene ontology analysis on the GO terms that were upregulated in the Tie2-silenced Tie2+ fibroblasts. Bonferroni correction (multiple comparison test) was applied, followed by Benjamin–Hochberg adjusted P value or FDR values to plot the gene ontology. e, Quantification of IL-6 secreted in the Tie2+ fibroblasts after Tie2 silencing (n = 3 independent samples in SCR, n = 2 independent samples in shTie2-A and n = 3 independent samples in shTie2-D; 3 h, P = 0.0281, 6 h, P = 0.000102; 12 h, P = 3.21 × 108; 18 h, P = 2.16 × 10−13; 24 h, P = 3.5 × 10−14). Values show mean ± s.d. Statistical significance was determined using two-way ANOVA with Greenhouse–Geisser correction and Tukey’s multiple comparisons test. Source data
Fig. 6
Fig. 6. Tie2 function dominates over Tie1 function in atherosclerosis development.
a, Representative images of Tie1WTTie2WT and Tie1;Tie2iΔAEC (n = 7 independent Tie1WTTie2WT mice and n = 10 independent Tie1;Tie2iΔAEC mice) aortas stained with Sudan IV (scale bar, 2 mm). b, Quantification of lesion areas in the Tie1WTTie2WT and Tie1;Tie2iΔAEC aortas (n = 7 independent Tie1WTTie2WT mice and n = 10 independent Tie1;Tie2iΔAEC mice over two independent experiments; total, P = 0.0132; thoracic aorta, P = 0.0012; abdominal aorta, P = 0.0063). Values show mean ± s.d. Statistical significance was determined using Student’s t-test (two-tailed, unpaired). c, Quantification of CD68+ area (n = 5 independent Tie1WTTie2WT mice and n = 4 independent Tie1;Tie2iΔAEC mice; P = 0.0081). Values show mean ± s.d. Statistical significance was determined using Student’s t-test (two-tailed, unpaired). d, Representative immunofluorescence images of the Tie1WTTie2WT and Tie1;Tie2iΔAEC aorta sections stained for PECAM1 (green), DAPI (blue) and VCAM1 (red). e, Quantifications of VCAM1 in the Tie1WTTie2WT and Tie1;Tie2iΔAEC aortas (n = 5 independent Tie1WTTie2WT mice and n = 4 independent Tie1;Tie2iΔAEC mice). Values show mean ± s.d. Statistical significance was determined using Student’s t-test (two-tailed, unpaired). Scale bar, 100 μm. Source data
Fig. 7
Fig. 7. Tie2 deletion promotes nuclear localization of Foxo1.
a, Representative en face images of Tie2WT and Tie2iΔAEC (n = 3 per group) aortas stained for Foxo1 (red) and DAPI (blue) (top). Scale bar, 20 μm. Quantification of nuclear versus cytoplasmic Foxo1 expression in the endothelial cells (dashed lines) (n = 3 independent mice per group; P = 0.0044) (bottom). Values show mean ± s.d. Statistical significance was determined using Student’s t-test (two-tailed, unpaired). b, Schematic showing a summary of the main results. GWAS analysis indicates that Tie2 activity is involved in human CAD via disruption of Tie–Akt signaling axis and via inhibition of Foxo1 nuclear localization and transcriptional activity. When Tie2 alone or the whole Tie1;Tie2 receptor complex is deleted from the aortic endothelium, VCAM1 expression is induced via Foxo1 transcriptional transactivation and blood leukocytes adhere to the aortic endothelium, which promotes atheroma formation. ECs, endothelial cells. Source data
Extended Data Fig. 1
Extended Data Fig. 1. GWAS identify TIE2 (TEK) as a risk locus for CAD.
a. A LocusZoom plot with eQTL association in GTEX v8 Tibial Artery (top) and CAD GWAS association (middle) and LD matrix (bottom) generated using ezQTL tool. The red triangle indicates the rs1322052 SNP which demonstrates strong colocalization between eQTL and GWAS signals within the LD block (HyPrColoc posterior probability, PP: 0.8789). The insert in top figure indicates the direction of eQTL association with the risk variant T being associated with lower TIE2 expression. b. IGV genome browser screenshots of the TIE2 locus that demonstrates ATAC-Seq, H3K27ac ChIP-Seq and Hi-C data from teloHAECs treated with 0–24 TNFα stimulus. The rs1322052 localizes to cis-regulatory enhancer element that is TNFα-responsive and loops to the TIE2 promoter. c. CRISPR deletion (CRISPRΔ) and CRISPR inhibition (CRISPRi) experiments were used to study the effect of rs1322052 variant site on TIE2 expression in teloHAECs. Two pairs of gRNAs were used to make the deletion of 945 bps and 1120 bps centered around rs1322052 variant (schematic). Quantification of DNA band intensities on the gel image demonstrate ~80% deletion of the intronic rs1322052 variant (bar plot on the left). The deletion translated to 35–44% reduction in the expression of TIE2 (TEK) gene (bar plot in the middle). CRISPRi-mediated inhibition of the variants site led to ~30% repression of TIE2 expression (bar plot in the right). Data represented as means ± s.d. (for CRISPRΔ, n = 5 independent samples per group, one-way ANOVA (P = 0.0024) with Dunnett’s post hoc test (*P < 0.05 and **P < 0.01); for CRISPRi, n = 3 independent samples per group, two-tailed t-test, unpaired P = 0.0379).
Extended Data Fig. 2
Extended Data Fig. 2. Expression of Bmx gene and confirmation of Tie1 and Tie2 gene deletions in the aorta.
a. Representative images of β-gal staining in the thoracic aorta, b. aortic arch and c. aortic root from WT (Bmx+/+) mice and in mice expressing the LacZ gene targeted into the Bmx locus. Scale bar, 1 mm (A-B) and 50 μm (C). d. Fold differences of Tie1 and Tie2 transcripts in the Tie1iΔAEC (n = 3 independent mice per group, Tie1: P = 0.0025), Tie2iΔAEC (n = 4 independent mice per group, Tie2: P = 0.0003), and Tie1;Tie2iΔAEC mice (n = 5 independent Tie1;Tie2WT mice and n = 4 independent Tie1;Tie2iΔAEC mice, Tie1: P = 0.0003,Tie2: P = 0.0015) in comparison with their littermate controls. Statistical significance was determined using Student’s t-test (two tailed, unpaired). e. Immunofluorescence of Tie2 and PECAM1 in the aortic root, aortic arch and thoracic aorta of the Tie2iΔAEC and Tie2WT mice (n = 3 independent mice per group). Scale bar, 50 μm. f. Pcsk9-D377Y concentration in serum samples and body weight measurements at the indicated time points in the Tie2iΔAEC and Tie2WT mice (n = 6 independent mice per group). g. Quantification of cholesterol (CHOL) and triglyceride (TG) concentrations in serum samples from the Tie2-deleted mice (n = 6 independent mice per group) 20 weeks after Pcsk9 and Western diet. Values show mean ± s.d. Statistical significance was determined using Student’s t-test (two tailed, unpaired). Source data
Extended Data Fig. 3
Extended Data Fig. 3. Tie2iΔAEC is associated with alteration of T cell and macrophage subsets during atherosclerosis.
a. Feature plot showing the expression of Bmx (AECs), Cytl1 (AECs), Gpihbp1 (nAECs), Pdgfra (fibroblasts), Tagln (SMCs) and Ptprc (immune cells). b. Tie1 and Tie2 expression shown in the feature plot. Note that unlike Tie2, Tie1 was not expressed in the Tie2+ FB cluster. c. Representative images of immunohistochemical (chromogenic) staining of CD68 macrophages and CD3e T cells in the atherosclerotic aortas (n = 3 independent mice per group). Scale bar, 50 μm. d. UMAP plots of (12) immune cell clusters from the atheromatous aortic arch and thoracic plus abdominal aortas of the Tie2WT and Tie2iΔAEC mice. e. UMAP plots of immune cell annotation referenced to the published datasets using SingleR. f. Pie plots show the relative proportions of the main immune cell types (macrophage/monocyte, T cells, DCs, B cells, NK and mast cells) (upper), macrophages (middle), and T cells (lower). g. Gene enrichment analysis showing pathways that are related the upregulated genes in the Cxcl2hi macrophages in the Tie2iΔAEC mice. P value adjustment is performed using a Benjamini-Hochberg (BH)-procedure (Multiple comparison test) as indicated in the fgsea package. h. Violin plots showing the expression of MHC II CLASS gene, CD74 and APC costimulatory molecule CD86 in the Cxcl2hi macrophages. Statistical significance was determined using the Wilcoxon rank-sum test. P value adjustment is performed using Bonferroni correction based on the total number of genes in the dataset as indicated in the Seurat package. Source data
Extended Data Fig. 4
Extended Data Fig. 4. No difference in bone marrow leukocyte production between Tie2WT and Tie2iδAEC mice.
a. Peripheral blood cell counts indices in the Tie2WT and Tie2iΔAEC mice four weeks after Western diet. b-c. Quantification of BM cellularity and spleen weight/bodyweight in the Tie2WT and Tie2iΔAEC mice (n = 3 independent mice per group). d-e. Quantification of BM stem and progenitor cell numbers in the Tie2WT and Tie2iΔAEC mice (n = 3 independent mice per group). f. Quantification of CD3e+ T cells, B220 + B cells and CD11b + F4/80+ macrophages in the BM from the Tie2WT and Tie2iΔAEC mice (n = 3 independent mice per group). g. UMAP plots of (15) immune cell clusters from red blood cell-depleted total bone marrow of the Tie2WT and Tie2iΔAEC mice four weeks after Western diet with Immgen annotation. h. Quantification of immune cell clusters from the experiment. Values show mean ± s.d. Statistical significance was determined using Student’s t-test (two tailed, unpaired). i. Gene enrichment analysis showing pathways that are related the upregulated genes in the BM neutrophils and monocytes in the Tie2iΔAEC mice. P value adjustment is performed using a Benjamini-Hochberg (BH)-procedure (Multiple comparison test) as indicated in the fgsea package. j. Quantification of CD11b + cells and CD11b + Gr1+ neutrophils in the BM from the Tie2WT and Tie2iΔAEC mice (n = 3 per group). Values show mean ± s.d. Statistical significance was determined using Student’s t-test (two tailed, unpaired). Source data
Extended Data Fig. 5
Extended Data Fig. 5. scRNA analysis of Tie2WT and Tie2iΔAEC mice on normal diet or after 4 weeks of Western diet.
a. UMAP plots of total aortic cells from adult Tie2WT and Tie2iΔAEC mice after 4 weeks of Western diet. b. Representative images of cells labelled with fluorescent microbeads in the carotid arteries of the Tie2WT and Tie2iΔAEC mice (n = 5 Tie2WT and n = 6 Tie2iΔAEC). Scale bar, 100 µm. c. Schematic of the experimental workflow. d. Proportions of the distinct clusters and total immune cells among the total aortic cells. e. UMAP plots of total aortic cells (n = 5936 and n = 5615, respectively, that partition into 11 distinct clusters) from adult Tie2WT and Tie2iΔAEC mice on normal diet, four weeks after Tie2 deletion. f. Tie2 (p.adj=2.14×10-99) and Icam1 (p.adj=0.0258) expression in aortic AECs shown in the violin plot. Statistical significance was determined using a Wilcoxon rank-sum test. P value adjustment was performed using Bonferroni correction based on the total number of genes in the dataset as indicated in the Seurat package. g. Gene ontology annotation analysis of the differentially expressed genes (DEGs) in the AECs in the Tie2iΔAEC aortas. P value adjustment is performed using a Benjamini-Hochberg (BH)-procedure (Multiple comparison test). Source data
Extended Data Fig. 6
Extended Data Fig. 6. No obvious defects in other vascular beds in the Tie2iΔAEC mice four weeks after Western diet.
a. Representative immunofluorescent images of lung sections stained for PECAM1 (green), DAPI (blue), and SMA (white). Quantification of PECAM1 and SMA/PECAM1 ratios (n = 3 independent mice per group). b. Representative immunofluorescent images of liver sections and their quantification (n = 3 independent mice per group). c. Representative immunofluorescent images of intestine stained for PECAM1 (green), Tie2 (white), and Lyve1 (red). Quantifications of PECAM1, Lyve1 and lacteal/villus length ratio (n = 3 independent mice per group). Values show mean ± s.d. Scale bar, 100 μm. Source data
Extended Data Fig. 7
Extended Data Fig. 7. Identification of Tie2 expressing fibroblasts in the aortic wall.
Representative flow cytometry analysis on the Tie2 expression of aortic cells using CD45, Ter119, PDGFRα and CD31 staining (n = 3 independent mice). b. Violin plots showing Cd248 and Sema3c expression in the Tie2+ fibroblasts and Mfap4+ fibroblasts as indicated in Fig.2a. c. Representative immunofluorescent images of Tie2+ fibroblasts in the aortic root and aortic arch. The sections were stained for PECAM1 (green), TIE2 (grey), SEMAPHORIN 3 C (red). Scale bar, 50 μm. d. Feature plots showing the expression of Angpt1 and Angpt2 in the aortic cells from the Tie2WT mice and cells from aortic arch and thoracic plus abdominal aortas of the Tie2WT mice after 20 weeks of Pcsk9 overexpression and Western diet. Note Ang1 and Ang2 in Mfap4 + fibroblasts and SMCs. e-f. Gene enrichment analysis showing pathways that are related the upregulated genes in the Tie2+ fibroblasts from mice fed with normal diet (e) and Western diet (f). P value adjustment is performed using a Benjamini-Hochberg (BH)-procedure as indicated in the fgsea package. g. Circle plot showing the number of interactions between any two cell groups in the aorta during atherosclerosis analyzed with CellChat. h. Alluvial plot visualizing the outgoing signaling patterns of secreting cells and the incoming signaling patterns of target cells, which shows the correspondence between the inferred patterns, cell groups and signaling pathways.
Extended Data Fig. 8
Extended Data Fig. 8. Effect of Tie2 silencing on gene expression in cultured Tie2 + FBs.
a. Quantifications of Tie2 (Tek) mRNA level in cultured Tie2+ FBs and Tie2- FBs (Passage 6) in comparison with murine endothelial cell line Bend.3 (n = 3 independent mice per group). b. Quantification of Tie2 (Tek) mRNA level in the Tie2+ FBs transduced with shTie2-A or shTie2-D vs scramble (SCR) control (n = 3 independent mice per group). c. Heatmap showing upregulated transcripts related to inflammatory cell migration, immune response, inflammatory response, and chemokine and chemotaxis pathways in the Tie2-silenced Tie2+FBs. d. Violin plots showing the upregulation of Ccl7, Ccl8, Pycard, C3, Socs1, Apod, and Il6 in the Tie2+ fibroblasts during feeding Western diet in Tie2WT mice. e. Circle plot showing the significant communications in the IL6 signaling pathway and CCL signaling pathway analyzed using CellChat. f. Quantification of CCL5 secreted in the Tie2+ fibroblasts after Tie2 silencing (n = 3 independent samples in SCR, n = 2 independent samples in shTie2-A, n = 3 independent samples in shTie2-D; 6 h: P = 0.0016, 12 h: P = 3.59 × 10−9, 18 h: P = 3.0 × 10−14, 12 h: P = 2.9 × 10−14). Values show mean ± s.d. Statistical significance was determined using Two-way ANOVA with Geisser-Greenhouse correction and Turkey’s multiple comparisons test to the scramble control. Source data
Extended Data Fig. 9
Extended Data Fig. 9. Tie1 deletion reduces atherosclerosis.
a. Detailed schematic of the gene deletions. Numbers indicate positions of the loxP sites relative to the transcription start site, and names of the genotyping primers (right). Outline and time schedule (in weeks, w) of the experimental setup. b. Representative images of the Tie1-deleted aortas stained with Sudan IV (scale bar, 2 mm). c. Quantification of aortic lesion areas from the experiments (n = 8 independent mice per group, total: P = 0.0012, aortic arch: P = 0.0001, thoracic P = 0.024, abdominal P = 0.0098). Values show mean ± s.d. Statistical significance was determined using Student’s t-test (two tailed, unpaired). d. UMAP plots of aligned gene expression data in atheromatous aortic cells isolated from the aortic arch and thoracic plus abdominal aortas of the Tie1WT (n = 4994 and n = 2696, respectively) and Tie1iΔAEC (n = 6259 and n = 4892, respectively) mice after 20 weeks of w, partitioned into 12 distinct clusters. Trem2hi macrophages (red arrow) showed the most obvious changes after Tie1 deletion. e. Proportions of distinct clusters (inner circle) and total immune cells (blue arch) among the aortic cells. Frequencies of main immune cell types (macrophage subtypes, T cells, DCs, proliferating immune cells) (column). Frequencies of Trem2hi macrophages are indicated with the red arrows. f. UMAP plot of immune clusters from the atheromatous aortic arch and thoracic plus abdominal aortas of the Tie1WT and Tie1iΔAEC mice, partitioned further into 9 sub-clusters. g. Violin plots showing Vcam1, Clu and Fbln5 expression in the atheromatous aortic arch (Clu, p.adj=3.08×10⁻⁸), Fbln5 p.adj=1.01×10⁻⁶) and thoracic plus abdominal aortas (Clu, p.adj = 1.28×10⁻²⁰) of the Tie1WT and Tie1iΔAEC mice. Statistical significance was determined using a Wilcoxon rank-sum test. P value adjustment is performed using bonferroni correction based on the total number of genes in the dataset as indicated in the Seurat package. Source data
Extended Data Fig. 10
Extended Data Fig. 10. Tie1;Tie2 deletions in the aorta.
a. Detailed schematic of the gene deletions. Numbers indicate positions of the loxP sites relative to the transcription start site, and names of the genotyping primers. b. Cholesterol (CHOL) and triglyceride (TG) concentrations in serum samples from the Tie1WTTie2WT and Tie1;Tie2iΔAEC mice 20 weeks after Pcsk9 and Western diet (n = 7 independent Tie1WTTie2WT mice and n = 10 independent Tie1;Tie2iΔAEC mice). c. Representative immunofluorescent images of aorta sections stained for CD68 (red). d. Representative immunofluorescent images of the lung sections from the Tie1WTTie2WT and Tie1;Tie2iΔAEC mice stained for PECAM1 (green), DAPI (blue), and SMA (white). Quantification of PECAM1 and SMA/PECAM1 ratio (n = 4 independent Tie1WTTie2WT mice and n = 6 independent Tie1;TieiΔAEC mice). e. Representative immunofluorescent images of liver sections stained for PECAM1 (green), DAPI (blue), and SMA (white). Quantification of PECAM1 and SMA/PECAM1 ratio (n = 7 independent mice per group). f. UMAP plot of lung endothelial clusters from the Tie1WTTie2WT and Tie1;Tie2iΔAEC mice 20 weeks after Western diet and Pcsk9 overexpression, partitioned further into 6 clusters. g. Proportions of distinct clusters among the lung endothelial cells. h. Representative immunofluorescence images of the intestine stained for PECAM1 (green) and Lyve1 (red). Quantifications of PECAM1, Lyve1 and lacteal/villus length ratio (n = 7 independent mice per group). Scale bar, 100 μm. Values show mean ± s.d. Source data

Comment in

References

    1. Libby P, et al. Atherosclerosis. Nat. Rev. Dis. Primers. 2019;5:56. doi: 10.1038/s41572-019-0106-z. - DOI - PubMed
    1. Borén J, et al. Low-density lipoproteins cause atherosclerotic cardiovascular disease: pathophysiological, genetic, and therapeutic insights: a consensus statement from the European Atherosclerosis Society Consensus Panel. Eur. Heart J. 2020;41:2313–2330. doi: 10.1093/eurheartj/ehz962. - DOI - PMC - PubMed
    1. Souilhol C, et al. Endothelial responses to shear stress in atherosclerosis: a novel role for developmental genes. Nat. Rev. Cardiol. 2020;17:52–63. doi: 10.1038/s41569-019-0239-5. - DOI - PubMed
    1. Gisterå A, Hansson GK. The immunology of atherosclerosis. Nat. Rev. Nephrol. 2017;13:368–380. doi: 10.1038/nrneph.2017.51. - DOI - PubMed
    1. Ridker PM, et al. Antiinflammatory therapy with canakinumab for atherosclerotic disease. N. Engl. J. Med. 2017;377:1119–1131. doi: 10.1056/NEJMoa1707914. - DOI - PubMed