. 2023 Jul 5:14:1163162.
doi: 10.3389/fgene.2023.1163162. eCollection 2023.

PCDH7 as the key gene related to the co-occurrence of sarcopenia and osteoporosis

Affiliations

PCDH7 as the key gene related to the co-occurrence of sarcopenia and osteoporosis

Mingchong Liu et al. Front Genet. .

Abstract

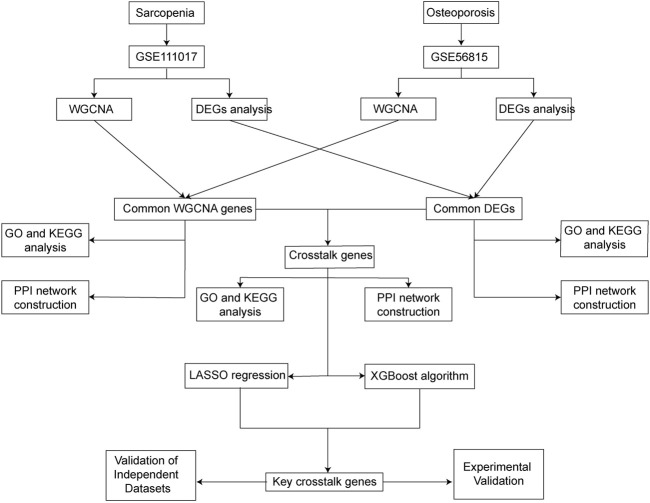
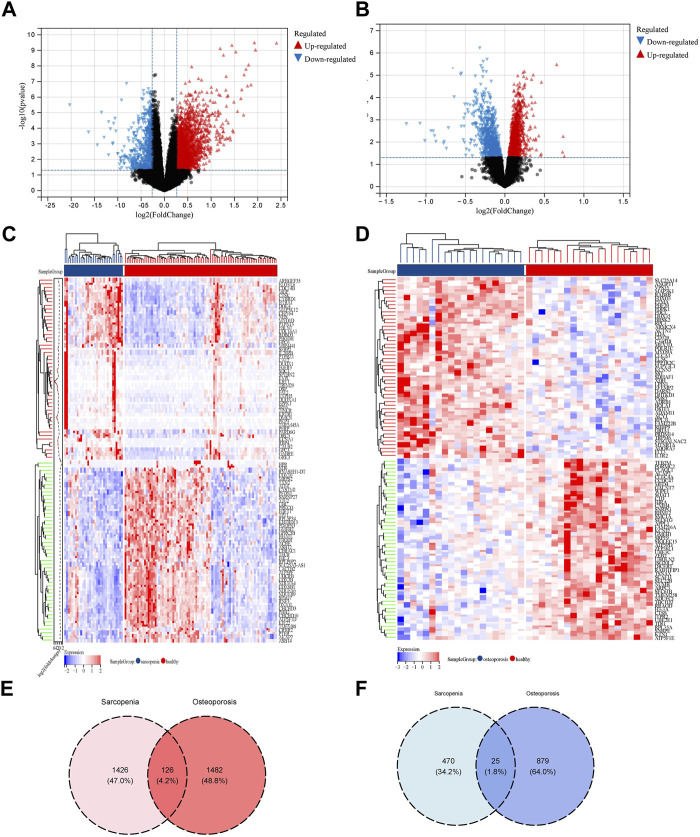
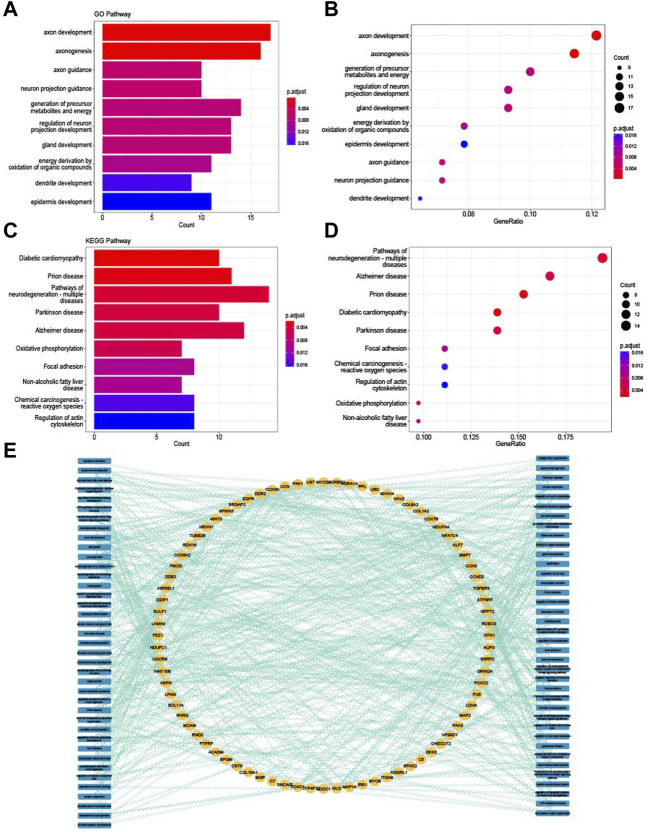
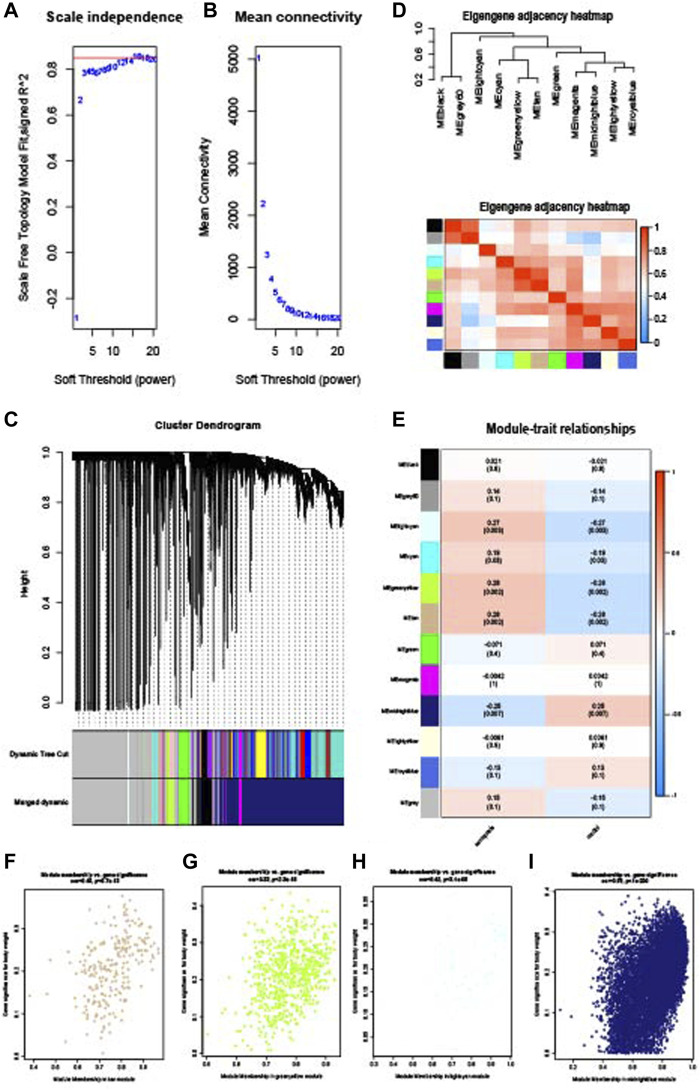
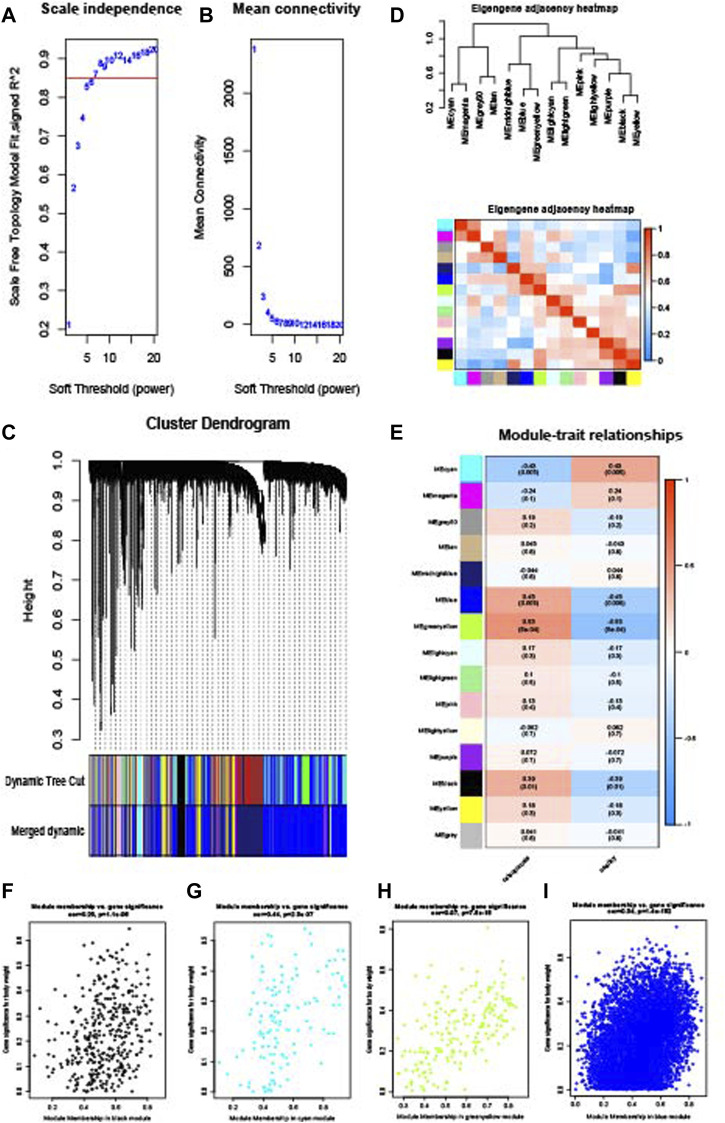
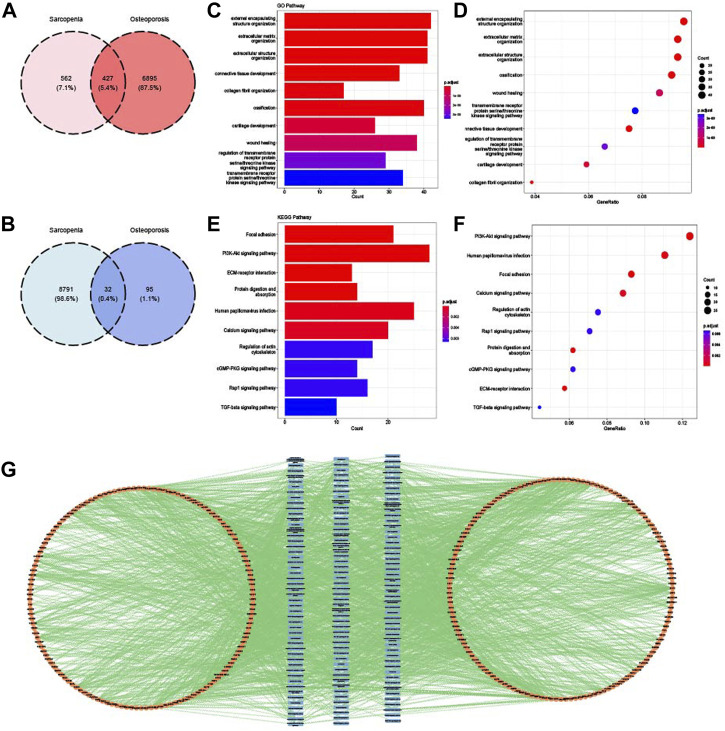
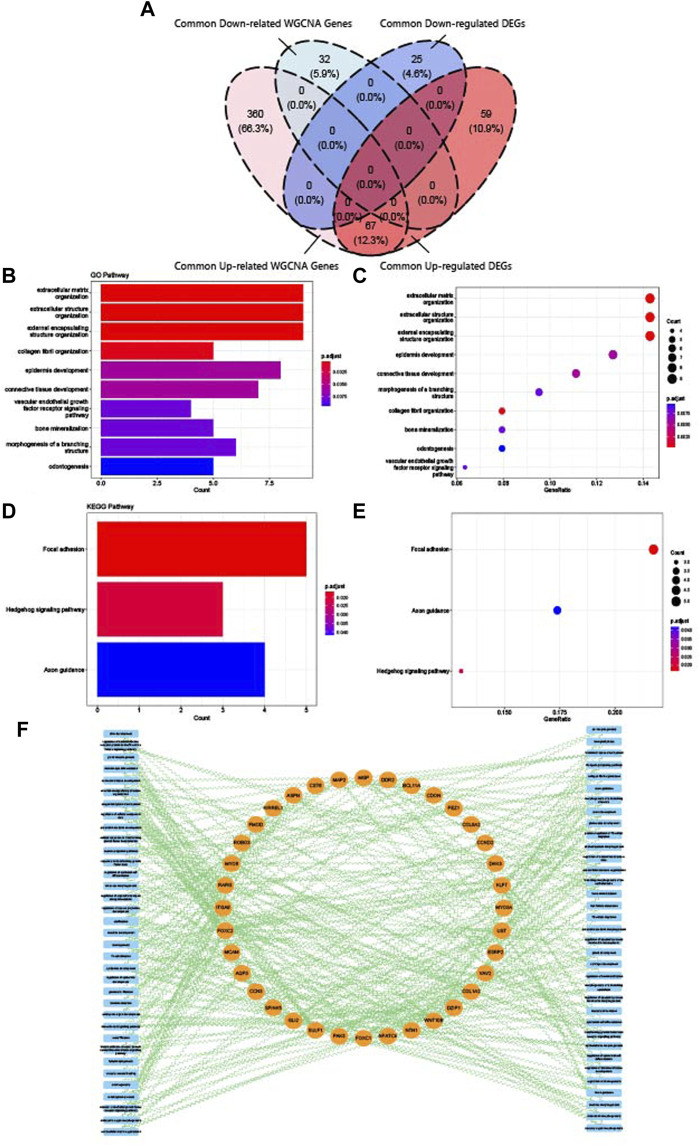
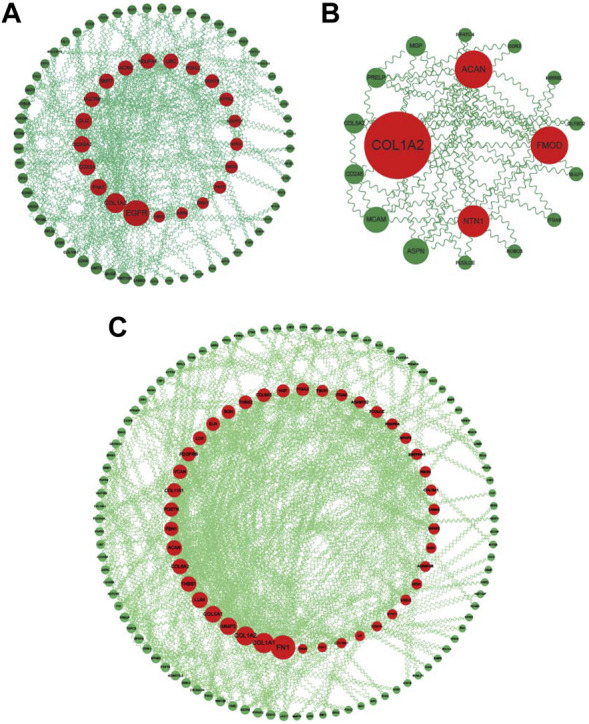
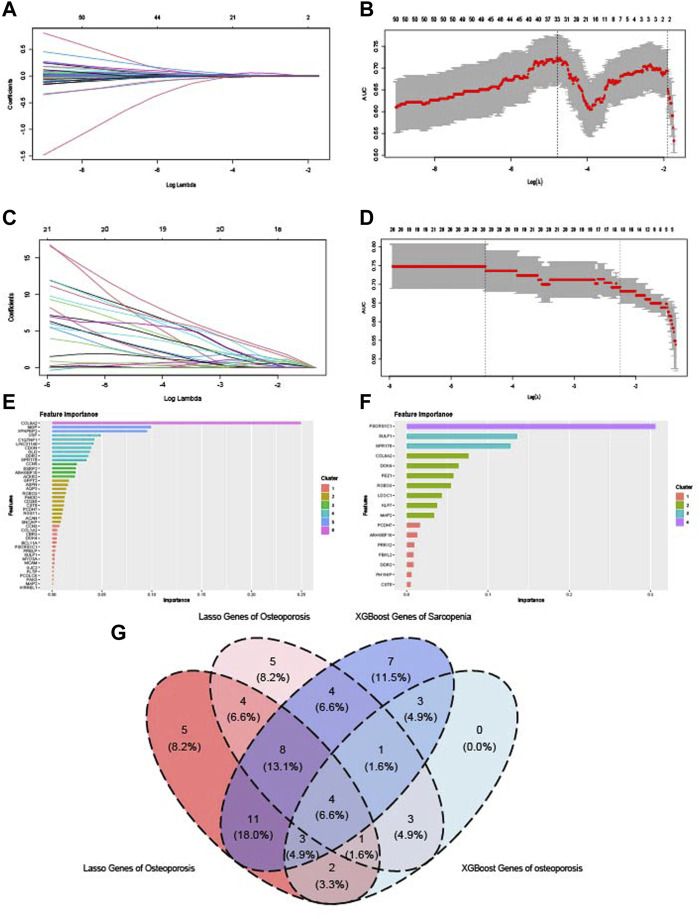
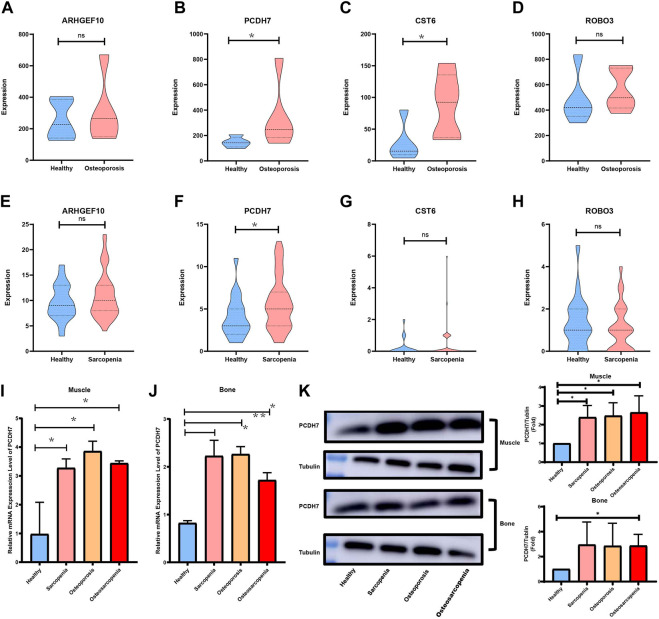
Sarcopenia and osteoporosis, two degenerative diseases in older patients, have become severe health problems in aging societies. Muscles and bones, the most important components of the motor system, are derived from mesodermal and ectodermal mesenchymal stem cells. The adjacent anatomical relationship between them provides the basic conditions for mechanical and chemical signals, which may contribute to the co-occurrence of sarcopenia and osteoporosis. Identifying the potential common crosstalk genes between them may provide new insights for preventing and treating their development. In this study, DEG analysis, WGCNA, and machine learning algorithms were used to identify the key crosstalk genes of sarcopenia and osteoporosis; this was then validated using independent datasets and clinical samples. Finally, four crosstalk genes (ARHGEF10, PCDH7, CST6, and ROBO3) were identified, and mRNA expression and protein levels of PCDH7 in clinical samples from patients with sarcopenia, with osteoporosis, and with both sarcopenia and osteoporosis were found to be significantly higher than those from patients without sarcopenia or osteoporosis. PCDH7 seems to be a key gene related to the development of both sarcopenia and osteoporosis.

Keywords: bioinformatic analysis; crosstalk genes; machine learning; osteoporosis; sarcopenia.


Conflict of interest statement

The authors declare that the research was conducted in the absence of any commercial or financial relationships that could be construed as a potential conflict of interest.

Figures

FIGURE 1
FIGURE 1
Study’s flow chart.
FIGURE 2
FIGURE 2
Identification of DEGs related to the co-occurrence of sarcopenia and osteoporosis. (A) Volcano plot of DEGs of sarcopenia: blue dots represent downregulated genes in sarcopenia, red dots represent upregulated genes. (B) Volcano plot of DEGs of osteoporosis: the blue dots represent downregulated genes in osteoporosis, red dots represent upregulated genes. (C) Heatmap of top 50 genes in sarcopenia: genes in blue were downregulated in sarcopenia, while those in red were upregulated. (D) Heatmap of top 50 genes in osteoporosis: genes in blue were downregulated in osteoporosis, while those in red were upregulated. (E) Venn diagram of the intersection of upregulated DEGs in sarcopenia and osteoporosis. (F) Venn diagram of the intersection of downregulated DEGs in sarcopenia and osteoporosis.
FIGURE 3
FIGURE 3
Enrichment analysis of common DEGs. (A) Top 10 GO BP terms of common DEGs visualized as bar plot. (B) Top 10 GO BP terms of common DEGs visualized as dot plot. (C) Top 10 KEGG terms of common DEGs visualized as bar plot. (D) Top 10 KEGG terms of common DEGs visualized as dot plot. (E) Network of relationships between common DEGs and GO and KEGG pathways.
FIGURE 4
FIGURE 4
WGCNA of the sarcopenia dataset. (A) Selection of soft threshold. (B) Connectivity of different soft thresholds. (C) Cluster dendrogram before and after merge of modules. (D) Correlations of modules. (E) Correlations between modules and sarcopenia. (F) Scatter plots of gene significance in tan module. (G) Scatter plots of gene significance in the green–yellow module. (H) Scatter plots of gene significance in the light cyan module. (I) Scatter plots of gene significance in the midnight blue module.
FIGURE 5
FIGURE 5
WGCNA of the osteoporosis dataset. (A) Selection of soft threshold. (B) Connectivity of different soft thresholds. (C) Cluster dendrogram before and after merge of modules. (D) Correlations of modules. (E) Correlations between modules and osteoporosis. (F) Scatter plots of gene significance in the black module. (G) Scatter plots of gene significance in the cyan module. (H) Scatter plots of gene significance in the green–yellow module. (I) Scatter plots of gene significance in the blue module.
FIGURE 6
FIGURE 6
Identification and enrichment analysis of common WGCNA genes. (A) Venn diagram of the intersection of upregulated WGCNA module genes in sarcopenia and osteoporosis. (B) Venn diagram of the intersection of downregulated WGCNA module genes in sarcopenia and osteoporosis. (C) Top 10 GO BP terms of common WGCNA genes visualized as bar plot. (D) Top 10 GO BP terms of common WGCNA genes visualized as dot plot. (E) Top 10 KEGG terms of common WGCNA genes visualized as bar plot. (F) Top 10 KEGG terms of common WGCNA genes visualized as dot plot. (G) Network of relationships between common WGCNA genes and GO and KEGG pathways.
FIGURE 7
FIGURE 7
Identification and enrichment analysis of crosstalk genes. (A) Venn diagram of the intersection of upregulated common DEGs, downregulated common DEGs, upregulated common WGCNA genes, and downregulated common WGCNA genes. (B) Top 10 GO BP terms of crosstalk genes visualized as bar plot. (C) Top 10 GO BP terms of crosstalk genes visualized as dot plot. (D) Top 3 KEGG terms of crosstalk genes visualized as bar plot. (E) Top three KEGG terms of crosstalk genes visualized as dot plot. (F) Network of relationships between crosstalk genes and GO and KEGG pathways.
FIGURE 8
FIGURE 8
PPI networks of common DEGs, WGCNA genes, and crosstalk genes. (A) PPI network of common DEGs: genes ranked by size according to degree score in Cytoscape. (B) PPI network of common crosstalk genes: genes ranked by size according to degree score in Cytoscape. (C) PPI network of common WGCNA genes: genes ranked by size according to degree score in Cytoscape.
FIGURE 9
FIGURE 9
Identification of key crosstalk genes by LASSO analysis and XGBoost algorithm. (A,B) LASSO model constructed on the sarcopenia dataset. (C,D) LASSO model constructed on the osteoporosis dataset. (E) Importance of genes calculated by XGBoost algorithm in the sarcopenia dataset. (F) Importance of genes calculated by XGBoost algorithm in osteoporosis dataset. (G) Venn diagram of the intersection of genes with significant importance calculated by LASSO and XGBoost algorithm.
FIGURE 10
FIGURE 10
Validation of key crosstalk genes in independent datasets and experience. (A) Comparison of mRNA expression levels of ARHGEF10 in the sarcopenia dataset. (B) Comparison of mRNA expression levels of PCDH7 in the sarcopenia dataset. (C) Comparison of mRNA expression levels of CST6 in the sarcopenia dataset. (D) Comparison of mRNA expression levels of ROBO3 in the sarcopenia dataset. (E) Comparison of mRNA expression levels of ARHGEF10 in the osteoporosis dataset. (F) Comparison of mRNA expression levels of PCDH7 in the osteoporosis dataset. (G) Comparison of mRNA expression levels of CST6 in the osteoporosis dataset. (H) Comparison of mRNA expression levels of ROBO3 in the osteoporosis dataset. (I) Comparison of mRNA expression levels of PCDH7 in muscle samples. (J) Comparison of mRNA expression levels of PCDH7 in bone samples. (K) Protein levels of PCDH7 in muscle and bone samples.
FIGURE 11
FIGURE 11
Immune infiltration analysis of sarcopenia. (A) Relative percentage of 22 immune cell subpopulations in the sarcopenia dataset. (B) Correlations between immune cell subpopulations and key crosstalk genes. (C) Heatmap of immune cell subpopulations in the sarcopenia dataset. (D) Correlations between immune cell subpopulations. (E) Box plot of immune cell subpopulations in the sarcopenia dataset.

Similar articles

Cited by

References

    1. Abiko H., Fujiwara S., Ohashi K., Hiatari R., Mashiko T., Sakamoto N., et al. (2015). Rho guanine nucleotide exchange factors involved in cyclic-stretch-induced reorientation of vascular endothelial cells. J. Cell. Sci. 128 (9), 1683–1695. 10.1242/jcs.157503 - DOI - PubMed
    1. Aoki Y., Furukawa K., Suzuki D., Takayashiki T., Kuboki S., Takano S., et al. (2022). Influence of sarcopenia as defined by EWGSOP2 on complications after pancreaticoduodenectomy and on the prognosis of pancreatic head cancer: A prospective cohort study. Nutrition 99-100, 111660. 10.1016/j.nut.2022.111660 - DOI - PubMed
    1. Bakker A. D., Gakes T., Hogervorst J. M., de Wit G. M., Klein-Nulend J., Jaspers R. T. (2016). Mechanical stimulation and IGF-1 enhance mRNA translation rate in osteoblasts via activation of the AKT-mTOR pathway. J. Cell. Physiol. 231 (6), 1283–1290. 10.1002/jcp.25228 - DOI - PubMed
    1. Bencivenga L., Strumia M., Rolland Y., Martinez L., Cestac P., Guyonnet S., et al. (2022). Biomarkers of mitochondrial dysfunction and inflammaging in older adults and blood pressure variability. Geroscience 45, 797–809. 10.1007/s11357-022-00697-y - DOI - PMC - PubMed
    1. Bren-Mattison Y., Hausburg M., Olwin B. B. (2011). Growth of limb muscle is dependent on skeletal-derived Indian hedgehog. Dev. Biol. 356 (2), 486–495. 10.1016/j.ydbio.2011.06.002 - DOI - PMC - PubMed