Effects of Sulforaphane on SARS‑CoV‑2 infection and NF‑κB dependent expression of genes involved in the COVID‑19 'cytokine storm'
- PMID: 37477130
- PMCID: PMC10555481
- DOI: 10.3892/ijmm.2023.5279
Effects of Sulforaphane on SARS‑CoV‑2 infection and NF‑κB dependent expression of genes involved in the COVID‑19 'cytokine storm'
Abstract
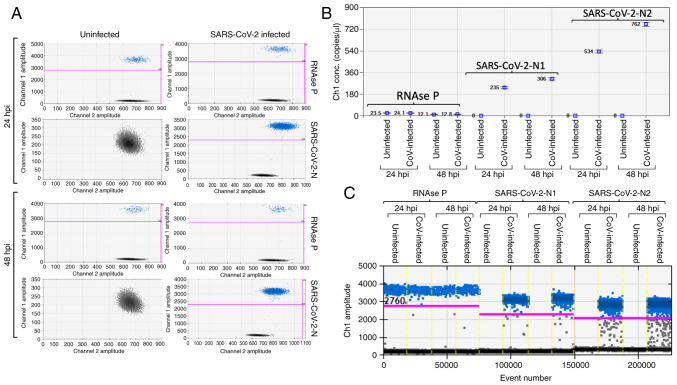
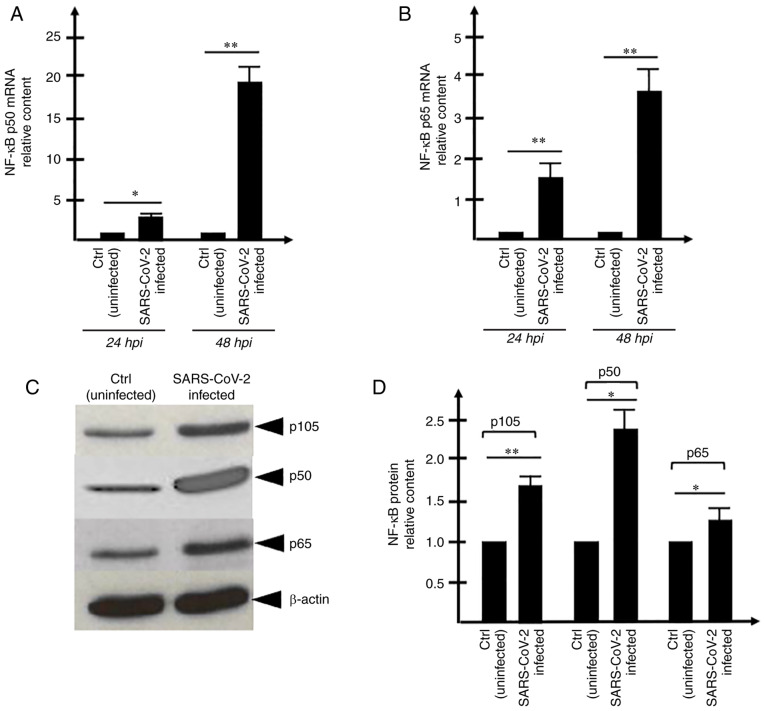
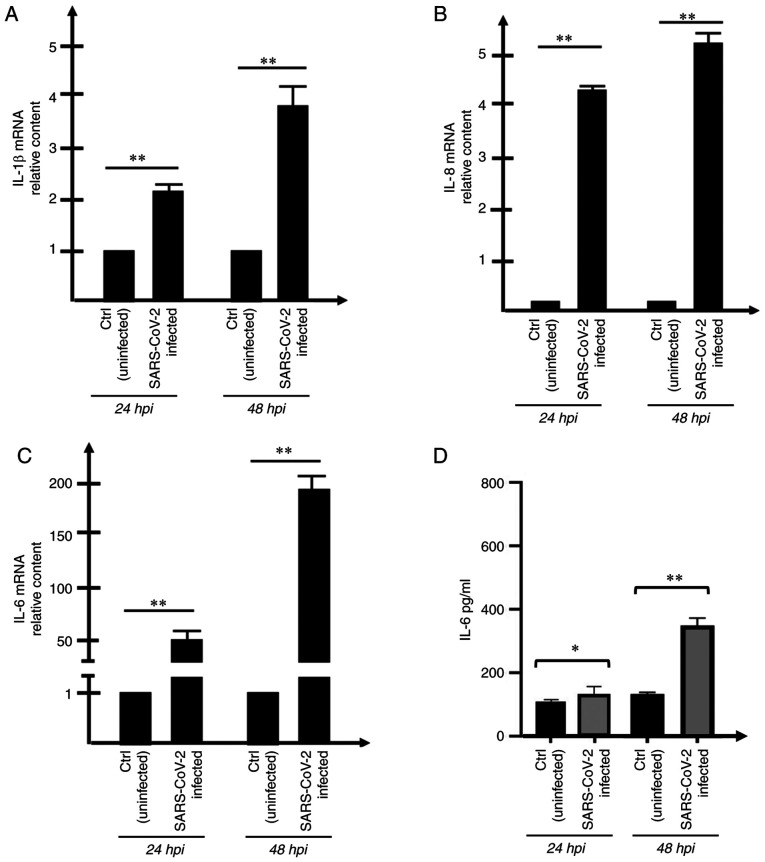
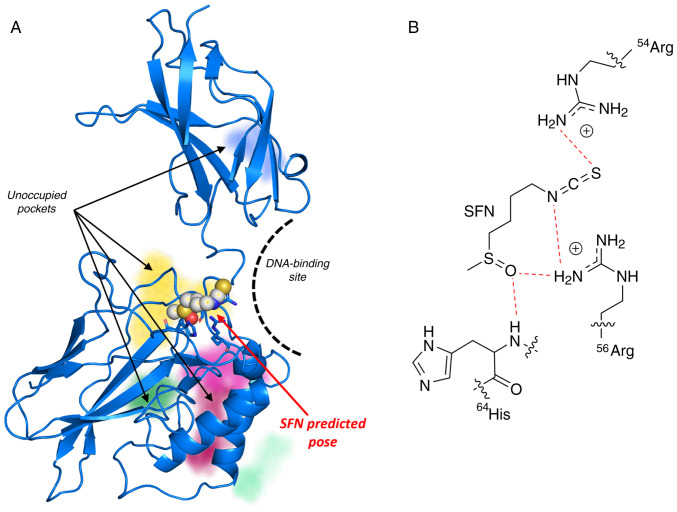
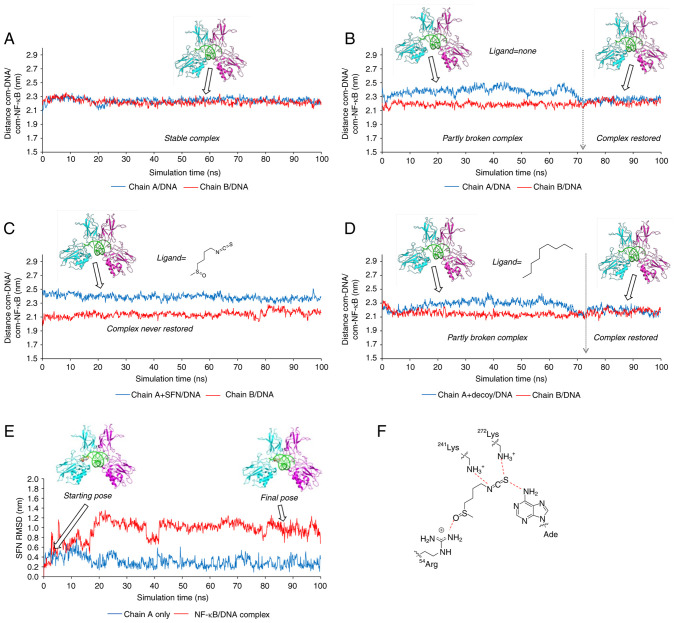
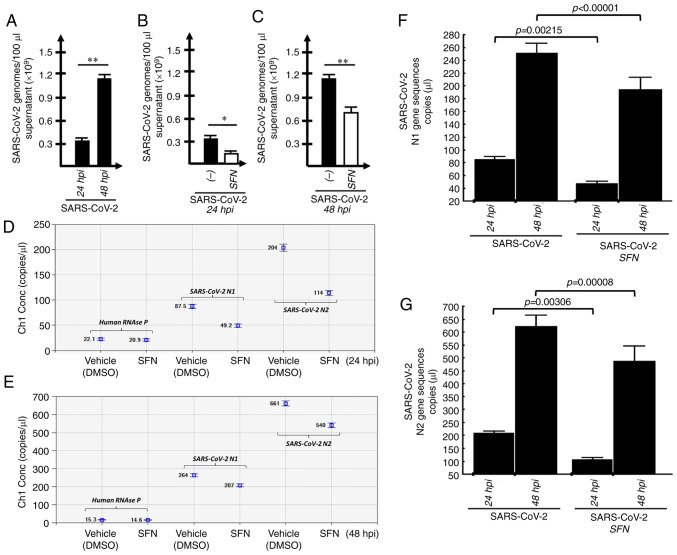
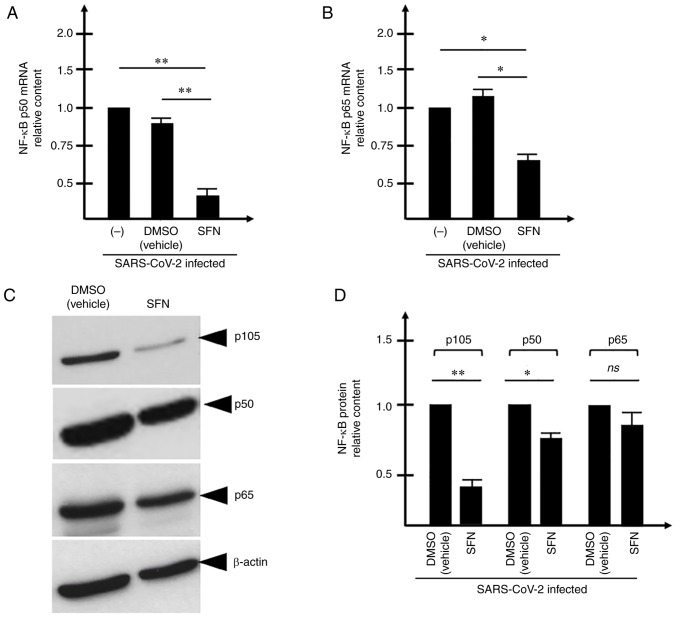
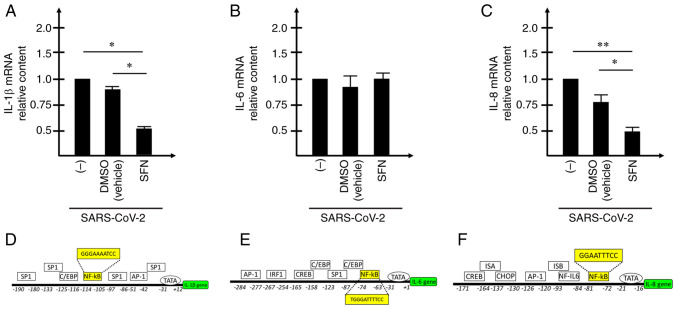
Since its spread at the beginning of 2020, the coronavirus disease 2019 (COVID‑19) pandemic represents one of the major health problems. Despite the approval, testing, and worldwide distribution of anti‑severe acute respiratory syndrome coronavirus 2 (SARS‑CoV‑2) vaccines, the development of specific antiviral agents targeting the SARS‑CoV‑2 life cycle with high efficiency, and/or interfering with the associated 'cytokine storm', is highly required. A recent study, conducted by the authors' group indicated that sulforaphane (SFN) inhibits the expression of IL‑6 and IL‑8 genes induced by the treatment of IB3‑1 bronchial cells with a recombinant spike protein of SARS‑CoV‑2. In the present study, the ability of SFN to inhibit SARS‑CoV‑2 replication and the expression of pro‑inflammatory genes encoding proteins of the COVID‑19 'cytokine storm' was evaluated. SARS‑CoV‑2 replication was assessed in bronchial epithelial Calu‑3 cells. Moreover, SARS‑CoV‑2 replication and expression of pro‑inflammatory genes was evaluated by reverse transcription quantitative droplet digital PCR. The effects on the expression levels of NF‑κB were assessed by western blotting. Molecular dynamics simulations of NF‑kB/SFN interactions were conducted with Gromacs 2021.1 software under the Martini 2 CG force field. Computational studies indicated that i) SFN was stably bound with the NF‑κB monomer; ii) a ternary NF‑kB/SFN/DNA complex was formed; iii) the SFN interacted with both the protein and the nucleic acid molecules modifying the binding mode of the latter, and impairing the full interaction between the NF‑κB protein and the DNA molecule. This finally stabilized the inactive complex. Molecular studies demonstrated that SFN i) inhibits the SARS‑CoV‑2 replication in infected Calu‑3 cells, decreasing the production of the N‑protein coding RNA sequences, ii) decreased NF‑κB content in SARS‑CoV‑2 infected cells and inhibited the expression of NF‑kB‑dependent IL‑1β and IL‑8 gene expression. The data obtained in the present study demonstrated inhibitory effects of SFN on the SARS‑CoV‑2 life cycle and on the expression levels of the pro‑inflammatory genes, sustaining the possible use of SFN in the management of patients with COVID‑19.
Keywords: COVID‑19; NF‑kB; SARS‑CoV‑2; SFN; nutraceuticals; pro‑inflammatory genes.
Conflict of interest statement
The authors declare that they have no competing interests.
Figures
Similar articles
-
Sulforaphane inhibits the expression of interleukin-6 and interleukin-8 induced in bronchial epithelial IB3-1 cells by exposure to the SARS-CoV-2 Spike protein.Phytomedicine. 2021 Jul;87:153583. doi: 10.1016/j.phymed.2021.153583. Epub 2021 May 4. Phytomedicine. 2021. PMID: 34033999 Free PMC article.
-
SARS‑CoV‑2 spike protein‑induced host inflammatory response signature in human corneal epithelial cells.Mol Med Rep. 2021 Aug;24(2):584. doi: 10.3892/mmr.2021.12223. Epub 2021 Jun 16. Mol Med Rep. 2021. PMID: 34132373
-
Sulforaphane inhibits cytokine-stimulated chemokine and adhesion molecule expressions in human corneal fibroblasts: Involvement of the MAPK, STAT, and NF-κB signaling pathways.Exp Eye Res. 2022 Mar;216:108946. doi: 10.1016/j.exer.2022.108946. Epub 2022 Jan 14. Exp Eye Res. 2022. PMID: 35038457
-
Host cell entry mediators implicated in the cellular tropism of SARS‑CoV‑2, the pathophysiology of COVID‑19 and the identification of microRNAs that can modulate the expression of these mediators (Review).Int J Mol Med. 2022 Feb;49(2):20. doi: 10.3892/ijmm.2021.5075. Epub 2021 Dec 22. Int J Mol Med. 2022. PMID: 34935057 Free PMC article. Review.
-
Digestive system infection by SARS‑CoV‑2: Entry mechanism, clinical symptoms and expression of major receptors (Review).Int J Mol Med. 2023 Mar;51(3):19. doi: 10.3892/ijmm.2023.5222. Epub 2023 Jan 20. Int J Mol Med. 2023. PMID: 36660939 Free PMC article. Review.
Cited by
-
Anti-Inflammatory and Neuroprotective Polyphenols Derived from the European Olive Tree, Olea europaea L., in Long COVID and Other Conditions Involving Cognitive Impairment.Int J Mol Sci. 2024 Oct 14;25(20):11040. doi: 10.3390/ijms252011040. Int J Mol Sci. 2024. PMID: 39456822 Free PMC article. Review.
-
Preliminary results and a theoretical perspective of co‑treatment using a miR‑93‑5p mimic and aged garlic extract to inhibit the expression of the pro‑inflammatory interleukin‑8 gene.Exp Ther Med. 2025 Feb 25;29(4):85. doi: 10.3892/etm.2025.12835. eCollection 2025 Apr. Exp Ther Med. 2025. PMID: 40084194 Free PMC article.
-
The Role of the Nuclear Factor-Kappa B (NF-κB) Pathway in SARS-CoV-2 Infection.Pathogens. 2024 Feb 12;13(2):164. doi: 10.3390/pathogens13020164. Pathogens. 2024. PMID: 38392902 Free PMC article. Review.
-
The Potential of Glucosinolates and Their Hydrolysis Products as Inhibitors of Cytokine Storms.Molecules. 2024 Oct 11;29(20):4826. doi: 10.3390/molecules29204826. Molecules. 2024. PMID: 39459194 Free PMC article. Review.
-
Aged Garlic Extract (AGE) and Its Constituent S-Allyl-Cysteine (SAC) Inhibit the Expression of Pro-Inflammatory Genes Induced in Bronchial Epithelial IB3-1 Cells by Exposure to the SARS-CoV-2 Spike Protein and the BNT162b2 Vaccine.Molecules. 2024 Dec 16;29(24):5938. doi: 10.3390/molecules29245938. Molecules. 2024. PMID: 39770027 Free PMC article.
References
-
- Walker PGT, Whittaker C, Watson OJ, Baguelin M, Winskill P, Hamlet A, Djafaara BA, Cucunubá Z, Olivera Mesa D, Green W, et al. The impact of COVID-19 and strategies for mitigation and suppression in low- and middle-income countries. Science. 2020;369:413–422. doi: 10.1126/science.abc0035. - DOI - PMC - PubMed
MeSH terms
Substances
LinkOut - more resources
Full Text Sources
Medical
Research Materials
Miscellaneous