. 2023 Oct 2;83(19):3305-3319.
doi: 10.1158/0008-5472.CAN-23-0128.

Single-Cell Characterization of Pulmonary Nodules Implicates Suppression of Immunosurveillance across Early Stages of Lung Adenocarcinoma

Affiliations

Single-Cell Characterization of Pulmonary Nodules Implicates Suppression of Immunosurveillance across Early Stages of Lung Adenocarcinoma

Jane Yanagawa et al. Cancer Res. .

Abstract

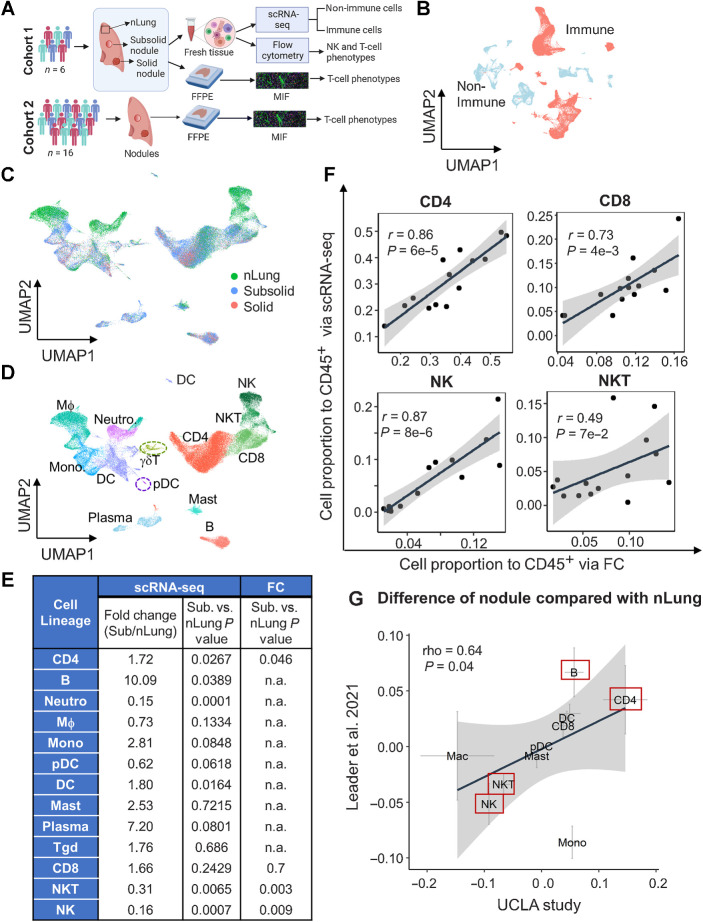
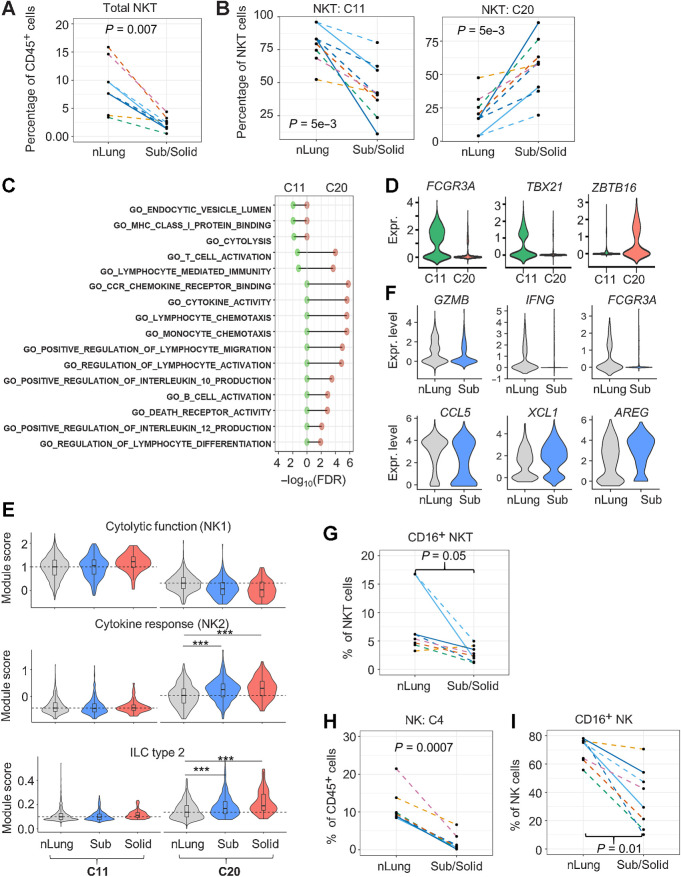
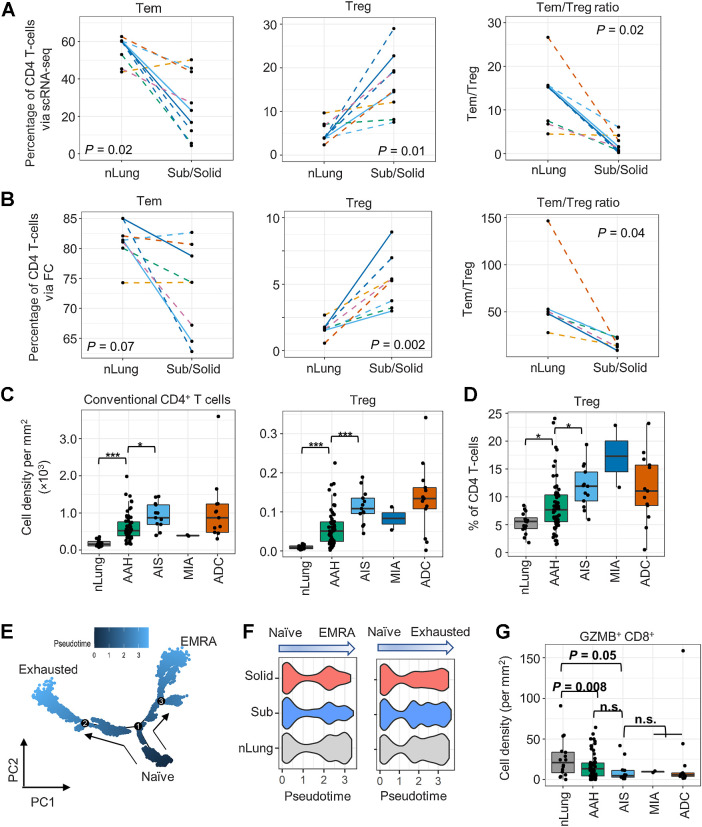
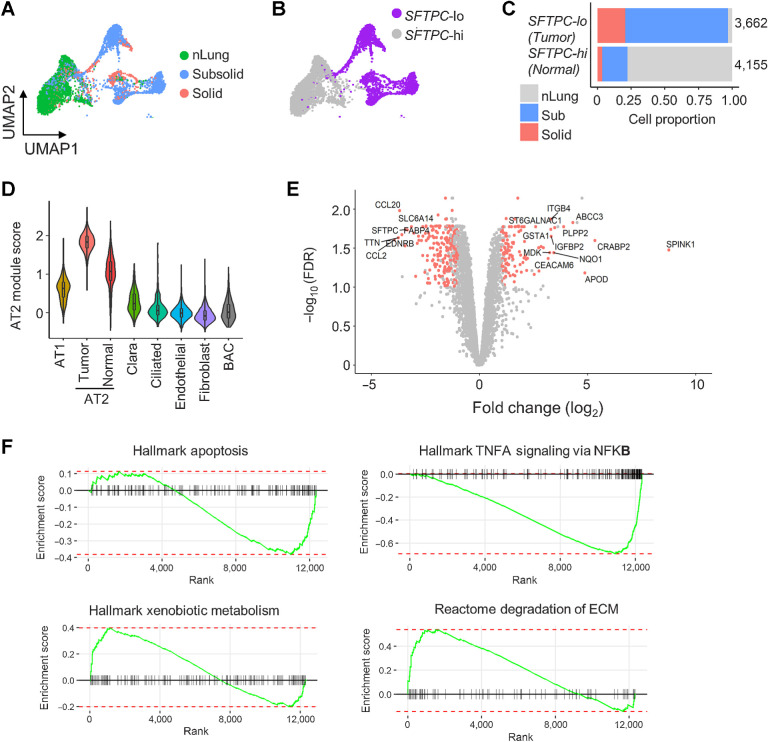
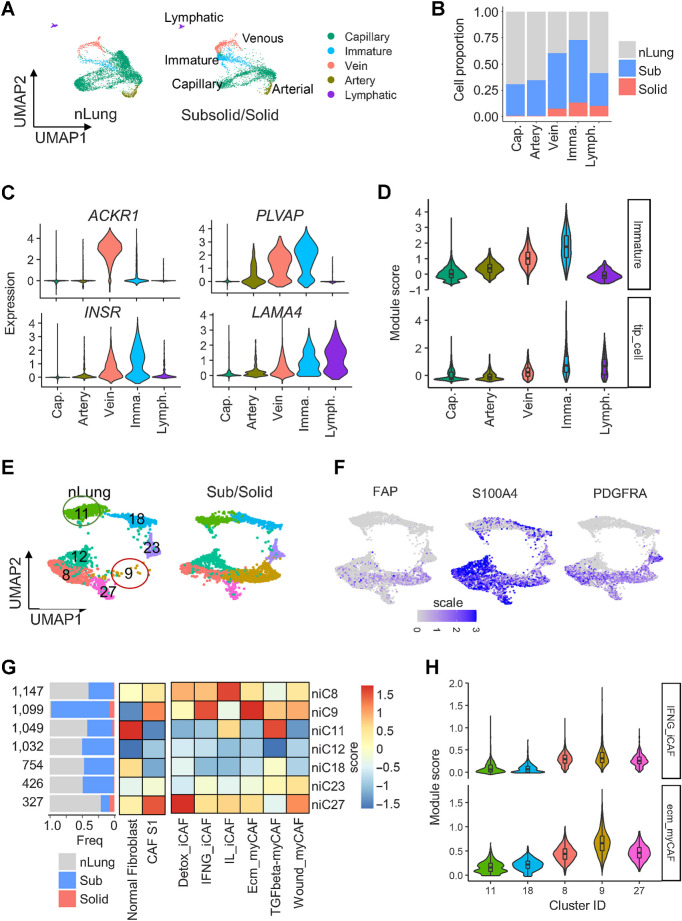
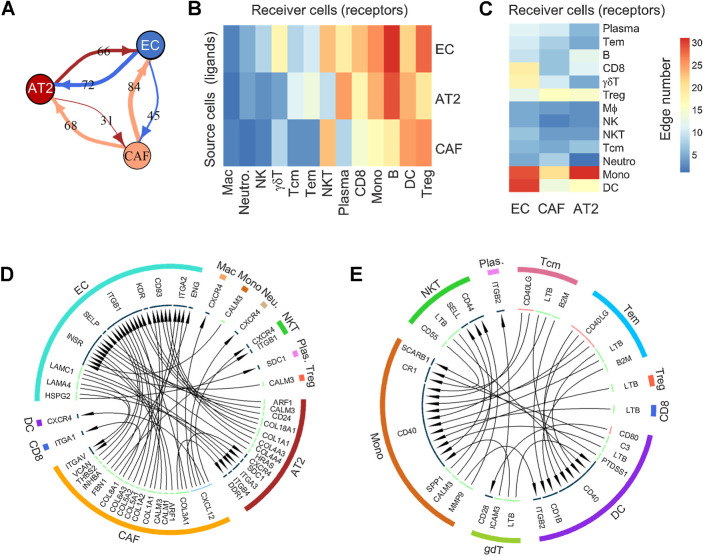
A greater understanding of molecular, cellular, and immunological changes during the early stages of lung adenocarcinoma development could improve diagnostic and therapeutic approaches in patients with pulmonary nodules at risk for lung cancer. To elucidate the immunopathogenesis of early lung tumorigenesis, we evaluated surgically resected pulmonary nodules representing the spectrum of early lung adenocarcinoma as well as associated normal lung tissues using single-cell RNA sequencing and validated the results by flow cytometry and multiplex immunofluorescence (MIF). Single-cell transcriptomics revealed a significant decrease in gene expression associated with cytolytic activities of tumor-infiltrating natural killer and natural killer T cells. This was accompanied by a reduction in effector T cells and an increase of CD4+ regulatory T cells (Treg) in subsolid nodules. An independent set of resected pulmonary nodules consisting of both adenocarcinomas and associated premalignant lesions corroborated the early increment of Tregs in premalignant lesions compared with the associated normal lung tissues by MIF. Gene expression analysis indicated that cancer-associated alveolar type 2 cells and fibroblasts may contribute to the deregulation of the extracellular matrix, potentially affecting immune infiltration in subsolid nodules through ligand-receptor interactions. These findings suggest that there is a suppression of immune surveillance across the spectrum of early-stage lung adenocarcinoma.

Significance: Analysis of a spectrum of subsolid pulmonary nodules by single-cell RNA sequencing provides insights into the immune regulation and cell-cell interactions in the tumor microenvironment during early lung tumor development.


Figures

Figure 1. Single-cell transcriptional profiling of human immune cells in lung nodules and associated normal lung tissue. A, Schematic of cohorts and assays used in this study. B, UMAP plot of immune (red) and nonimmune cells (light blue). C and D, UMAP plot visualizing immune cell clusters colored by tissue types (C) and cell lineages (D), including NK, NKT, CD8, CD4, γδT, B, plasma, mast, DC, pDC, macrophages (MΦ), monocytes (Mono), and neutrophils (Neutro). E, Summary of fold change and their statistical P values between subsolid nodules and nLung for each cell lineage based on scRNA-seq and FC. P values were calculated by the LME model. The abundance of myeloid and B cells was not subjected to assessment (n.a.) by FC. F, Correlation of relative abundance of T (CD4+, CD8+, and NKT) and NK cells identified by scRNA-seq and FC. G, Difference between Stage I tumor (subsolid and solid nodules) and nLung in the UCLA (x-axis) and Leader and colleagues (9) studies (y-axis). Crosses represent mean ± SEM. Red boxes emphasize top lineages altered in both cohorts. (A, Created with BioRender.com.)
Figure 1.
Single-cell transcriptional profiling of human immune cells in lung nodules and associated normal lung tissue. A, Schematic of cohorts and assays used in this study. B, UMAP plot of immune (red) and nonimmune cells (light blue). C and D, UMAP plot visualizing immune cell clusters colored by tissue types (C) and cell lineages (D), including NK, NKT, CD8, CD4, γδT, B, plasma, mast, DC, pDC, macrophages (MΦ), monocytes (Mono), and neutrophils (Neutro). E, Summary of fold change and their statistical P values between subsolid nodules and nLung for each cell lineage based on scRNA-seq and FC. P values were calculated by the LME model. The abundance of myeloid and B cells was not subjected to assessment (n.a.) by FC. F, Correlation of relative abundance of T (CD4+, CD8+, and NKT) and NK cells identified by scRNA-seq and FC. G, Difference between Stage I tumor (subsolid and solid nodules) and nLung in the UCLA (x-axis) and Leader and colleagues (9) studies (y-axis). Crosses represent mean ± SEM. Red boxes emphasize top lineages altered in both cohorts. (A, Created with BioRender.com.)
Figure 2. Reduction of infiltrating cytolytic NKT and NK cells in subsolid nodules. A, Relative abundance of NKT cells among CD45+ cells in each sample (dot). B, The percentage of NKT subtypes in each sample (dot). C, Immune-regulated pathways enriched by markers identified in NKT clusters, C11 (left) and C20 (right). D, NKT marker expression (Expr.) associated with cytolytic activity (FCGR3A/CD16) and NKT subtypes 1 (TBX21) and 2 (ZBTB16). E, Violin plots illustrating the distribution of the functional NKT gene module scores in various clusters and nodule types. Dashed lines represent the median scores of nLung cells in the selected clusters. ***, P < 1e−10 based on the rank-based Wilcoxon test. F, Top DEGs (P < 1e−5) between nLung and nodule-associated C20 NKT cells. G, Relative abundance of CD16+ NKT cells in each sample (dots) assessed by FC. H, Relative abundance of NK cells (cluster 4) to total immune cells by scRNA-seq. I, Relative abundance of CD16+ NK cells by FC. Each dot in spaghetti plots (A, B, and G–I) represents a sample, with colors representing individual patients. Line patterns indicate the nLung-subsolid (dashed) and nLung-solid (solid) relationships from the same patient. P values were calculated on the basis of the LME model to compare either subsolid nodules (A, B, and I) or both sub- and solid nodules (G and H) and nLung. Data points of solid nodules (A, B, and I) illustrate observations in subsolid were consistent with those in matched solid nodules.
Figure 2.
Reduction of infiltrating cytolytic NKT and NK cells in subsolid nodules. A, Relative abundance of NKT cells among CD45+ cells in each sample (dot). B, The percentage of NKT subtypes in each sample (dot). C, Immune-regulated pathways enriched by markers identified in NKT clusters, C11 (left) and C20 (right). D, NKT marker expression (Expr.) associated with cytolytic activity (FCGR3A/CD16) and NKT subtypes 1 (TBX21) and 2 (ZBTB16). E, Violin plots illustrating the distribution of the functional NKT gene module scores in various clusters and nodule types. Dashed lines represent the median scores of nLung cells in the selected clusters. ***, P < 1e−10 based on the rank-based Wilcoxon test. F, Top DEGs (P < 1e−5) between nLung and nodule-associated C20 NKT cells. G, Relative abundance of CD16+ NKT cells in each sample (dots) assessed by FC. H, Relative abundance of NK cells (cluster 4) to total immune cells by scRNA-seq. I, Relative abundance of CD16+ NK cells by FC. Each dot in spaghetti plots (A,B, and G–I) represents a sample, with colors representing individual patients. Line patterns indicate the nLung-subsolid (dashed) and nLung-solid (solid) relationships from the same patient. P values were calculated on the basis of the LME model to compare either subsolid nodules (A, B, and I) or both sub- and solid nodules (G and H) and nLung. Data points of solid nodules (A, B, and I) illustrate observations in subsolid were consistent with those in matched solid nodules.
Figure 3. Profiles of the CD4+ T-cell subsets in subsolid nodules. A and B, The percentage of CD4+ T cells identified as Tem and Treg cells and Tem:Treg ratio in each sample (dot) via scRNA-seq (A) and FC (B) in the perspective cohort. Line patterns indicate the nLung-subsolid (dashed) and nLung-solid (solid in A and B) relationships from the same patients. C and D, Densities of conventional CD4+ and Treg (C) and percentage of Treg to total CD4+ T cells (D) evaluated by MIF staining in tissue areas (dot) associated with histology (x-axis) in the retrospective cohort. E, Illustration of CD8+ T-cell differentiation pathways inferred by Monocle. F, Distribution of pseudotime scores (x-axis) in tissue types (y-axis) for each differentiation path. G, Density of GZMB+CD8+ T cells in tissue area (dots) associated with histology (x-axis) in the retrospective cohort. n.s., nonsignificant.
Figure 3.
Profiles of the CD4+ T-cell subsets in subsolid nodules. A and B, The percentage of CD4+ T cells identified as Tem and Treg cells and Tem:Treg ratio in each sample (dot) via scRNA-seq (A) and FC (B) in the perspective cohort. Line patterns indicate the nLung-subsolid (dashed) and nLung-solid (solid in A and B) relationships from the same patients. C and D, Densities of conventional CD4+ and Treg (C) and percentage of Treg to total CD4+ T cells (D) evaluated by MIF staining in tissue areas (dot) associated with histology (x-axis) in the retrospective cohort. E, Illustration of CD8+ T-cell differentiation pathways inferred by Monocle. F, Distribution of pseudotime scores (x-axis) in tissue types (y-axis) for each differentiation path. G, Density of GZMB+CD8+ T cells in tissue area (dots) associated with histology (x-axis) in the retrospective cohort. n.s., nonsignificant.
Figure 4. Deregulation of AT2 cells in subsolid nodules. A, AT2 cells from sub- and solid nodules cluster separately from AT2 cells from matching nLung. Colors represent nodule types. B, Two major AT2 clusters identified on the basis of high (hi) or low (lo) SFTPC expression. C, Proportions of SFTPC-high and -low cells obtained from nodules and nLung. Values indicate cell numbers in the respective groups. Colors indicate tissue types. D, Violin plots of module scores representing AT2 lineage marker expression in various nonimmune cell populations. E, Volcano plot representing DEGs between nodule- and nLung-derived AT2 cells. P values (y-axis) and fold changes (x-axis) were calculated by the edgeR approach. The red dots indicate DEGs identified by both edgeR and MAST approaches. F, GSEA plots of the top deregulated pathways in AT2 cells from subsolid/solid nodules compared with nLung.
Figure 4.
Deregulation of AT2 cells in subsolid nodules. A, AT2 cells from sub- and solid nodules cluster separately from AT2 cells from matching nLung. Colors represent nodule types. B, Two major AT2 clusters identified on the basis of high (hi) or low (lo) SFTPC expression. C, Proportions of SFTPC-high and -low cells obtained from nodules and nLung. Values indicate cell numbers in the respective groups. Colors indicate tissue types. D, Violin plots of module scores representing AT2 lineage marker expression in various nonimmune cell populations. E, Volcano plot representing DEGs between nodule- and nLung-derived AT2 cells. P values (y-axis) and fold changes (x-axis) were calculated by the edgeR approach. The red dots indicate DEGs identified by both edgeR and MAST approaches. F, GSEA plots of the top deregulated pathways in AT2 cells from subsolid/solid nodules compared with nLung.
Figure 5. Cancer-associated endothelial cells and fibroblasts enriched in subsolid nodules. A, UMAP plot visualizing the distribution of five EC subtypes in nLung and subsolid/solid nodules. B, Proportion of EC subtypes in nodules and normal lung. Cap, capillary; Imma, immature; Lymph, lymphatic EC. Color indicates tissue type. C, Expression of top DEGs in cancer-associated clusters C14 and C15 compared with other EC clusters. D, Violin plots of module scores of cancer-associated immature stalk and tip-like signatures in EC clusters. E, UMAP plot visualizing seven fibroblast clusters in nLung (left) and subsolid/solid nodules (right). F, Expression of CAF subtype 1 (CAF-S1) markers in fibroblast clusters. G, Fibroblast clusters characterized by tissue-based contribution (left) and gene modules associated with normal fibroblasts, immune regulating CAF-S1 (middle), and six CAF-S1 subgroups (right). The horizontal bar plot (left) indicates tissue type proportions in each cluster. Heat maps represent average scores of gene modules (columns) in clusters (rows). H, Violin plots illustrating the distribution of ecm-myCAF and IFNG-iCAF signature scores in clusters expressing markers associated with normal fibroblast (niC11 and niC18) and immune-regulating CAF-S1 (niC8, 9, and 27).
Figure 5.
Cancer-associated endothelial cells and fibroblasts enriched in subsolid nodules. A, UMAP plot visualizing the distribution of five EC subtypes in nLung and subsolid/solid nodules. B, Proportion of EC subtypes in nodules and normal lung. Cap, capillary; Imma, immature; Lymph, lymphatic EC. Color indicates tissue type. C, Expression of top DEGs in cancer-associated clusters C14 and C15 compared with other EC clusters. D, Violin plots of module scores of cancer-associated immature stalk and tip-like signatures in EC clusters. E, UMAP plot visualizing seven fibroblast clusters in nLung (left) and subsolid/solid nodules (right). F, Expression of CAF subtype 1 (CAF-S1) markers in fibroblast clusters. G, Fibroblast clusters characterized by tissue-based contribution (left) and gene modules associated with normal fibroblasts, immune regulating CAF-S1 (middle), and six CAF-S1 subgroups (right). The horizontal bar plot (left) indicates tissue type proportions in each cluster. Heat maps represent average scores of gene modules (columns) in clusters (rows). H, Violin plots illustrating the distribution of ecm-myCAF and IFNG-iCAF signature scores in clusters expressing markers associated with normal fibroblast (niC11 and niC18) and immune-regulating CAF-S1 (niC8, 9, and 27).
Figure 6. Analysis of ligand–receptor interactions between different cell types. A, Interactions among nonimmune cells. Values on lines indicate the number of activated LR interactions in nodules by comparing their scores to that of nLung. B and C, Heat maps illustrating the number of unidirectional interactions from nonimmune to immune cells (B) and vice versa (C) activated in nodules compared with nLung. Rows indicate the source cells expressing ligand, whereas columns represent receiver cells expressing receptor genes. D and E, Circos plot illustrating the unidirectional LR interactions among non- and immune cells (D) and among immune cells (E) due to the differentially expressed ligands and receptors between nodule and nLung in the indicated cell types.
Figure 6.
Analysis of ligand–receptor interactions between different cell types. A, Interactions among nonimmune cells. Values on lines indicate the number of activated LR interactions in nodules by comparing their scores to that of nLung. B and C, Heat maps illustrating the number of unidirectional interactions from nonimmune to immune cells (B) and vice versa (C) activated in nodules compared with nLung. Rows indicate the source cells expressing ligand, whereas columns represent receiver cells expressing receptor genes. D and E, Circos plot illustrating the unidirectional LR interactions among non- and immune cells (D) and among immune cells (E) due to the differentially expressed ligands and receptors between nodule and nLung in the indicated cell types.

References

    1. Mazzone PJ, Lam L. Evaluating the patient with a pulmonary nodule: a review. JAMA 2022;327:264–73. - PubMed
    1. Travis WD, Asamura H, Bankier AA, Beasley MB, Detterbeck F, Flieder DB, et al. The IASLC lung cancer staging project: proposals for coding t categories for subsolid nodules and assessment of tumor size in part-solid tumors in the forthcoming eighth edition of the TNM classification of lung cancer. J Thorac Oncol 2016;11:1204–23. - PubMed
    1. McWilliams A, Tammemagi MC, Mayo JR, Roberts H, Liu G, Soghrati K, et al. Probability of cancer in pulmonary nodules detected on first screening CT. N Engl J Med 2013;369:910–9. - PMC - PubMed
    1. Blackburn EH. Cancer interception. Cancer Prev Res 2011;4:787–92. - PubMed
    1. Kadara H, Choi M, Zhang J, Parra ER, Rodriguez-Canales J, Gaffney SG, et al. Whole-exome sequencing and immune profiling of early-stage lung adenocarcinoma with fully annotated clinical follow-up. Ann Oncol 2017;28:75–82. - PMC - PubMed

Publication types

MeSH terms