

An in vitro model of human hematopoiesis identifies a regulatory role for the aryl hydrocarbon receptor
- PMID: 37477592
- PMCID: PMC10589788
- DOI: 10.1182/bloodadvances.2023010169
An in vitro model of human hematopoiesis identifies a regulatory role for the aryl hydrocarbon receptor
Abstract
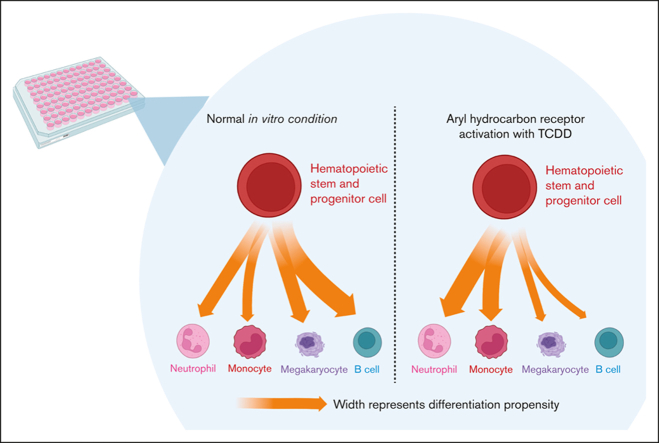
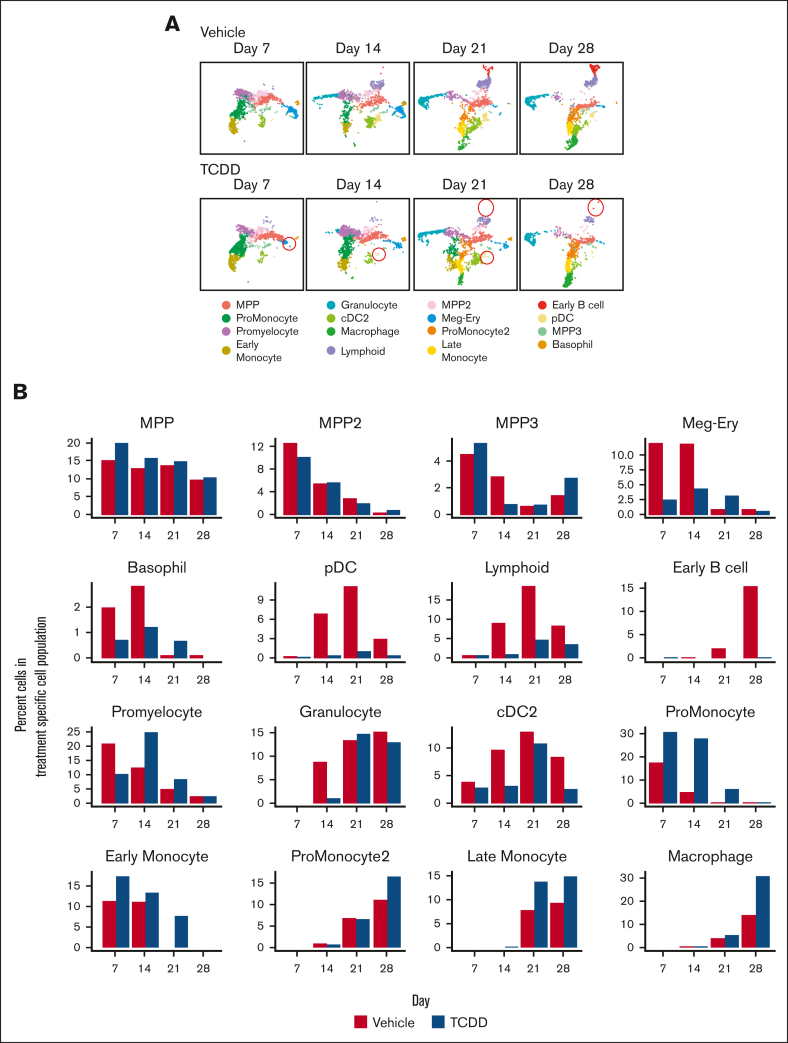
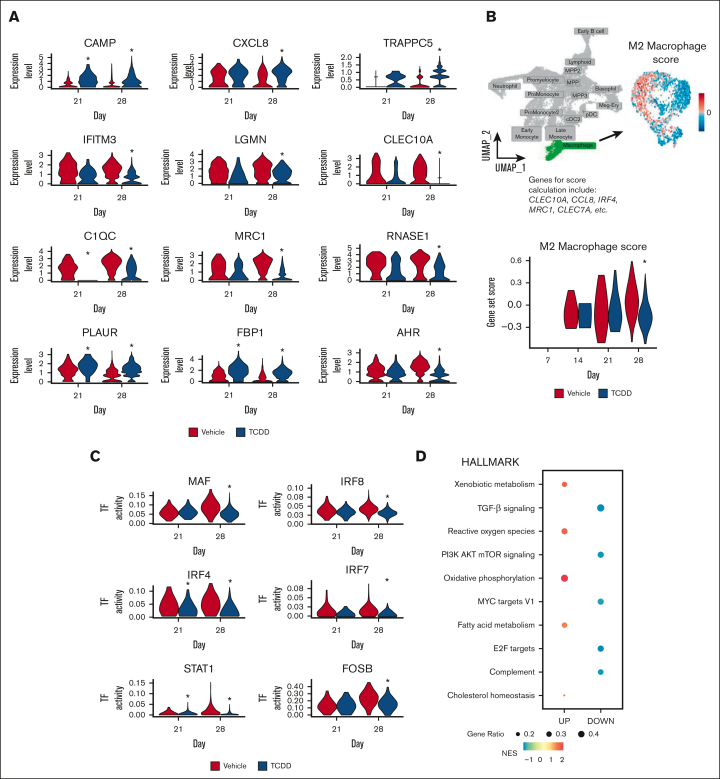
In vitro models to study simultaneous development of different human immune cells and hematopoietic lineages are lacking. We identified and characterized, using single-cell methods, an in vitro stromal cell-free culture system of human hematopoietic stem and progenitor cell (HSPC) differentiation that allows concurrent development of multiple immune cell lineages. The aryl hydrocarbon receptor (AHR) is a ligand-activated transcription factor influencing many biological processes in diverse cell types. Using this in vitro model, we found that AHR activation by the highly specific AHR ligand, 2,3,7,8-tetrachlorodibenzo-p-dioxin, drives differentiation of human umbilical cord blood-derived CD34+ HSPCs toward monocytes and granulocytes with a significant decrease in lymphoid and megakaryocyte lineage specification that may lead to reduced immune competence. To our knowledge, we also discovered for the first time, using single-cell modalities, that AHR activation decreased the expression of BCL11A and IRF8 in progenitor cells, which are critical genes involved in hematopoietic lineage specification processes at both transcriptomic and protein levels. Our in vitro model of hematopoiesis, coupled with single-cell tools, therefore allows for a better understanding of the role played by AHR in modulating hematopoietic differentiation.
Licensed under Creative Commons Attribution-NonCommercial-NoDerivatives 4.0 International (CC BY-NC-ND 4.0), permitting only noncommercial, nonderivative use with attribution.
Conflict of interest statement
Conflict-of-interest disclosure: The authors declare no competing financial interests.
Figures


Similar articles
-
Regulation of in vitro human hematopoietic differentiation by dioxin-like compounds.Toxicology. 2025 Jun;514:154136. doi: 10.1016/j.tox.2025.154136. Epub 2025 Apr 3. Toxicology. 2025. PMID: 40187479
-
The aryl hydrocarbon receptor directs hematopoietic progenitor cell expansion and differentiation.Blood. 2013 Jul 18;122(3):376-85. doi: 10.1182/blood-2012-11-466722. Epub 2013 May 30. Blood. 2013. PMID: 23723449 Free PMC article.
-
Aryl Hydrocarbon Receptor Activation Suppresses EBF1 and PAX5 and Impairs Human B Lymphopoiesis.J Immunol. 2017 Nov 15;199(10):3504-3515. doi: 10.4049/jimmunol.1700289. Epub 2017 Oct 4. J Immunol. 2017. PMID: 28978690 Free PMC article.
-
Advances in the role of the aryl hydrocarbon receptor to regulate early hematopoietic development.Curr Opin Hematol. 2018 Jul;25(4):273-278. doi: 10.1097/MOH.0000000000000432. Curr Opin Hematol. 2018. PMID: 29697485 Review.
-
The aryl hydrocarbon receptor has a normal function in the regulation of hematopoietic and other stem/progenitor cell populations.Biochem Pharmacol. 2009 Feb 15;77(4):577-87. doi: 10.1016/j.bcp.2008.10.001. Epub 2008 Oct 15. Biochem Pharmacol. 2009. PMID: 18983985 Free PMC article. Review.
Cited by
-
Regulation of in vitro human hematopoietic differentiation by dioxin-like compounds.Toxicology. 2025 Jun;514:154136. doi: 10.1016/j.tox.2025.154136. Epub 2025 Apr 3. Toxicology. 2025. PMID: 40187479
-
Application of Single Cell Methods in Immunometabolism and Immunotoxicology.Curr Opin Toxicol. 2024 Sep;39:100488. doi: 10.1016/j.cotox.2024.100488. Epub 2024 Jun 22. Curr Opin Toxicol. 2024. PMID: 39091379 Free PMC article.
-
CD9 and Aryl Hydrocarbon Receptor Are Markers of Human CD19+CD14+ Atypical B Cells and Are Dysregulated in Systemic Lupus Erythematous Disease.J Immunol. 2024 Oct 15;213(8):1076-1092. doi: 10.4049/jimmunol.2400193. J Immunol. 2024. PMID: 39212542
-
Role of the Aryl Hydrocarbon Receptor in the Self-Renewal, Differentiation, and Immunomodulation of Adult Stem Cells.Immune Netw. 2025 Feb 5;25(2):e1. doi: 10.4110/in.2025.25.e1. eCollection 2025 Apr. Immune Netw. 2025. PMID: 40342843 Free PMC article. Review.
-
Unique challenges and best practices for single cell transcriptomic analysis in toxicology.Curr Opin Toxicol. 2024 Jun;38:100475. doi: 10.1016/j.cotox.2024.100475. Epub 2024 Mar 29. Curr Opin Toxicol. 2024. PMID: 38645720 Free PMC article.
References
-
- Flores-Guzman P, Gutierrez-Rodriguez M, Mayani H. In vitro proliferation, expansion, and differentiation of a CD34+ cell-enriched hematopoietic cell population from human umbilical cord blood in response to recombinant cytokines. Arch Med Res. 2002;33(2):107–114. - PubMed
-
- Kraus H, Kaiser S, Aumann K, et al. A feeder-free differentiation system identifies autonomously proliferating B cell precursors in human bone marrow. J Immunol. 2014;192(3):1044–1054. - PubMed
Publication types
MeSH terms
Substances
Grants and funding
LinkOut - more resources
Full Text Sources
Medical
Molecular Biology Databases
