. 2023 Oct;27(10):4719-4727.
doi: 10.1109/JBHI.2023.3297927. Epub 2023 Oct 5.

Prediction of Return of Spontaneous Circulation in a Pediatric Swine Model of Cardiac Arrest Using Low-Resolution Multimodal Physiological Waveforms

Prediction of Return of Spontaneous Circulation in a Pediatric Swine Model of Cardiac Arrest Using Low-Resolution Multimodal Physiological Waveforms

Luiz Eduardo V Silva et al. IEEE J Biomed Health Inform. 2023 Oct.

Abstract

Monitoring physiological waveforms, specifically hemodynamic variables (e.g., blood pressure waveforms) and end-tidal CO2 (EtCO2), during pediatric cardiopulmonary resuscitation (CPR) has been demonstrated to improve survival rates and outcomes when compared to standard depth-guided CPR. However, waveform guidance has largely been based on thresholds for single parameters and therefore does not leverage all the information contained in multimodal data. We hypothesize that the combination of multimodal physiological features improves the prediction of the return of spontaneous circulation (ROSC), the clinical indicator of short-term CPR success. We used machine learning algorithms to evaluate features extracted from eight low-resolution (4 samples per minute) physiological waveforms to predict ROSC. The waveforms were acquired from the 2nd to 10th minute of CPR in pediatric swine models of cardiac arrest (N = 89, 8-12 kg). The waveforms were divided into segments with increasing length (both forward and backward) for feature extraction, and machine learning algorithms were trained for ROSC prediction. For the full CPR period (2nd to 10th minute), the area under the receiver operating characteristics curve (AUC) was 0.93 (95% CI: 0.87-0.99) for the multivariate model, 0.70 (0.55-0.85) for EtCO2 and 0.80 (0.67-0.93) for coronary perfusion pressure. The best prediction performances were achieved when the period from the 6th to the 10th minute was included. Poor predictions were observed for some individual waveforms, e.g., right atrial pressure. In conclusion, multimodal waveform features carry relevant information for ROSC prediction. Using multimodal waveform features in CPR guidance has the potential to improve resuscitation success and reduce mortality.


Figures

Fig. 1.
Fig. 1.
Study cohort flow diagram. ROSC: return of spontaneous circulation.
Fig. 2.
Fig. 2.
Illustration of the segmentation process. The original waveform (2nd to 10th minute, gray series) was split into forward (blue) and backward (red) segments. Forward segments start from the 2nd minute and progressively include the latter periods of CPR. In contrast, backward segments finish in the 10th minute and progressively include the earlier periods of CPR.
Fig. 3.
Fig. 3.
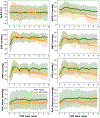
Time courses of the eight waveforms used in this study. Solid lines are the median and shaded areas are the interquartile range over the 89 animals. SpO2: peripheral oxygen saturation; EtCO2: end-tidal carbon dioxide; SBP: systolic arterial blood pressure; DBP: diastolic arterial blood pressure; MAP: mean arterial blood pressure; CPP: coronary artery blood pressure; RaP_Mean: mean right atrial blood pressure; RaP_Diastole: diastolic right atrial blood pressure; mmHg: millimeters of mercury.
Fig. 4.
Fig. 4.
Area under the ROC and PR curve (AUC) and 95% of confidence interval obtained for models created using each waveform separately, as well as using all waveforms together (except for SpO2). Results for forward (top panels) and backward (bottom panels) segments are shown. MAP: mean arterial blood pressure; SBP: systolic arterial blood pressure; DBP: diastolic arterial blood pressure; RaP_Mean: mean right atrial blood pressure; RaP_Diastole: diastolic right atrial blood pressure; CPP: coronary artery blood pressure; SpO2: SpO2: peripheral oxygen saturation; EtCO2: end-tidal carbon dioxide; All: all waveforms, except for SpO2.
Fig. 5.
Fig. 5.
ROC (left panel) and PR (right panel) curves for the best overall model, i.e., using the full segment from the 2nd to 10th minute of CPR and all (but SpO2) waveforms. For ROC curve, the lower bound AUC is 0.5, while for PR curve it is the proportion of samples in the minority class (0.19). ROC: receiver operating characteristic; PR: precision-recall.
Fig. 6.
Fig. 6.
Area under the ROC curve (AUC) and 95% of confidence interval obtained for models created using EtCO2 only, CPP only and all waveforms together (except for SpO2). Results for forward (top panel) and backward (bottom panel) segments are shown. EtCO2: end-tidal carbon dioxide; CPP: coronary artery blood pressure; All: all waveforms, except for SpO2. * p < 0.05 compared with All. Horizontal lines represent statistical differences between segments for the models using the same waveforms. The same color scheme was used to improve readability of statistical differences.
Fig. 7.
Fig. 7.
Top 5 features for each of the models illustrated in Figure 6. Both forward (top panels) and backward (bottom panels) segments are represented. Feature importances are the absolute value of regression coefficients normalized between [0,1]. Values shown in the plot represent the mean over 5-fold cross validation. All: all waveforms except SpO2, i.e., MAP, SBP, DBP, RaP_Mean, RaP_Diastole, and CPP; MAP: mean arterial blood pressure; SBP: systolic arterial blood pressure; DBP: diastolic arterial blood pressure; RaP_Mean: mean right atrial blood pressure; RaP_Diastole: diastolic right atrial blood pressure; CPP: coronary artery blood pressure; SpO2: SpO2: peripheral oxygen saturation; EtCO2: end-tidal carbon dioxide.

References

    1. Meaney PA et al., “Cardiopulmonary Resuscitation Quality: Improving Cardiac Resuscitation Outcomes Both Inside and Outside the Hospital,” Circulation, vol. 128, no. 4, pp. 417–435, Jul. 2013, doi: 10.1161/CIR.0b013e31829d8654. - DOI - PubMed
    1. Morgan RW, Kirschen MP, Kilbaugh TJ, Sutton RM, and Topjian AA, “Pediatric In-Hospital Cardiac Arrest and Cardiopulmonary Resuscitation in the United States: A Review,” JAMA Pediatrics, vol. 175, no. 3, pp. 293–302, Mar. 2021, doi: 10.1001/jamapediatrics.2020.5039. - DOI - PMC - PubMed
    1. Sutton RM, Morgan RW, Kilbaugh TJ, Nadkarni VM, and Berg RA, “Cardiopulmonary Resuscitation in Pediatric and Cardiac Intensive Care Units,” Pediatr Clin North Am, vol. 64, no. 5, pp. 961–972, Oct. 2017, doi: 10.1016/j.pcl.2017.06.001. - DOI - PubMed
    1. Wyckoff MH et al., “2021. International Consensus on Cardiopulmonary Resuscitation and Emergency Cardiovascular Care Science With Treatment Recommendations: Summary From the Basic Life Support; Advanced Life Support; Neonatal Life Support; Education, Implementation, and Teams; First Aid Task Forces; and the COVID-19 Working Group,” Resuscitation, vol. 169, pp. 229–311, Dec. 2021, doi: 10.1016/j.resuscitation.2021.10.040. - DOI - PMC - PubMed
    1. Asplin BR and White RD, “Prognostic value of end-tidal carbon dioxide pressures during out-of-hospital cardiac arrest,” Ann Emerg Med, vol. 25, no. 6, pp. 756–761, Jun. 1995, doi: 10.1016/s0196-0644(95)70203-2. - DOI - PubMed

Publication types