. 2023 Jul 21;18(7):e0286271.
doi: 10.1371/journal.pone.0286271. eCollection 2023.

Homeobox transcription factor HbxA influences expression of over one thousand genes in the model fungus Aspergillus nidulans

Affiliations

Homeobox transcription factor HbxA influences expression of over one thousand genes in the model fungus Aspergillus nidulans

Sandesh S Pandit et al. PLoS One. .

Abstract

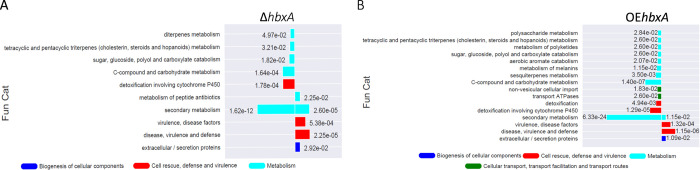
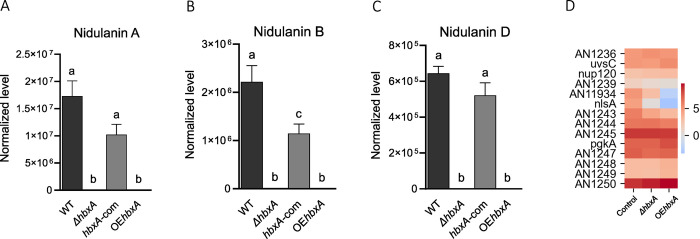
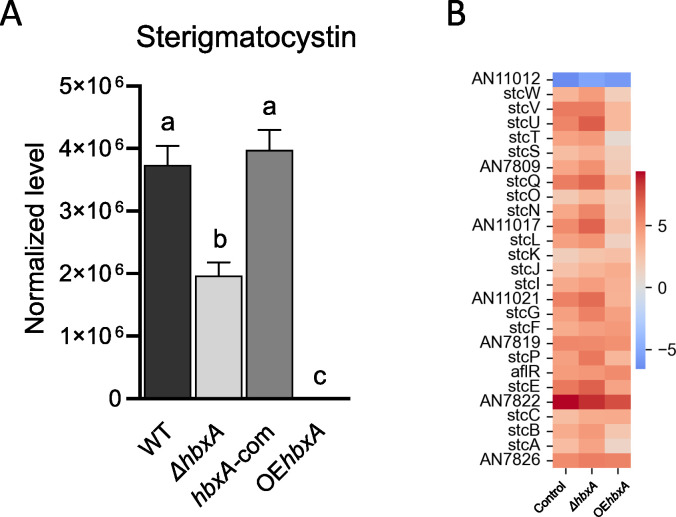
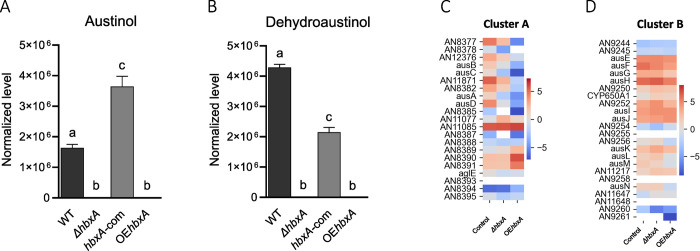
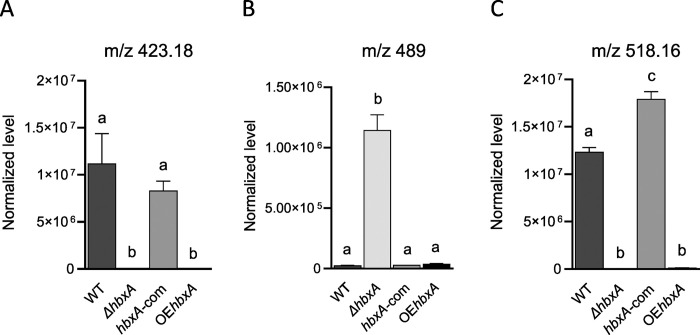
In fungi, conserved homeobox-domain proteins are transcriptional regulators governing development. In Aspergillus species, several homeobox-domain transcription factor genes have been identified, among them, hbxA/hbx1. For instance, in the opportunistic human pathogen Aspergillus fumigatus, hbxA is involved in conidial production and germination, as well as virulence and secondary metabolism, including production of fumigaclavines, fumiquinazolines, and chaetominine. In the agriculturally important fungus Aspergillus flavus, disruption of hbx1 results in fluffy aconidial colonies unable to produce sclerotia. hbx1 also regulates production of aflatoxins, cyclopiazonic acid and aflatrem. Furthermore, transcriptome studies revealed that hbx1 has a broad effect on the A. flavus genome, including numerous genes involved in secondary metabolism. These studies underline the importance of the HbxA/Hbx1 regulator, not only in developmental processes but also in the biosynthesis of a broad number of fungal natural products, including potential medical drugs and mycotoxins. To gain further insight into the regulatory scope of HbxA in Aspergilli, we studied its role in the model fungus Aspergillus nidulans. Our present study of the A. nidulans hbxA-dependent transcriptome revealed that more than one thousand genes are differentially expressed when this regulator was not transcribed at wild-type levels, among them numerous transcription factors, including those involved in development as well as in secondary metabolism regulation. Furthermore, our metabolomics analyses revealed that production of several secondary metabolites, some of them associated with A. nidulans hbxA-dependent gene clusters, was also altered in deletion and overexpression hbxA strains compared to the wild type, including synthesis of nidulanins A, B and D, versicolorin A, sterigmatocystin, austinol, dehydroaustinol, and three unknown novel compounds.


Conflict of interest statement

The authors have declared that no competing interests exist.

Figures

Fig 1
Fig 1. Phylogenetic analysis of Aspergillus nidulans HbxA.
The phylogenetic tree was constructed using MEGA v6.0 and the Maximum Likelihood model with bootstrap value of 1000 (http://megasoftware.net/).
Fig 2
Fig 2. hbxA is required for normal conidiation and for production of ST and other secondary metabolites in A. nidulans.
(A) Cultures of wild type, deletion, complementation and overexpression hbxA strains, top-agar inoculated on glucose minimum medium (GMM) and incubated for 7 days in the dark at 37°C. (B) TLC analysis of extracts from top-agar inoculated cultures incubated for 3 days in the dark. Black arrows indicate ST standard. The experiment was carried out with three replicates. (C) Densitometry of TLC analysis of ST levels in (B). The densitometry was performed using the http://biochemlabsolutions.com/GelQuantNET.html website. Error bars represent the standard error. Columns of different letters represent values that are statistically different p value of <0.05.
Fig 3
Fig 3. Number of DEGs in A. nidulans when expression of hbxA is altered by hbxA deletion or overexpression.
(A) Number of significantly upregulated (purple) and significantly downregulated (orange) DEGs estimated by DeSeq2. (B) Volcano plot of log2 fold change vs. -log10 q-value of all the genes in ΔhbxA, and OEhbxA vs. control. Significantly upregulated genes are shown as red dots, significant down regulated genes are shown as blue dot and other genes are shown as black. The x-axis represents the log2 of the fold change determined by DeSeq2. The y-axis is the log10 of the adjusted p-value from DeSeq2. The cut offlog10 fold change value to determine the upregulated expression is greater than 2 while -2 is for down regulated expression. The -log10 q-value cutoff was set to 2 to determine the significant expression or not. (C-D) Venn Diagrams showing the overlap of DEGs in ΔhbxA and OEhbxA (C), and the overlap of upregulated (D) and downregulated DEGs (E) in ΔhbxA and OEhbxA. Venn Diagrams were constructed using https://bioinformatics.psb.ugent.be/cgi-bin/liste/Venn/calculate_venn.htpl website.
Fig 4
Fig 4. Comparison of orthologous genes affected by deletion of hbxA in A. nidulans and A. flavus.
Both upregulated orthologous genes were colored in red. Both downregulated orthologous genes were colored in blue. No expression changed orthologous genes are colored in grey. Two orthologous genes having different regulation status are colored in purple. The significantly regulated genes were defined as |log2 fold change| < = 2 and q-value < = 0.05.
Fig 5
Fig 5. Number of transcription factor (TF) genes controlled by hbxA in A. nidulans.
(A) Venn Diagram showing the overlap of differentially expressed TF genes in ΔhbxA and OEhbxA. (B-C) Venn Diagrams showing the overlap of upregulated (B) or downregulated (C) TF genes in ΔhbxA and OEhbxA. Venn Diagrams were constructed using https://bioinformatics.psb.ugent.be/cgi-bin/liste/Venn/calculate_venn.htpl website.
Fig 6
Fig 6
FunCat enrichment of significant DEGs found in (A) ΔhbxA and (B) OEhbxA vs. control. The -log10 of the q-value of DEGs in each term is proportional to the length of the bars. FunCat annotations and q-value is determined by FungiFun2 webserver. Downregulated genes are to the left of the origin and up regulated genes to the right.
Fig 7
Fig 7. hbxA regulates the production of nidulanins in A. nidulans.
Wild-type (WT), deletion (ΔhbxA), complementation (hbxA-com) and overexpression (OEhbxA) strains were top-agar inoculated on solid glucose minimum medium (GMM) at 37°C for 72 h. Samples were collected, extracted with chloroform and analyzed by LC-HRMS in positive mode (A-C) Quantification of nidulanin A (m/z 604.34943), B (m/z 620.34404), D (m/z 536.28659) respectively. (D) Heat map of TPM values of nidulanin cluster (DEGs) expression in A. nidulans ΔhbxA and OEhbxA with respect to wild type strain on a log scale found in Inglis et al. [50]. The TPM value of each gene was calculated by averaging all the TPM values of all replicates.
Fig 8
Fig 8. hbxA regulates the production of ST in A. nidulans.
Wild type (WT), deletion (ΔhbxA), complementation (hbxA-com) and overexpression (OEhbxA) strains were top-agar inoculated on solid glucose minimum medium (GMM) at 37°C for 72 h. Samples were collected, extracted with chloroform and analyzed by LC-HRMS in positive mode. (A) Quantification of ST (m/z 325.07014). (B) Heat map of TPM values of ST cluster (DEGs) expression in A. nidulans ΔhbxA and OEhbxA with respect to wild type strain on a log scale found in Inglis et al. [50]. The TPM value of each gene was calculated by averaging all the TPM values of all replicates.
Fig 9
Fig 9. hbxA regulates the production of austinol and dehydroaustinol in A. nidulans.
Wild type (WT), deletion (ΔhbxA), complementation (hbxA-com), and overexpression (OEhbxA) strains were top-agar inoculated on solid glucose minimum medium (GMM) at 37°C for 72 h. Samples were collected, extracted with chloroform and analyzed by LC-HRMS in positive mode. Quantification of (A) austinol (m/z 459.20059) and (B) dehydroaustinol (m/z 457.18524) compounds by full MS spectra resolution of 60,000 with a range of mass-to-charge ratio (m/z) set to 50 to 800. (C & D) Heatmap of TPM values of austinol cluster (DEGs) expression in A. nidulans ΔhbxA and OEhbxA with respect to wild type strain on a log scale found in Inglis et al. [50]. The TPM value of each gene was calculated by averaging all the TPM values of all replicates.
Fig 10
Fig 10. hbxA regulates the production of novel uncharacterized metabolites in A. nidulans.
Wild type (WT), deletion (ΔhbxA), complementation (hbxA-com), and overexpression (OEhbxA) strains were top-agar inoculated on solid glucose minimum medium (GMM) at 37°C for 72 h, when samples were collected, extracted with chloroform and analyzed by LC-HRMS in negative mode. (A-C) Quantification of novel uncharacterized metabolites with m/z of 423.18012, 489.18082, and 518.16482, respectively.

References

    1. Caesar LK, Kelleher NL, Keller NP. In the fungus where it happens: History and future propelling Aspergillus nidulans as the archetype of natural products research. Fungal Genet Biol. 2020. Nov 1;144:103477. - PMC - PubMed
    1. Oiartzabal-Arano E, Perez-de-Nanclares-Arregi E, Espeso EA, Etxebeste O. Apical control of conidiation in Aspergillus nidulans. Curr Genet. 2016. May 1;62(2):371–7. - PubMed
    1. Yu JH. Regulation of Development in Aspergillus nidulans and Aspergillus fumigatus. Mycobiology. 2010. Dec 31;38(4):229–37. - PMC - PubMed
    1. Etxebeste O, Garzia A, Espeso EA, Ugalde U. Aspergillus nidulans asexual development: making the most of cellular modules. Trends Microbiol. 2010. Dec;18(12):569–76. - PubMed
    1. Hermann TE, Kurtz MB, Champe SP. Laccase localized in hulle cells and cleistothecial primordia of Aspergillus nidulans. J Bacteriol. 1983. May;154(2):955–64. - PMC - PubMed

MeSH terms