

Telomerase Upregulation Induces Progression of Mouse BrafV600E-Driven Thyroid Cancers and Triggers Nontelomeric Effects
- PMID: 37478162
- PMCID: PMC11193891
- DOI: 10.1158/1541-7786.MCR-23-0144
Telomerase Upregulation Induces Progression of Mouse BrafV600E-Driven Thyroid Cancers and Triggers Nontelomeric Effects
Abstract
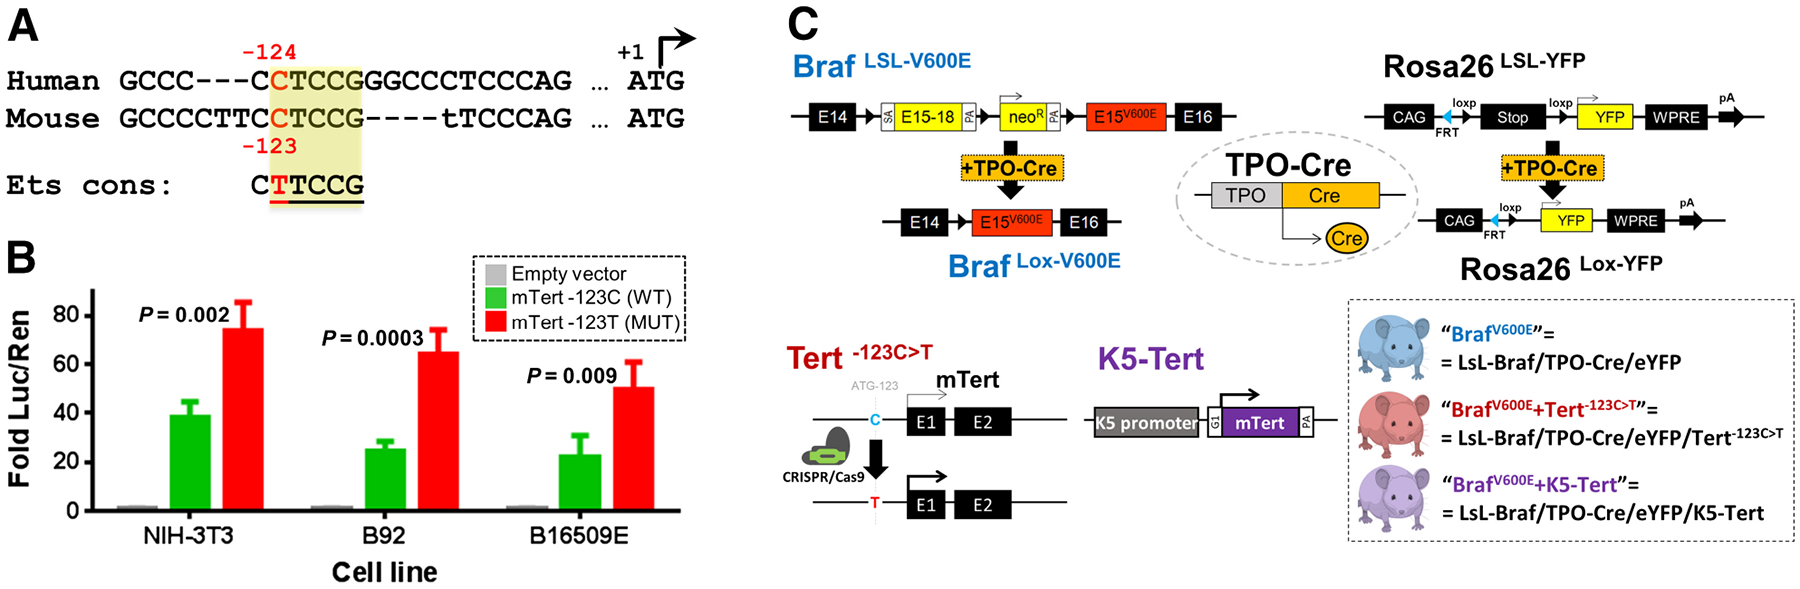
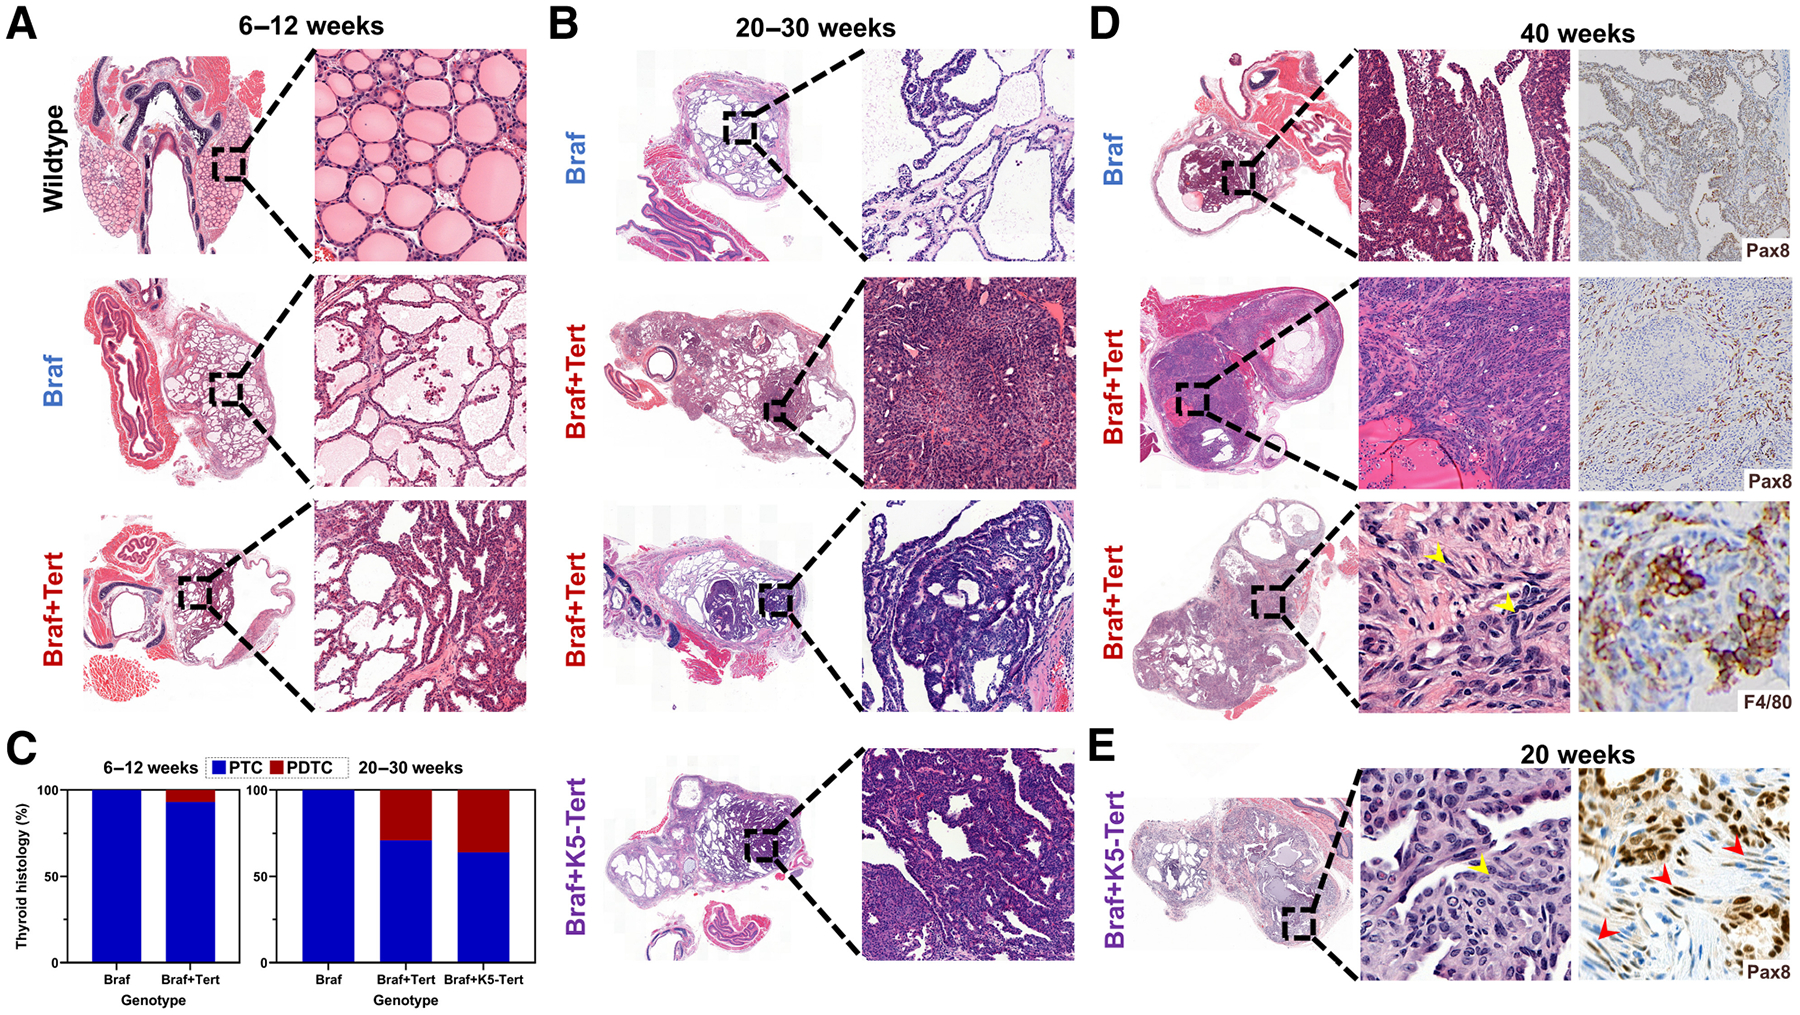
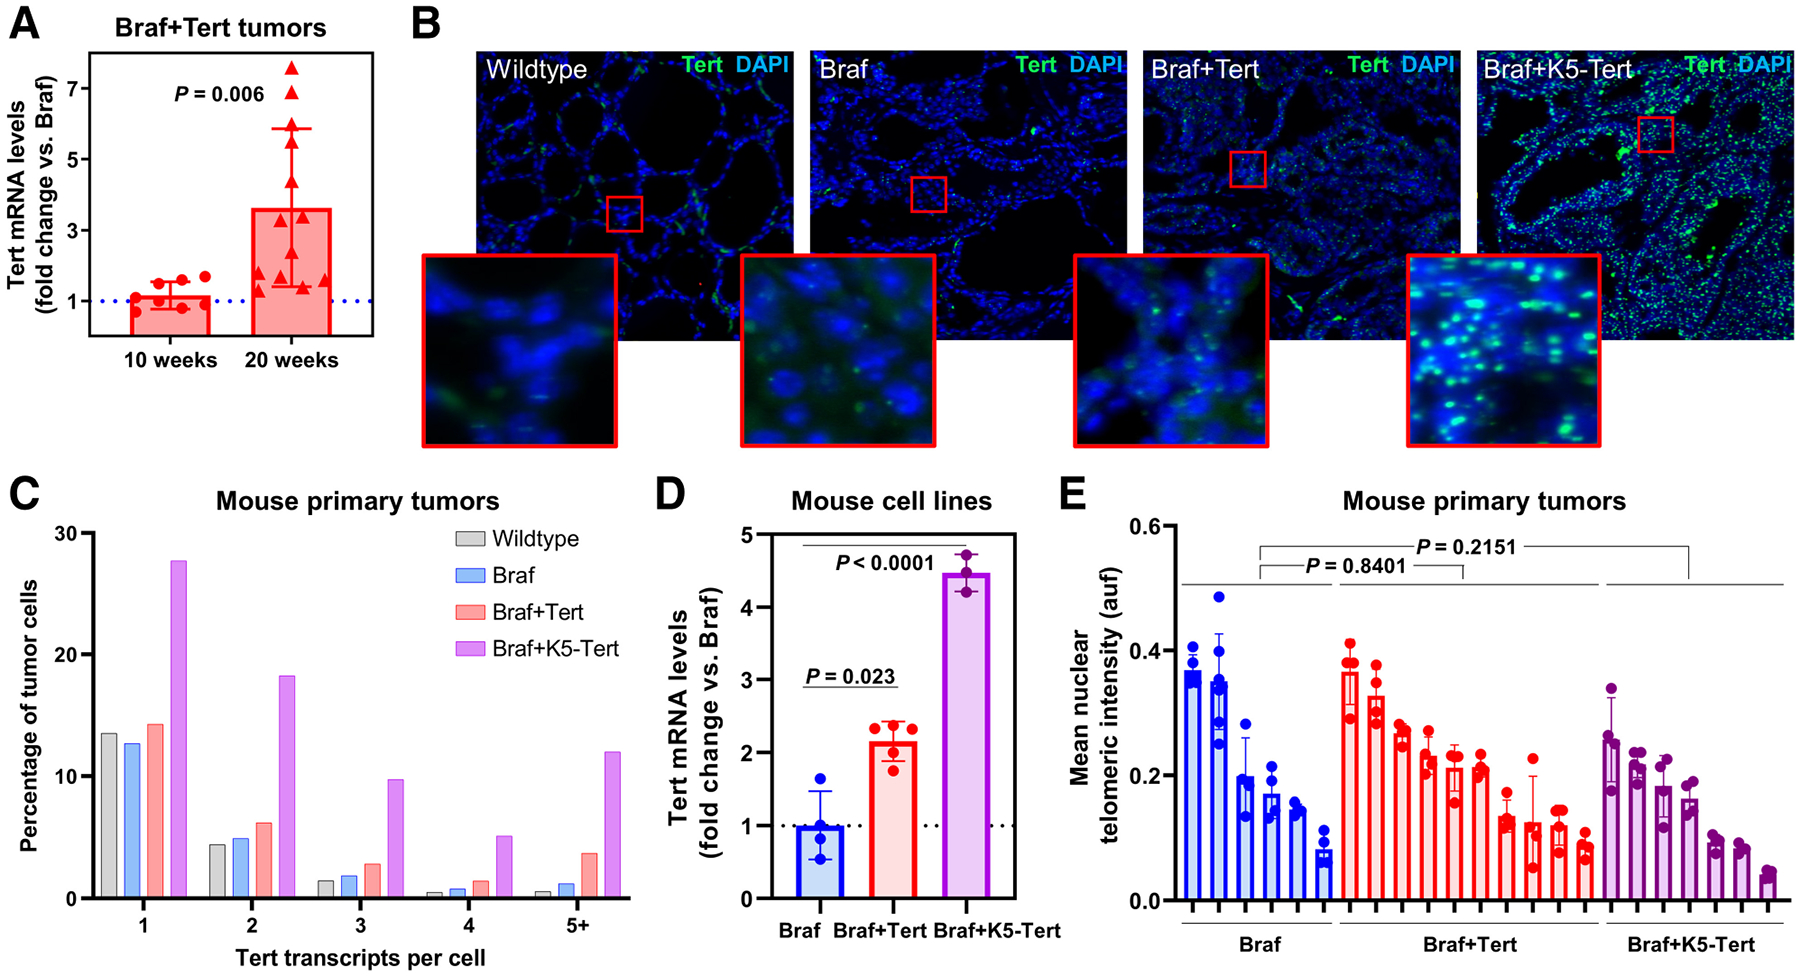
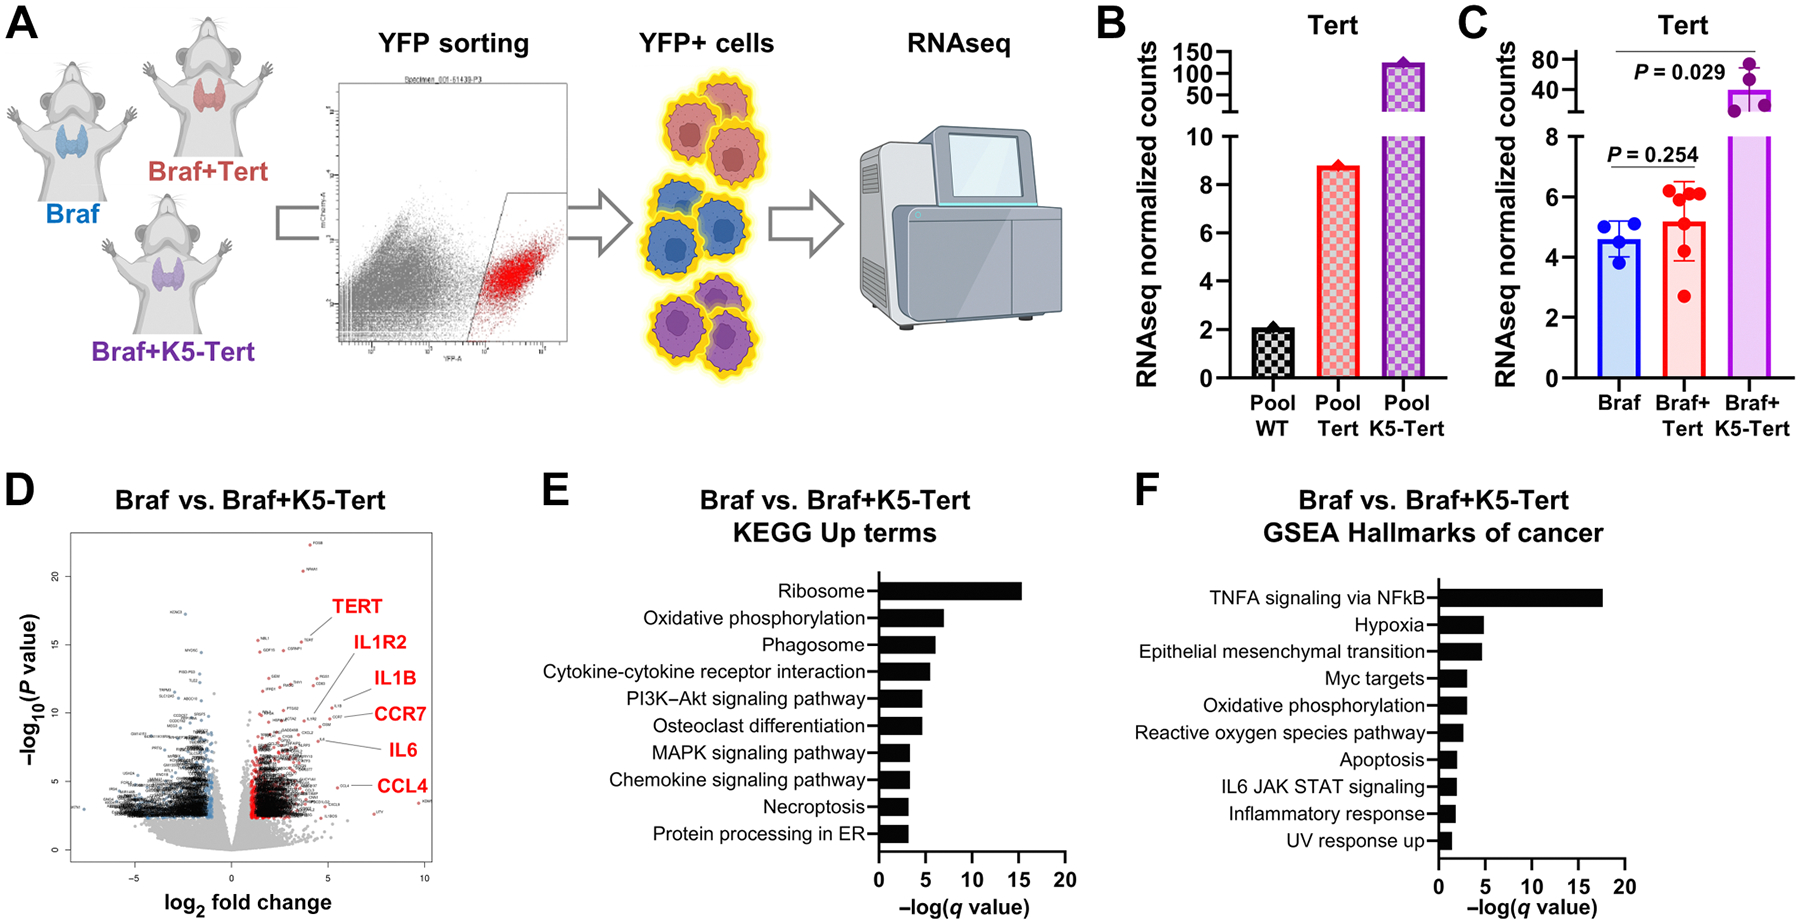
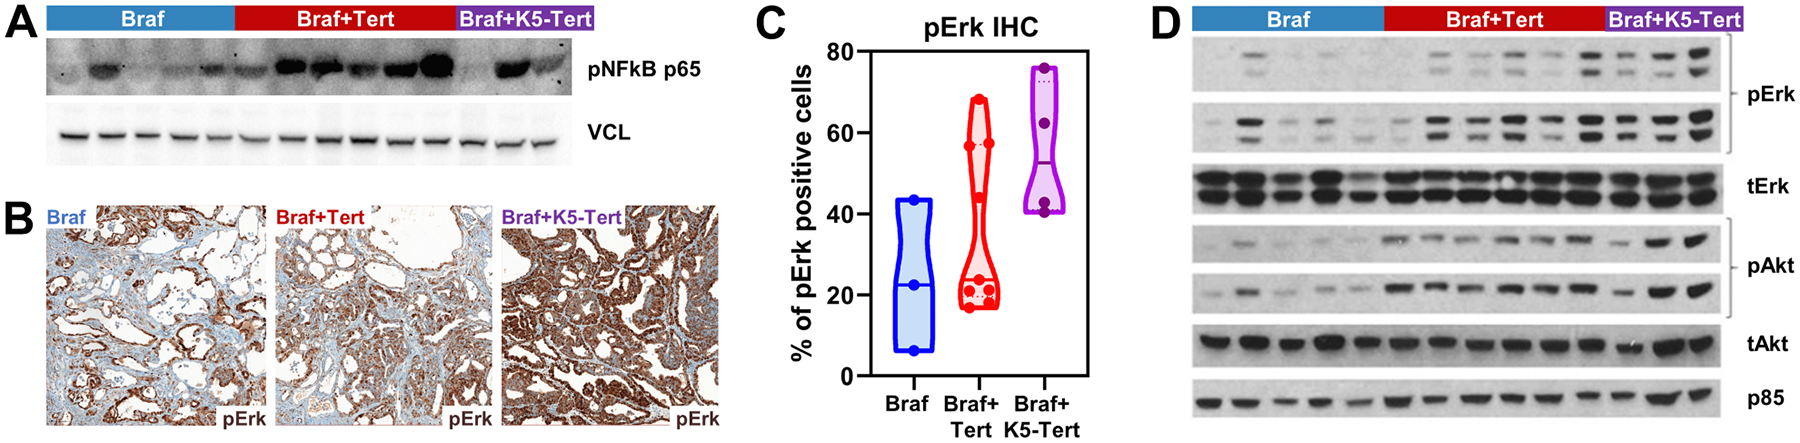
Mutations in the promoter of the telomerase reverse transcriptase (TERT) gene are the paradigm of a cross-cancer alteration in a noncoding region. TERT promoter mutations (TPM) are biomarkers of poor prognosis in cancer, including thyroid tumors. TPMs enhance TERT transcription, which is otherwise silenced in adult tissues, thus reactivating a bona fide oncoprotein. To study TERT deregulation and its downstream consequences, we generated a Tert mutant promoter mouse model via CRISPR/Cas9 engineering of the murine equivalent locus (Tert-123C>T) and crossed it with thyroid-specific BrafV600E-mutant mice. We also employed an alternative model of Tert overexpression (K5-Tert). Whereas all BrafV600E animals developed well-differentiated papillary thyroid tumors, 29% and 36% of BrafV600E+Tert-123C>T and BrafV600E+K5-Tert mice progressed to poorly differentiated cancers at week 20, respectively. Tert-upregulated tumors showed increased mitosis and necrosis in areas of solid growth, and older animals displayed anaplastic-like features, that is, spindle cells and macrophage infiltration. Murine TPM increased Tert transcription in vitro and in vivo, but temporal and intratumoral heterogeneity was observed. RNA-sequencing of thyroid tumor cells showed that processes other than the canonical Tert-mediated telomere maintenance role operate in these specimens. Pathway analysis showed that MAPK and PI3K/AKT signaling, as well as processes not previously associated with this tumor etiology, involving cytokine, and chemokine signaling, were overactivated. These models constitute useful preclinical tools to understand the cell-autonomous and microenvironment-related consequences of Tert-mediated progression in advanced thyroid cancers and other aggressive tumors carrying TPMs.
Implications: Telomerase-driven cancer progression activates pathways that can be dissected and perhaps therapeutically exploited.
©2023 American Association for Cancer Research.
Figures
Update of
-
Telomerase reactivation induces progression of mouse Braf V600E -driven thyroid cancers without telomere lengthening.bioRxiv [Preprint]. 2023 Jan 24:2023.01.24.525280. doi: 10.1101/2023.01.24.525280. bioRxiv. 2023. Update in: Mol Cancer Res. 2023 Nov 1;21(11):1163-1175. doi: 10.1158/1541-7786.MCR-23-0144. PMID: 36747657 Free PMC article. Updated. Preprint.
Similar articles
-
Telomerase reactivation induces progression of mouse Braf V600E -driven thyroid cancers without telomere lengthening.bioRxiv [Preprint]. 2023 Jan 24:2023.01.24.525280. doi: 10.1101/2023.01.24.525280. bioRxiv. 2023. Update in: Mol Cancer Res. 2023 Nov 1;21(11):1163-1175. doi: 10.1158/1541-7786.MCR-23-0144. PMID: 36747657 Free PMC article. Updated. Preprint.
-
Interaction of BRAF-induced ETS factors with mutant TERT promoter in papillary thyroid cancer.Endocr Relat Cancer. 2019 Jun;26(6):629-641. doi: 10.1530/ERC-17-0562. Endocr Relat Cancer. 2019. PMID: 30999281
-
Mechanisms of TERT Reactivation and Its Interaction with BRAFV600E.Endocrinol Metab (Seoul). 2020 Sep;35(3):515-525. doi: 10.3803/EnM.2020.304. Epub 2020 Sep 22. Endocrinol Metab (Seoul). 2020. PMID: 32981294 Free PMC article. Review.
-
Frequent somatic TERT promoter mutations in thyroid cancer: higher prevalence in advanced forms of the disease.J Clin Endocrinol Metab. 2013 Sep;98(9):E1562-6. doi: 10.1210/jc.2013-2383. Epub 2013 Jul 5. J Clin Endocrinol Metab. 2013. PMID: 23833040 Free PMC article.
-
Telomerase and Telomeres Biology in Thyroid Cancer.Int J Mol Sci. 2019 Jun 13;20(12):2887. doi: 10.3390/ijms20122887. Int J Mol Sci. 2019. PMID: 31200515 Free PMC article. Review.
Cited by
-
Telomere Maintenance-Related Genes are Essential for Prognosis in Breast Cancer.Breast Cancer (Dove Med Press). 2025 Feb 24;17:225-239. doi: 10.2147/BCTT.S506783. eCollection 2025. Breast Cancer (Dove Med Press). 2025. PMID: 40028272 Free PMC article.
-
NOVEL INSIGHTS IN ADVANCED THYROID CARCINOMA: FROM MECHANISMS TO TREATMENTS: Molecular insights into the origin, biology, and treatment of anaplastic thyroid carcinoma.Eur Thyroid J. 2025 Jun 2;14(3):e250057. doi: 10.1530/ETJ-25-0057. Print 2025 Jun 1. Eur Thyroid J. 2025. PMID: 40396891 Free PMC article. Review.
-
Characterizing Genetic Alterations Related to Radioiodine Avidity in Metastatic Thyroid Cancer.J Clin Endocrinol Metab. 2024 Apr 19;109(5):1231-1240. doi: 10.1210/clinem/dgad697. J Clin Endocrinol Metab. 2024. PMID: 38060243 Free PMC article.
-
Mechanistic Insights of Thyroid Cancer Progression.Endocrinology. 2023 Aug 1;164(9):bqad118. doi: 10.1210/endocr/bqad118. Endocrinology. 2023. PMID: 37503738 Free PMC article. Review.
-
AURKB and PI3K/AKT/mTOR pathways converge to regulate TERT expression.iScience. 2025 Jul 24;28(8):113194. doi: 10.1016/j.isci.2025.113194. eCollection 2025 Aug 15. iScience. 2025. PMID: 40822359 Free PMC article.
References
-
- Horn S, Figl A, Rachakonda PS, Fischer C, Sucker A, Gast A, et al. TERT promoter mutations in familial and sporadic melanoma. Science 2013;339:959–61. - PubMed
Publication types
MeSH terms
Substances
Grants and funding
LinkOut - more resources
Full Text Sources
Medical
Molecular Biology Databases
Research Materials
