

Intracellular environment can change protein conformational dynamics in cells through weak interactions
- PMID: 37478178
- PMCID: PMC10361600
- DOI: 10.1126/sciadv.adg9141
Intracellular environment can change protein conformational dynamics in cells through weak interactions
Abstract
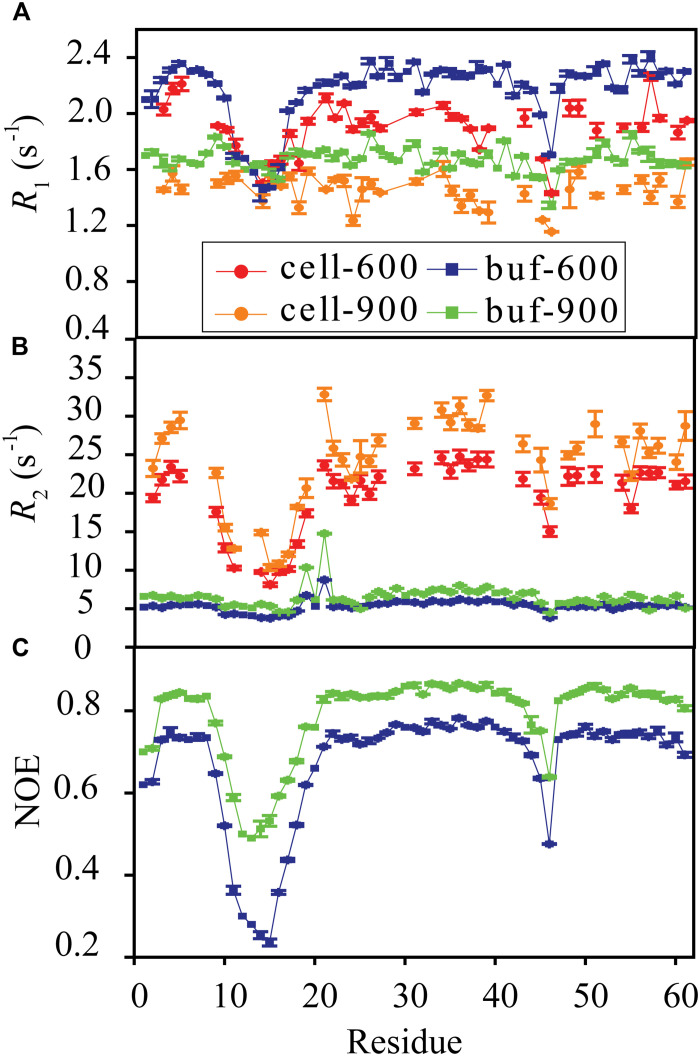
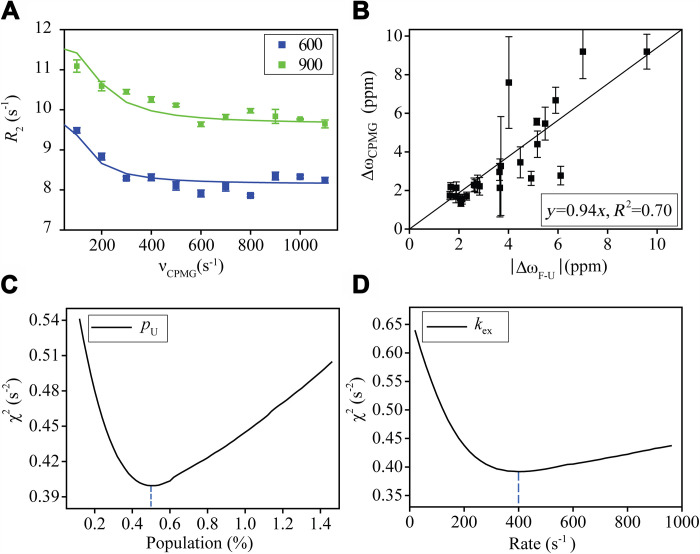
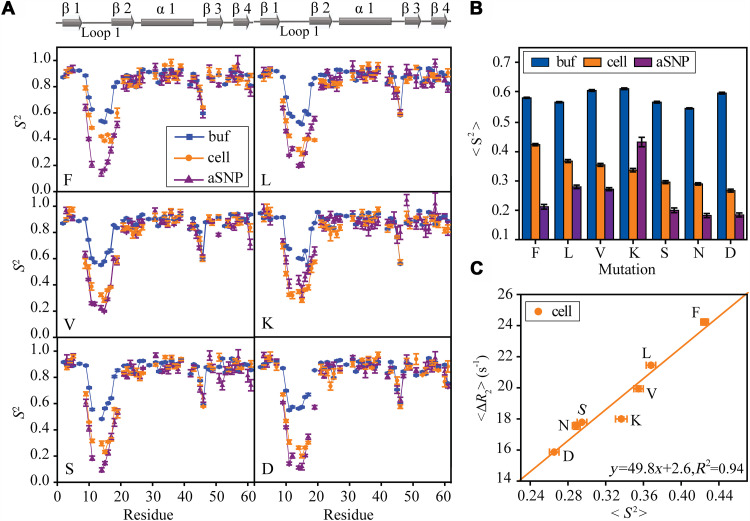
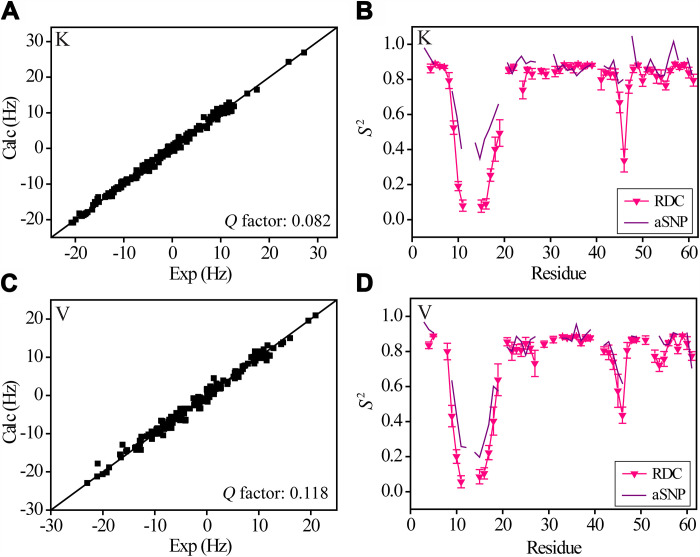
Conformational dynamics is important for protein functions, many of which are performed in cells. How the intracellular environment may affect protein conformational dynamics is largely unknown. Here, loop conformational dynamics is studied for a model protein in Escherichia coli cells by using nuclear magnetic resonance (NMR) spectroscopy. The weak interactions between the protein and surrounding macromolecules in cells hinder the protein rotational diffusion, which extends the dynamic detection timescale up to microseconds by the NMR spin relaxation method. The loop picosecond to microsecond dynamics is confirmed by nanoparticle-assisted spin relaxation and residual dipolar coupling methods. The loop interactions with the intracellular environment are perturbed through point mutation of the loop sequence. For the sequence of the protein that interacts stronger with surrounding macromolecules, the loop becomes more rigid in cells. In contrast, the mutational effect on the loop dynamics in vitro is small. This study provides direct evidence that the intracellular environment can modify protein loop conformational dynamics through weak interactions.
Figures


Similar articles
-
Enzyme dynamics from NMR spectroscopy.Acc Chem Res. 2015 Feb 17;48(2):457-65. doi: 10.1021/ar500340a. Epub 2015 Jan 9. Acc Chem Res. 2015. PMID: 25574774 Free PMC article. Review.
-
Functional protein dynamics on uncharted time scales detected by nanoparticle-assisted NMR spin relaxation.Sci Adv. 2019 Aug 14;5(8):eaax5560. doi: 10.1126/sciadv.aax5560. eCollection 2019 Aug. Sci Adv. 2019. PMID: 31453342 Free PMC article.
-
Exploring weak, transient protein--protein interactions in crowded in vivo environments by in-cell nuclear magnetic resonance spectroscopy.Biochemistry. 2011 Nov 1;50(43):9225-36. doi: 10.1021/bi201287e. Epub 2011 Oct 5. Biochemistry. 2011. PMID: 21942871 Free PMC article.
-
Backbone dynamics in dihydrofolate reductase complexes: role of loop flexibility in the catalytic mechanism.Biochemistry. 2001 Aug 21;40(33):9846-59. doi: 10.1021/bi010621k. Biochemistry. 2001. PMID: 11502178
-
Identifying and quantitating conformational exchange in membrane proteins using site-directed spin labeling.Acc Chem Res. 2014 Oct 21;47(10):3102-9. doi: 10.1021/ar500228s. Epub 2014 Aug 25. Acc Chem Res. 2014. PMID: 25152957 Free PMC article. Review.
Cited by
-
Diffusion of proteins in crowded solutions studied by docking-based modeling.J Chem Phys. 2024 Sep 7;161(9):095101. doi: 10.1063/5.0220545. J Chem Phys. 2024. PMID: 39225532 Free PMC article.
-
Exploring the dynamics and structure of PpiB in living Escherichia coli cells using electron paramagnetic resonance spectroscopy.Protein Sci. 2024 Mar;33(3):e4903. doi: 10.1002/pro.4903. Protein Sci. 2024. PMID: 38358137 Free PMC article.
-
BEMM-GEN: A Toolkit for Generating a Biomolecular Environment-Mimicking Model for Molecular Dynamics Simulation.J Chem Inf Model. 2024 Oct 14;64(19):7184-7188. doi: 10.1021/acs.jcim.4c01467. Epub 2024 Oct 3. J Chem Inf Model. 2024. PMID: 39361452 Free PMC article.
-
Ribosome Tunnel Environment Drives the Formation of α-Helix during Cotranslational Folding.J Chem Inf Model. 2024 Aug 26;64(16):6610-6622. doi: 10.1021/acs.jcim.4c00901. Epub 2024 Aug 16. J Chem Inf Model. 2024. PMID: 39150098 Free PMC article.
-
Progress, Challenges and Opportunities of NMR and XL-MS for Cellular Structural Biology.JACS Au. 2024 Feb 5;4(2):369-383. doi: 10.1021/jacsau.3c00712. eCollection 2024 Feb 26. JACS Au. 2024. PMID: 38425916 Free PMC article. Review.
References
-
- H. Reiss, H. L. Frisch, J. L. Lebowitz, Statistical mechanics of rigid spheres. J. Chem. Phys. 31, 369–380 (1959).
-
- A. J. Wirth, M. Gruebele, Quinary protein structure and the consequences of crowding in living cells: Leaving the test-tube behind. Bioessays 35, 984–993 (2013). - PubMed
-
- M. Gruebele, G. J. Pielak, Dynamical spectroscopy and microscopy of proteins in cells. Curr. Opin. Struct. Biol. 70, 1–7 (2021). - PubMed
MeSH terms
Substances
LinkOut - more resources
Full Text Sources
