. 2023 Jul 21;9(29):eadf6710.
doi: 10.1126/sciadv.adf6710. Epub 2023 Jul 21.

Fatty acid desaturase 2 determines the lipidomic landscape and steroidogenic function of the adrenal gland

Affiliations

Fatty acid desaturase 2 determines the lipidomic landscape and steroidogenic function of the adrenal gland

Anke Witt et al. Sci Adv. .

Abstract

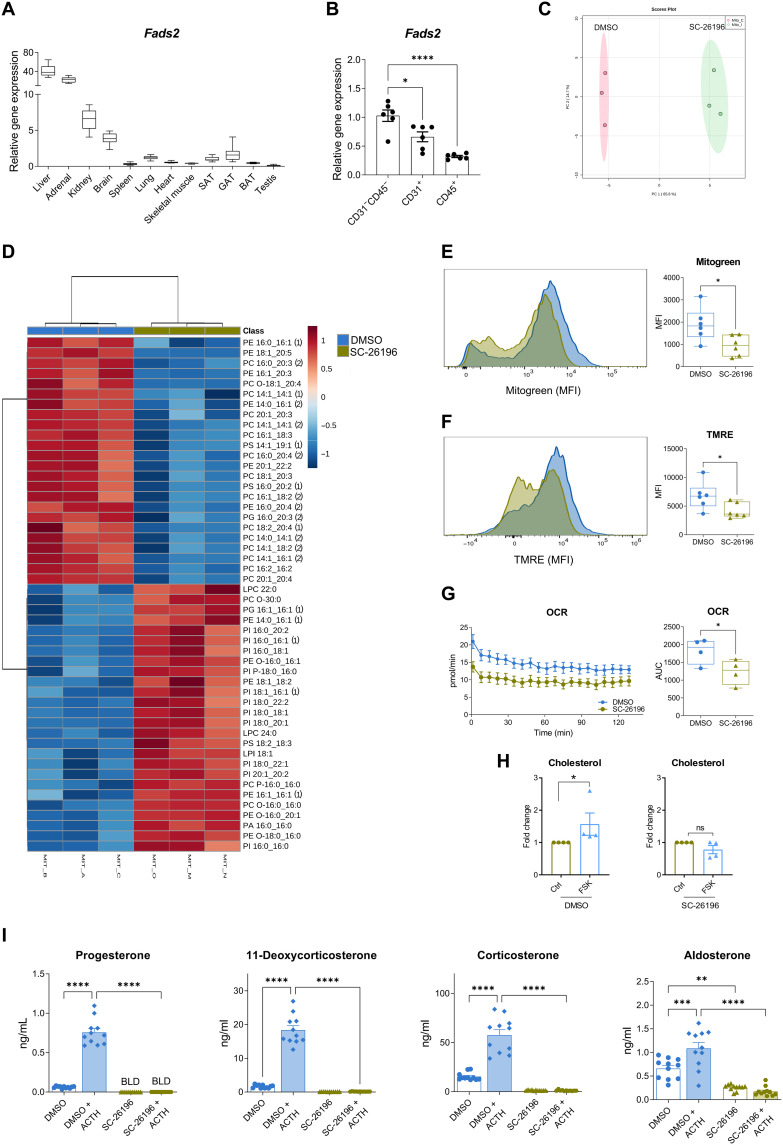
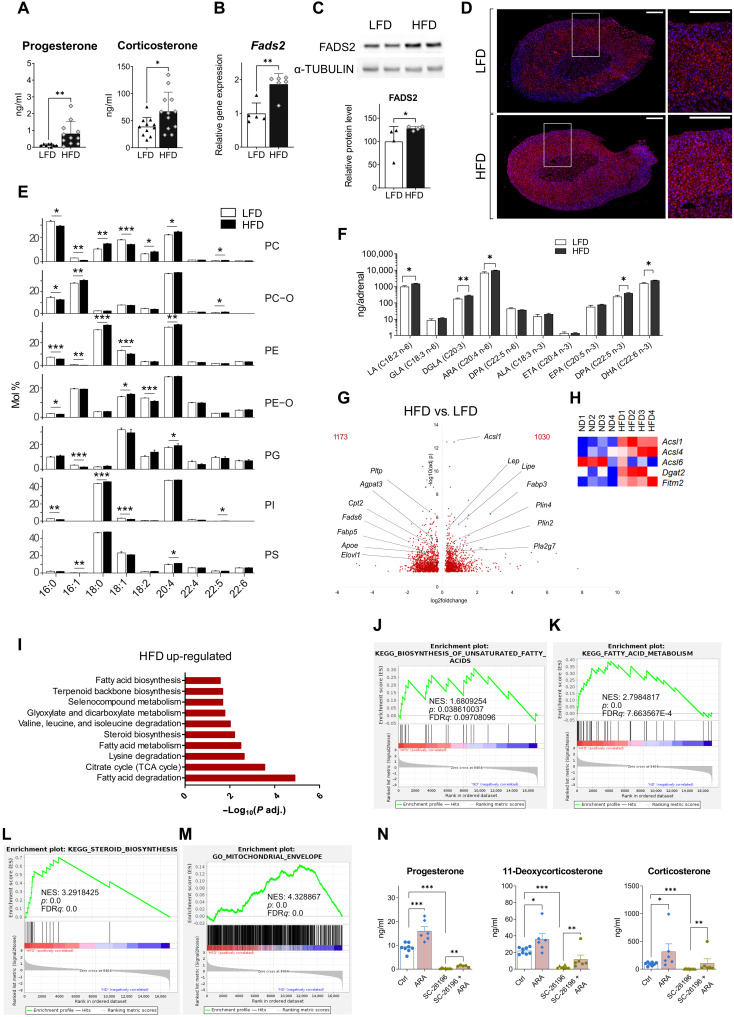
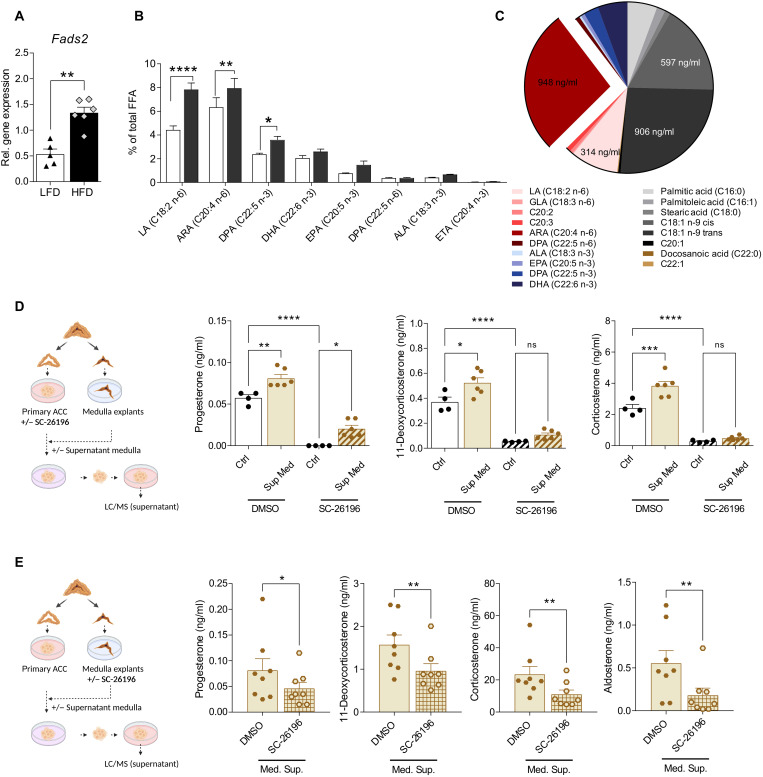
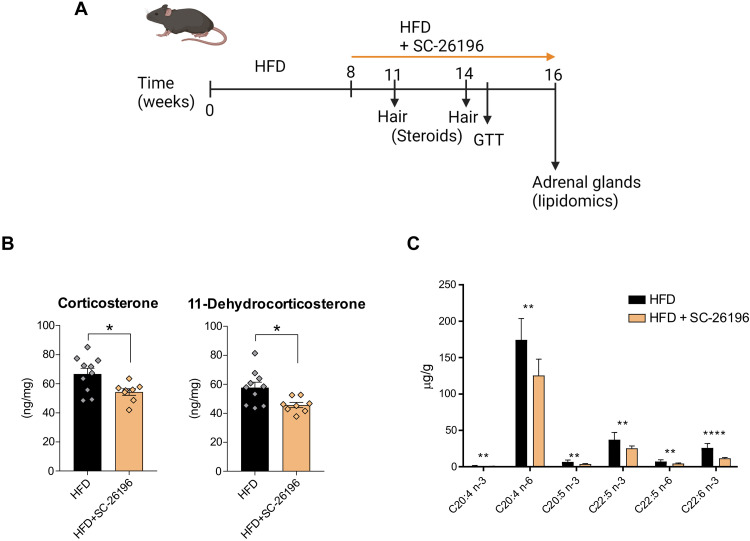
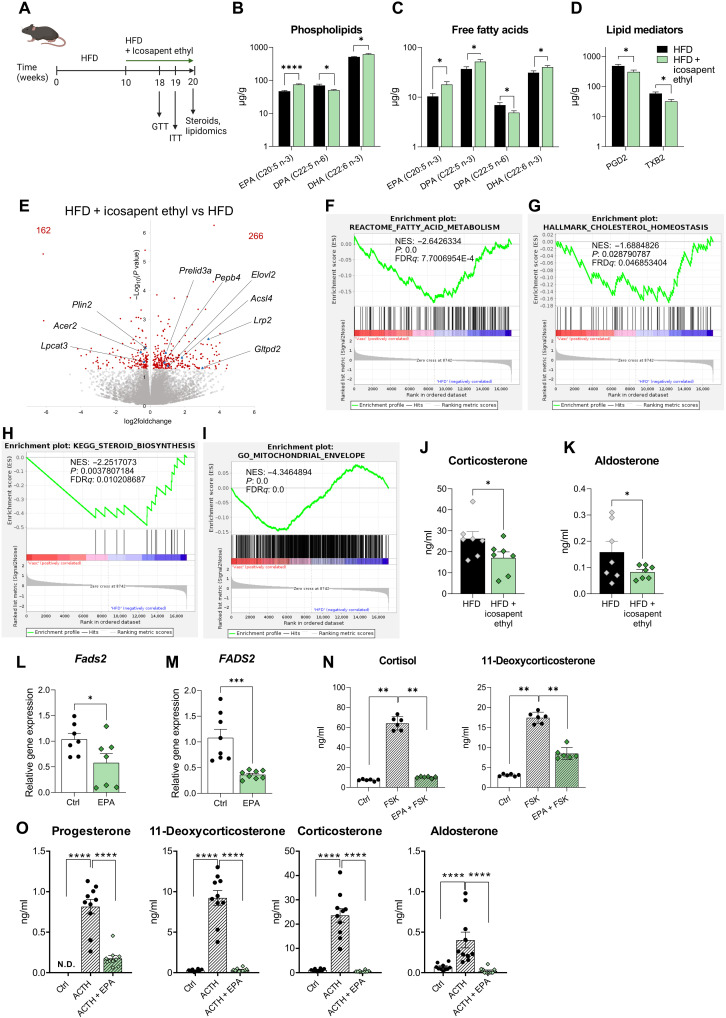
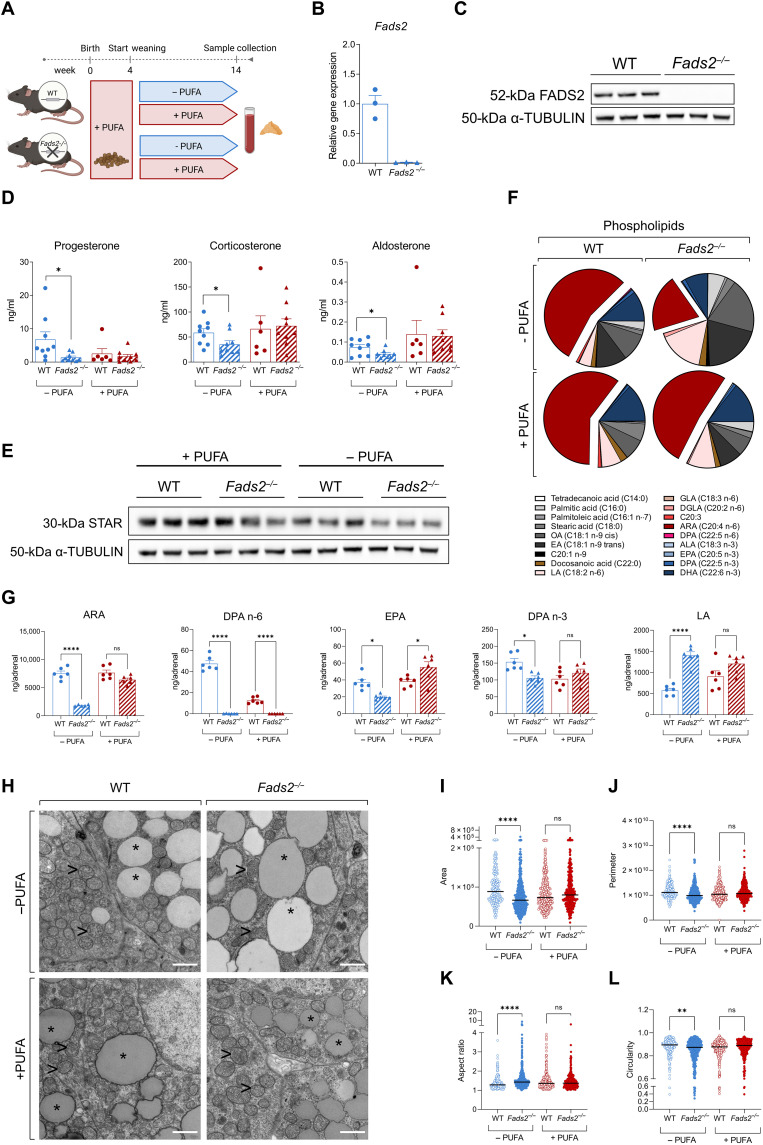
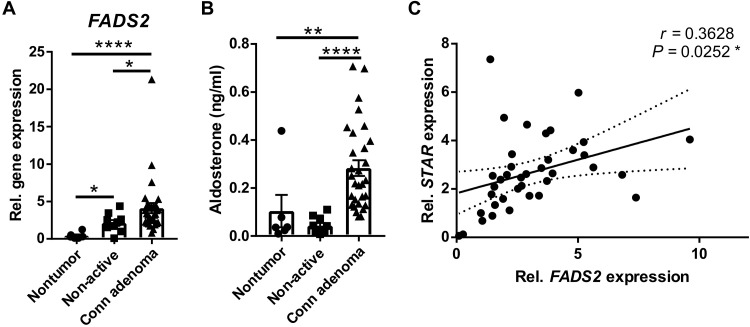
Corticosteroids regulate vital processes, including stress responses, systemic metabolism, and blood pressure. Here, we show that corticosteroid synthesis is related to the polyunsaturated fatty acid (PUFA) content of mitochondrial phospholipids in adrenocortical cells. Inhibition of the rate-limiting enzyme of PUFA synthesis, fatty acid desaturase 2 (FADS2), leads to perturbations in the mitochondrial lipidome and diminishes steroidogenesis. Consistently, the adrenocortical mitochondria of Fads2-/- mice fed a diet with low PUFA concentration are structurally impaired and corticoid levels are decreased. On the contrary, FADS2 expression is elevated in the adrenal cortex of obese mice, and plasma corticosterone is increased, which can be counteracted by dietary supplementation with the FADS2 inhibitor SC-26192 or icosapent ethyl, an eicosapentaenoic acid ethyl ester. In humans, FADS2 expression is elevated in aldosterone-producing adenomas compared to non-active adenomas or nontumorous adrenocortical tissue and correlates with expression of steroidogenic genes. Our data demonstrate that FADS2-mediated PUFA synthesis determines adrenocortical steroidogenesis in health and disease.


Figures

Fig. 1.
Fig. 1.. FADS2 determines the mitochondrial lipidome and is required for steroidogenesis in adrenocortical cells.
(A) Relative Fads2 expression in different tissues of 8-week-old WT C57BL6J mice determined by qPCR using Tbp as a housekeeping gene. Data are shown as mean 2ΔCt (n = 8). BAT, brown adipose tissue; SAT, subcutaneous adipose tissue; GAT, gonadal adipose tissue. (B) Relative Fads2 expression in CD31CD45, CD31+, and CD45+ cell populations of the mouse adrenal cortex. Expression of Fads2 in CD31CD45 cells was set to 1. 18S was used as an internal control (n = 6). (C and D) PCA of the phospholipidome (C) and heatmap showing the differentially regulated lipid species (D) of mitochondrial fractions of NCI-H295R cells treated for 18 hours with SC-26196 (10 μM) or equal amount of DMSO (n = 3, one of two experiments). (E and F) Mitogreen (E) and TMRE (F) staining in primary adrenocortical cells treated for 18 hours with SC-26196 (10 μM) or DMSO (n = 6). MFI, mean fluorescence intensity. (G) OCR measurement of primary adrenocortical cells treated for 18 hours with SC-26196 or DMSO (n = 4). AUC, area under curve (H) Cholesterol levels determined by LC-MS/MS in mitochondrial fractions of NCI-H295R cells treated for 18 hours with SC-26196 or DMSO and stimulated or not with forskolin (FSK; 1 μM) for 15 min. Results of three independent experiments are shown here. (I) Progesterone, 11-deoxycorticosterone, corticosterone, and aldosterone levels were determined by LC-MS/MS in supernatants of primary adrenal cell cultures treated for 18 hours with SC-26196 or DMSO and then stimulated or not for 1 hour with ACTH (10 ng/ml) in the presence of SC-26196 or DMSO. The cell culture medium was changed before ACTH treatment (n = 12). Data in (B), (H), and (I) are shown as mean ± SEM, *P < 0.05; **P < 0.01; ***P < 0.001; ****P < 0.0001.
Fig. 2.
Fig. 2.. HFD reprograms the adrenal lipidome and increases glucocorticoid production.
(A) Progesterone and corticosterone plasma levels in mice fed for 20 weeks a LFD or HFD (n = 8 to 12). (B and C) Fads2 mRNA expression (B) and protein expression (C) in adrenal glands of LFD and HFD mice (n = 4 to 6). (D) Immunofluorescence for FADS2 (red) and 4′,6-diamidino-2-phenylindole (DAPI; blue) in adrenal glands of LFD- and HFD mice (1 of 5 mice per condition). Scale bars, 200 μm, zoomed-in inserts are shown at the right. (E) Acyl chain profile of nonstorage lipids analyzed by shotgun lipidomics. Lipids in adrenal glands from lean and obese mice were grouped according to the acyl chain within each lipid class (mol % is relative to the lipid class). Only the features with a mean abundance >5 mol % are shown, mean mol % ± SD is shown (n = 7 to 8). (F) Acyl chain isomers in phospholipids in adrenal glands of LFD and HFD mice determined by HPLC-MS (n = 5 to 6). (G to M) RNA-seq in the adrenal cortex of LFD and HFD mice (n = 4 mice per group). Volcano plot showing differentially expressed genes in HFD versus LFD mice (G). Heatmap of differentially expressed genes involved in fatty acid processing (P adjusted < 0.05) (H). EGSEA of RNA-seq data in the adrenal cortex of HFD versus LFD mice showing 10 among most up-regulated metabolic pathways (KEGG database) (I). GSEA for genes involved in biosynthesis of unsaturated fatty acids (J), fatty acid metabolism (K), steroid biosynthesis (L), and mitochondrial envelope formation (M). NES, normalized enrichment score; FDR, false discovery rate. (N) Progesterone, 11-deoxycorticosterone, and corticosterone levels in supernatants of primary adrenal cell cultures treated for 18 hours with SC-26196 (10 μM) or DMSO (Ctrl) in the presence or absence of ARA (150 μM) (n = 6 to 8). Data in (A) to (C) are shown as mean ± SD and in (F) and (N) as mean ± SEM. *P < 0.05; **P < 0.01; ***P < 0.001.
Fig. 3.
Fig. 3.. Medulla-derived PUFAs promote adrenocortical steroidogenesis.
(A) Relative Fads2 expression in the adrenal medulla of mice fed for 20 weeks a LFD or HFD (n = 5 to 6 mice per group). Tbp was used as a housekeeping gene. (B) FFA were measured in the adrenal medulla of mice fed for 20 weeks a LFD or HFD by HPLC-MS (n = 3 mice per group). Results are presented as % of total FFA. (C) FFA measured in the supernatants of adrenal medulla explants kept for 18 hours in 100 μl of medium. Results are presented as % of total FFAs (n = 4). (D) Adrenocortical cells were treated for 6 hours with SC-26196 (10 μM) or DMSO and then received medulla explant–conditioned or control medium for another 18 hours. Steroids were measured in the adrenocortical cell supernatant by LC-MS/MS (n = 4 to 6). (E) Adrenal medulla explants were treated for 6 hours with SC-26196 (10 μM) or DMSO, washed thoroughly, and left another 18 hours in culture. Their supernatant was then applied on adrenocortical cell cultures, and 8 hours later, adrenocortical cell supernatants were collected and analyzed by LC-MS/MS (n = 8). Data in (A), (B), (D), and (E) are shown as mean ± SEM. *P < 0.05; **P < 0.01; ***P < 0.001; ****P < 0.0001. ns, not significant.
Fig. 4.
Fig. 4.. FADS2 inhibition reduces corticosteroid levels in obese mice.
(A) Schematic representation of the experimental setup. (B) Corticosterone and 11-dehydrocorticosterone levels were determined by LC-MS/MS at feeding week 14 in hair of HFD mice receiving or not for 6 weeks SC-26196. Steroid concentrations were normalized to hair weight (B). (C) FFA were measured by HPLC-MS in the adrenal glands of mice fed a HFD with or without SC-26196 (n = 8 to 10 mice per group). Data are presented as mean ± SEM, *P < 0.05; **P < 0.01; ****P < 0.0001.
Fig. 5.
Fig. 5.. Dietary supplementation with icosapent ethyl reduces corticoid levels in obese mice.
(A) Schematic representation of the experimental setup. (B to D) Acyl chains of phospholipids (B), FFA (C), and lipid mediators (D) were measured by HPLC-MS in the adrenal glands of mice fed a HFD with or without icosapent ethyl (n = 7 mice per group). (E) Volcano plot based on RNA-seq data in the adrenal cortex of mice, which received HFD supplemented with icosapent ethyl versus mice fed a HFD without icosapent ethyl (n = 4 mice per group). (F to I) GSEA analysis for genes related to fatty acid metabolism, cholesterol homeostasis, steroid biosynthesis, and mitochondrial envelope formation (n = 4 mice per group). (J and K) Corticosterone and aldosterone plasma levels in mice, which received HFD without and with icosapent ethyl, measured by LC-MS/MS (n = 7 mice per group). (L and M) Primary CD31CD45 adrenocortical cells (L) and NCI-H295R cells (M) were treated with 66 μM EPA for 18 or 48 hours, respectively, and Fads2 expression was determined by qPCR using 18S expression as a housekeeping gene [n = 7 in (L) and n = 8 in (M)]. (N) NCI-H295R cells were treated for 48 hours with 66 μM EPA and stimulated or not with forskolin (FSK;1 μM) in the last 24 hours. Steroids were measured in the culture supernatant by LC-MS/MS (n = 6). (O) Primary adrenocortical cells were treated for 18 hours with 66 μM EPA and stimulated or not with ACTH (10 ng/ml). Steroids were measured in the culture supernatant by LC-MS/MS (n = 10). Data in (B) to (D) and (L) and (M) are presented as mean ± SEM, data in (N) and (O) as mean ± SD. *P < 0.05; **P < 0.01; ***P < 0.001; ****P < 0.0001. N.D., not determined.
Fig. 6.
Fig. 6.. FADS2 deficiency perturbs adrenal gland function.
(A) Scheme demonstrating the experimental setup. (B and C) FADS2 deletion efficiency in Fads2−/− mice. FADS2 expression was determined in adrenal glands of WT and Fads2−/− mice by qPCR using Tbp expression as a housekeeping gene (B) and Western blot using α-Tubulin as a loading control (C) (n = 3 mice per group). (D) Progesterone, corticosterone, and aldosterone levels in the plasma of WT and Fads2−/− mice fed a low-PUFA or PUFA-rich diet (n = 6 to 9 mice per group). (E) Western blot for StAR in adrenal glands of WT and Fads2−/− mice fed a low-PUFA or PUFA-rich diet. α-Tubulin was used as a loading control (n = 3 mice per group). (F and G) Acyl chain composition of phospholipids in the adrenal gland of WT and Fads2−/− mice fed a low-PUFA or PUFA-rich diet (n = 6 mice per group). Results are presented as % of all phospholipidic acyl chains (F) and as ng per adrenal gland (G). OA, oleic acid; EA, elaidic acid. (H) Representative electron microscopy images of adrenocortical cells; adrenal glands of two WT and two Fads2−/− mice fed a low-PUFA and 1 WT and 1 Fads2−/− mice fed a PUFA-rich diet were imaged (magnification 6,800x). Scale bars, 1 μM. Asterisks (*) depict lipid droplets, and arrowheads (>) depict mitochondria. (I to L) Quantification of mitochondrial area (I), perimeter (J), aspect ratio (K), and circularity (L) in WT and Fads2−/− mice fed a low-PUFA or PUFA-rich diet (in total, 198 to 429 mitochondria were quantified in two WT and two Fads2−/− mice fed a low-PUFA and one WT and one Fads2−/− mice fed a PUFA-rich diet). Data in (B), (D), and (G) are shown as means ± SEM. *P < 0.05; **P < 0.01; ****P < 0.0001.
Fig. 7.
Fig. 7.. FADS2 expression is increased in aldosterone-producing adenomas.
(A) FADS2 expression was determined in nontumorous adrenocortical tissue from pheochromocytoma patients (n = 6 patients), non-active adenomas (n = 10 patients), and aldosterone-producing adenomas (Conn adenomas) (n = 30 patients) by qPCR using 18S as a housekeeping gene. (B) Pre-operative aldosterone plasma levels in the same patients as in (A) were measured by LC-MS/MS. (C) Correlation of FADS2 with STAR expression in aldosterone- and cortisol-producing adrenocortical adenomas from 30 and 7 patients, respectively. FADS2 and STAR expression was determined by qPCR using 18S as a housekeeping gene. Data in (A) and (B) are presented as mean ± SEM. *P < 0.05; **P < 0.01; ****P < 0.0001

References

    1. R. D. Feldman, Aldosterone and blood pressure Regulation. Hypertension 63, 19–21 (2014). - PubMed
    1. S. L. Lightman, M. T. Birnie, B. L. Conway-Campbell, Dynamics of ACTH and cortisol secretion and implications for disease. Endocr. Rev. 41, bnaa002 (2020). - PMC - PubMed
    1. C. A. Koch, Cushing syndrome and glucocorticoid excess, in Disorders of Blood Pressure Regulation: Phenotypes, mechanisms, therapeutic options, A. Berbari, G. Mancia, Eds, (Springer, 2018), pp. 481–512.
    1. D. A. Calhoun, K. Sharma, The role of aldosteronism in causing obesity-related cardiovascular risk. Cardiol. Clin. 28, 517–527 (2010). - PMC - PubMed
    1. M. M. Swierczynska, I. Mateska, M. Peitzsch, S. R. Bornstein, T. Chavakis, G. Eisenhofer, V. Lamounier-Zepter, S. Eaton, Changes in morphology and function of adrenal cortex in mice fed a high-fat diet. Int. J. Obes. (Lond) 39, 321–330 (2015). - PubMed

Substances