. 2023 Jul 21;9(29):eadf7195.
doi: 10.1126/sciadv.adf7195. Epub 2023 Jul 21.

Targeting polyploid giant cancer cells potentiates a therapeutic response and overcomes resistance to PARP inhibitors in ovarian cancer

Affiliations

Targeting polyploid giant cancer cells potentiates a therapeutic response and overcomes resistance to PARP inhibitors in ovarian cancer

Xudong Zhang et al. Sci Adv. .

Abstract

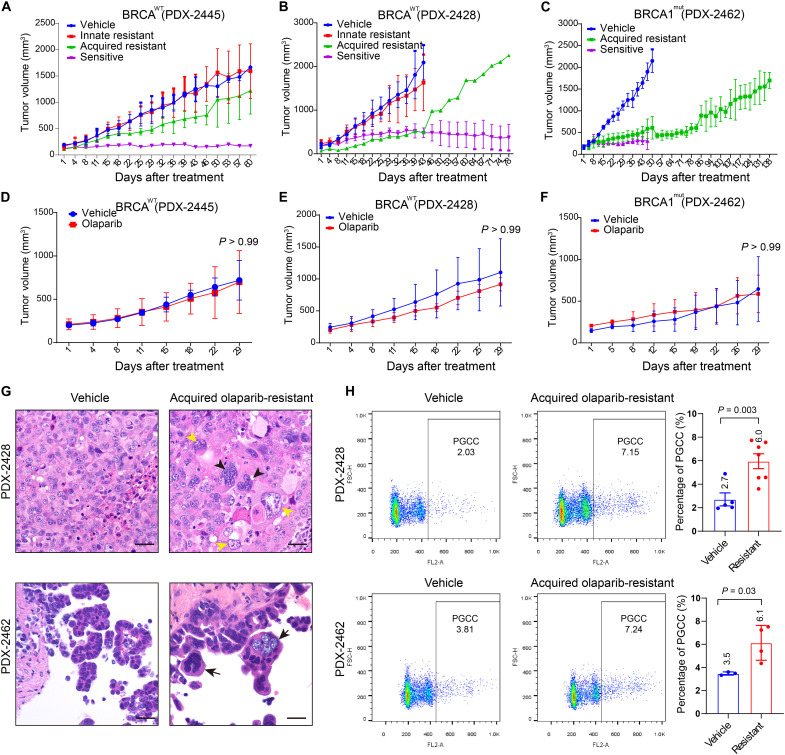
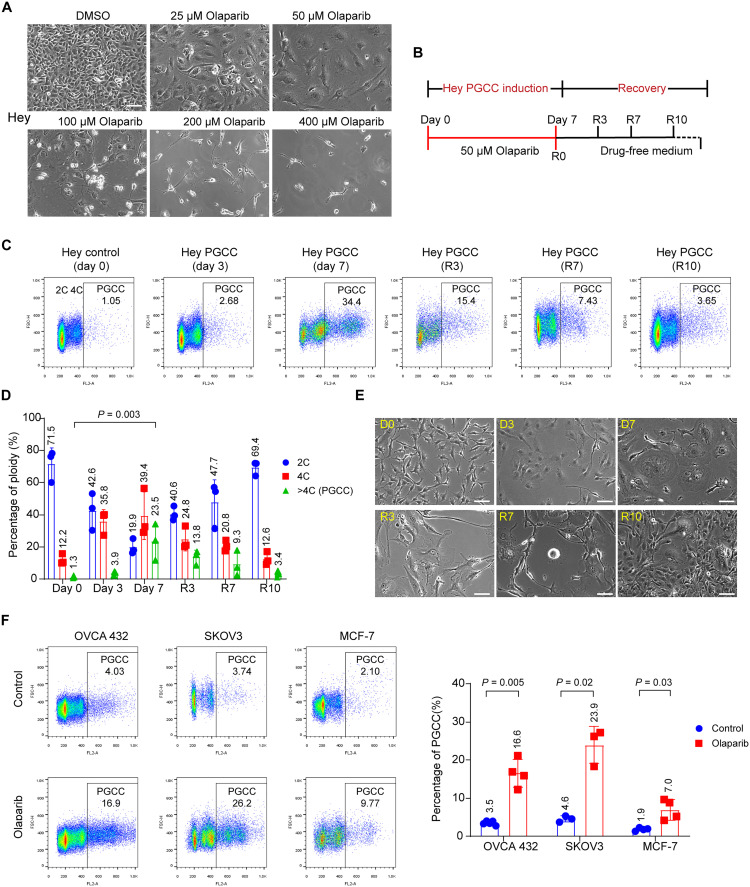
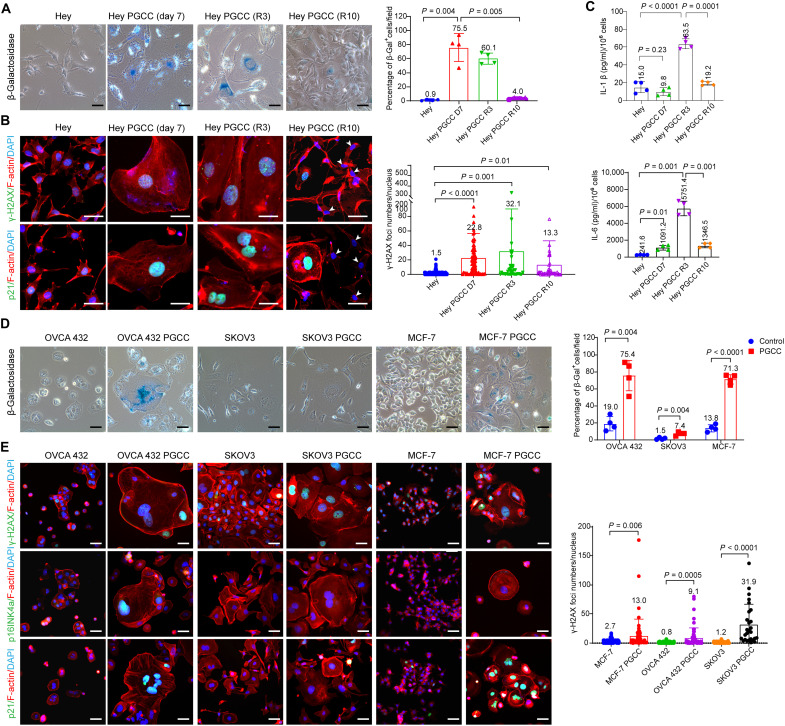
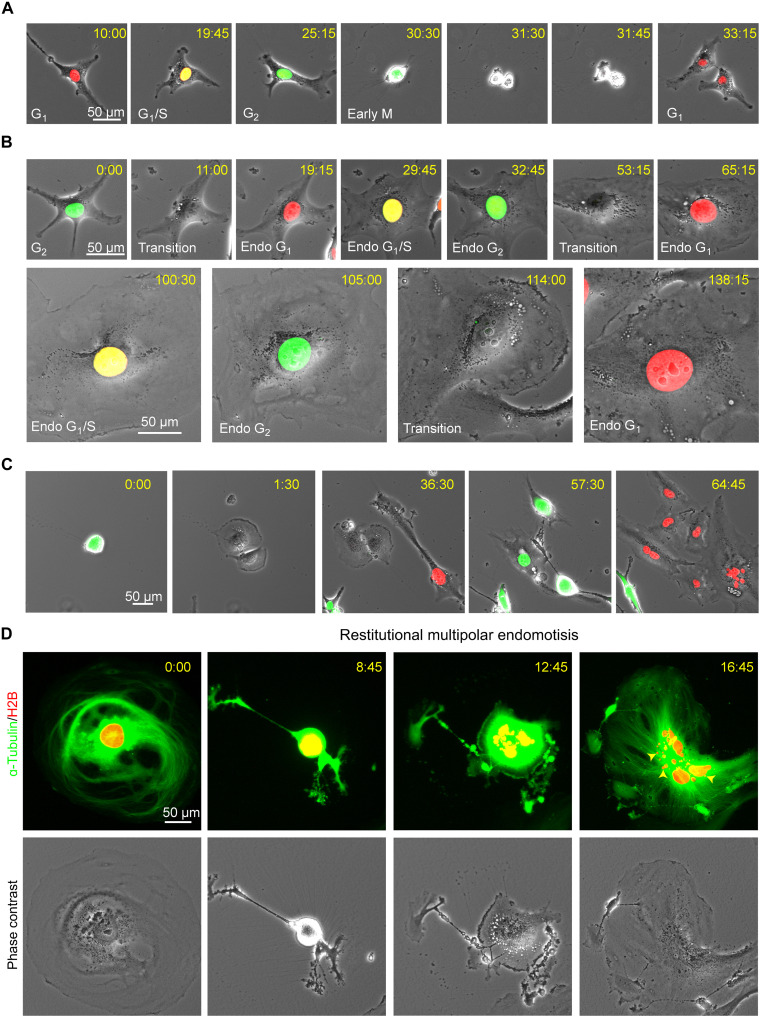
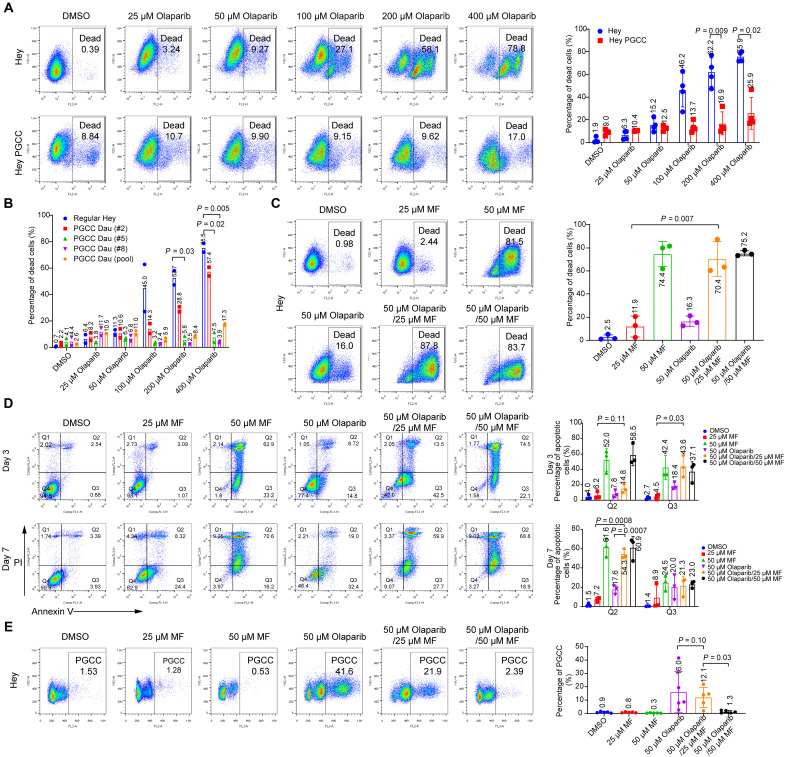
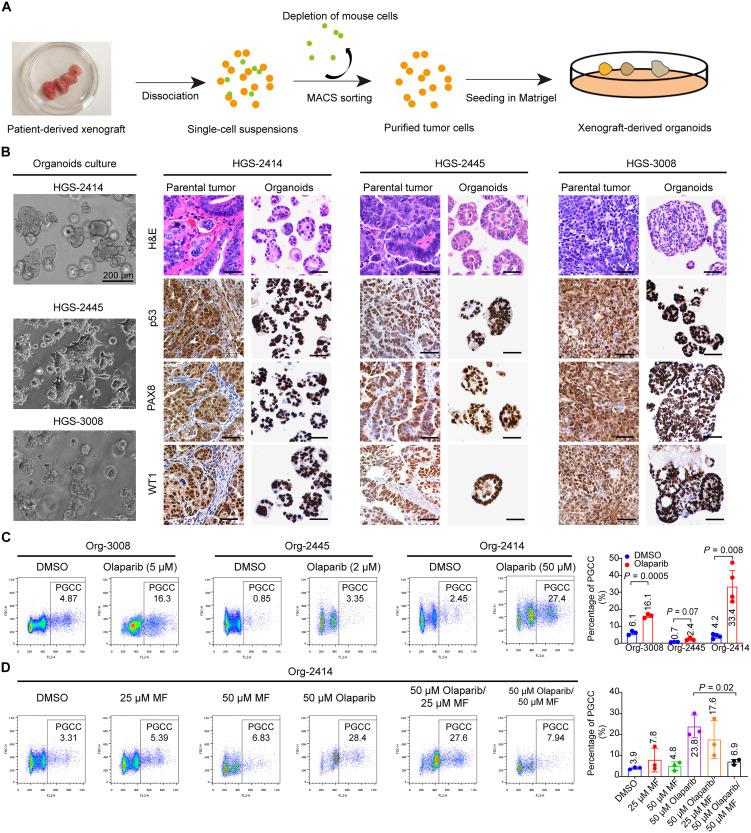
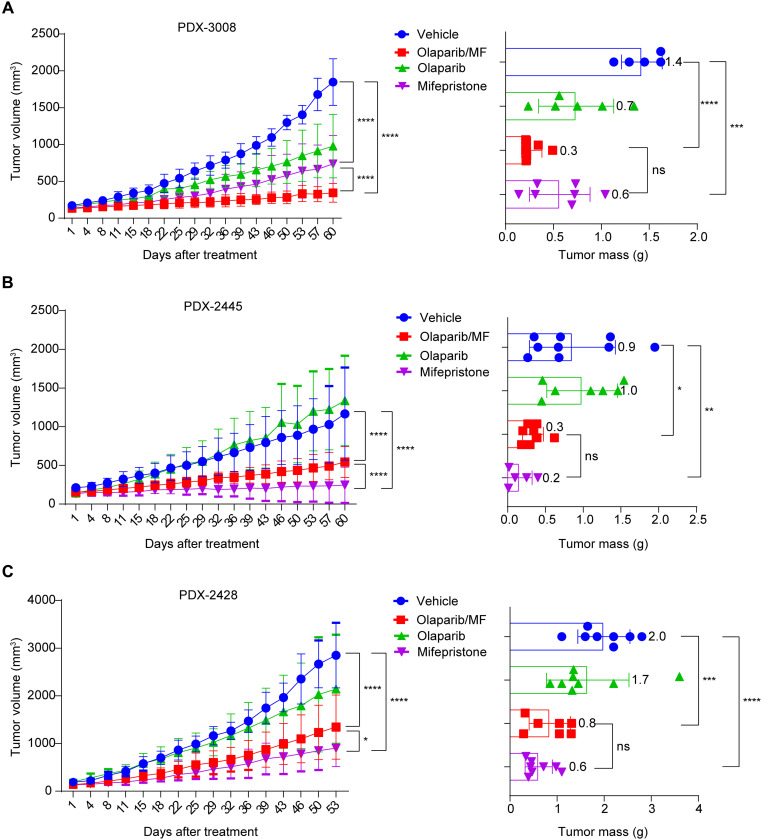
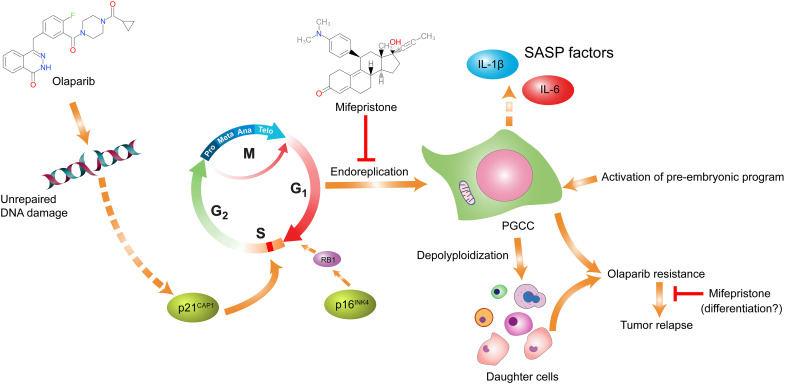
To understand the mechanism of acquired resistance to poly(ADP-ribose) polymerase inhibitors (PARPi) olaparib, we induced the formation of polyploid giant cancer cells (PGCCs) in ovarian and breast cancer cell lines, high-grade serous cancer (HGSC)-derived organoids, and patient-derived xenografts (PDXs). Time-lapse tracking of ovarian cancer cells revealed that PGCCs primarily developed from endoreplication after exposure to sublethal concentrations of olaparib. PGCCs exhibited features of senescent cells but, after olaparib withdrawal, can escape senescence via restitutional multipolar endomitosis and other noncanonical modes of cell division to generate mitotically competent resistant daughter cells. The contraceptive drug mifepristone blocked PGCC formation and daughter cell formation. Mifepristone/olaparib combination therapy substantially reduced tumor growth in PDX models without previous olaparib exposure, while mifepristone alone decreased tumor growth in PDX models with acquired olaparib resistance. Thus, targeting PGCCs may represent a promising approach to potentiate the therapeutic response to PARPi and overcome PARPi-induced resistance.


Figures

Fig. 1.
Fig. 1.. Establishment of olaparib-resistant PDX models of BRCAWT and BRCA1MUT ovarian HGSC.
(A to C) Tumor growth curves of HGSC xenografts. Mice were treated with vehicle or olaparib (50 mg/kg per day, 5 days/week) for 60 days. Data are shown as mean ± SD. (A) BRCAWT PDX-2445: vehicle (n = 3), olaparib (n = 10). (B) BRCAWT PDX-2428: vehicle (n = 3), olaparib (n = 8). (C) BRCA1MUT PDX-2462: vehicle (n = 3), olaparib (n = 7). (D to F) Validation of acquired olaparib resistance in xenograft tumors. Olaparib-treated PDX tumors were harvested, retransplanted into different mice, and expanded. PDX-bearing mice were then treated with vehicle or olaparib (50 mg/kg per day, 5 days/week). (D) PDX-2445: vehicle (n = 3), olaparib (n = 5). (E) PDX-2428: vehicle (n = 3), olaparib (n = 6). (F) PDX-2462: vehicle (n = 3), olaparib (n = 3). Data are shown as mean ± SD [two-way analysis of variance (ANOVA)]. (G) Representative hematoxylin and eosin (H&E)–stained sections of PDX-2428 and PDX-2462 xenografts. The vehicle-treated tumors mostly consist of relatively uniform tumor cells. In contrast, the tumors with acquired olaparib resistance exhibit enriched PGCCs in the forms of multinucleated giant cells (black arrowheads) or mononucleated giant cells (yellow arrowheads). Scale bars, 50 μm. (H) Propidium iodide (PI) flow cytometry quantification of polyploidy in PDX-2428 and PDX-2462 xenografts. PDX-2428: vehicle (n = 5), resistant (n = 7). PDX-2462: vehicle (n = 3), resistant (n = 4). Cells with DNA content > 4C were defined as PGCCs. Data are shown as mean ± SD. The exact P values are shown on the graph (Welch’s t test).
Fig. 2.
Fig. 2.. Olaparib induces the formation of PGCCs.
(A) Representative phase-contrast microscopy images of Hey HGSC cells exposed to the indicated concentrations of olaparib or vehicle (0.1% DMSO) for 7 days. The sublethal concentration of olaparib (50 μM) led to formation of PGCCs, characterized by enlarged cytoplasm and nuclei. Scale bar, 100 μm. (B) Schematic illustration of induction of PGCCs and PGCC-derived daughter cells. Hey cells were treated with 50 μM olaparib for 7 days. Cells were then allowed to recover in drug-free culture medium for up to 10 days to generate daughter cells. R0 refers to the day on which olaparib was withdrawn. (C and D) PI flow cytometry quantification of polyploidy in Hey cells exposed to 50 μM olaparib at the indicated times. The exact P values are shown on the graph (one-way ANOVA). (E) Representative phase-contrast microscopy images showing the morphological changes in Hey cells exposed to olaparib at the indicated times. Freshly seeded Hey cells are slender. Once exposed to 50 μM of olaparib, cells gradually became flattened with enlarged cytoplasm and nuclei. PGCCs proliferated and produced daughter cells during recovery (R) days 3 to 10. Scale bars, 100 μm. (F) PI flow cytometry quantification of polyploidy (left) and PGCCs as a percentage of total tumor cells (right) in human ovarian and breast cancer cell lines. OVCA-432 PGCCs were induced by exposure to 400 μM olaparib for 72 hours and then allowed to recover for another 72 hours. SKOV3 and MCF-7 PGCCs were induced by exposure to 50 μM olaparib for 7 days. Each data point corresponds to one biological replicate in (C), (D), and (F), and data are shown as mean ± SD. The exact P values are shown on the graph (Welch’s t test).
Fig. 3.
Fig. 3.. PGCCs exhibit multiple characteristics of senescent cells.
(A) Representative images (left) and quantification (right) of β-galactosidase (β-gal) staining of control Hey cells and Hey PGCCs. The β-gal–positive cells exhibit dark blue staining in the cytoplasm. Scale bars, 50 μm. Four randomly selected fields per group (10× objective lenses) were used for quantification analysis. (B) Immunofluorescence images of γ-H2AX foci and p21 expression (left) and quantification (right) of γ-H2AX foci number in control Hey cells and Hey PGCCs at the indicated times. Both γ-H2AX foci and p21 expression were highly elevated in the nuclei of PGCCs on treatment day 7 and gradually decreased during the recovery period in the PGCC-derived daughter cells (white arrowheads). Scale bars, 50 μm. Filamentous actin (F-actin) was visualized by phalloidin staining. At least 50 cells per group were counted and used for quantification. (C) Hey PGCCs were induced by exposure of Hey cells to 50 μM olaparib for 7 days and allowed to recover for 3 or 10 days. Supernatants were collected and analyzed for IL-1β and IL-6 secretion by ELISA. Each data point corresponds to one biological replicate. (D) Phase-contrast images (left) and quantification (right) of β-gal staining of control OVCA-432, SKOV3, and MCF-7 cells and their corresponding PGCCs. Scale bars, 50 μm. Four randomly selected fields per group (10× objective lenses) were used for quantification analysis. (E) Immunofluorescence images (left) of γ-H2AX foci, p16INK4a, and p21 expression and quantification (right) of γ-H2AX foci in the indicated cell lines and their corresponding PGCCs. Scale bars, 50 μm. At least 50 cells per group were counted and used for quantification (27 cells for SKOV3 PGCCs). Data are shown as mean ± SD in (A) to (E). The exact P values are shown on the graph (Welch’s t test).
Fig. 4.
Fig. 4.. Olaparib induces the formation of PGCCs through endoreplication.
Time-lapse monitoring of Hey cells labeled with FUCCI (A to C) or histone H2B-mCherry and EGFP-ɑ-tubulin (D). The FUCCI system labels nuclei in red at the G1 phase, yellow at the G1/S transition phase, and green at the S/G2/M phases. (A) The typical mitotic cell cycle consists of interphase (G1, S, and G2) and mitosis (M). (B) Tracking of cell cycle changes in a Hey cell exposed to 50 μM olaparib. A diploid Hey cell gradually becomes a mononucleated PGCC after undergoing multiple cycles of endoreplication without cell division under olaparib treatment. (C) A Hey PGCC re-enters the mitosis cycle to generate daughter cells with strong self-renewal capacity. (D) A mononucleated PGCC generates a multinucleated PGCC via restitutional multipolar endomotisis. The yellow arrowheads indicate micronuclei.
Fig. 5.
Fig. 5.. Mifepristone inhibits olaparib-mediated PGCC formation by promoting apoptosis.
(A) Hey cells and Hey PGCCs were treated with vehicle (0.1% DMSO) or olaparib at the indicated concentrations for 7 days, stained with PI, and analyzed with flow cytometry. Representative percentages of dead cells are shown on the left, and statistical analysis results are shown on the right. (B) Quantitative analysis of olaparib sensitivity in Hey and Hey PGCC daughter cells. Hey cells and Hey PGCC-derived daughter (Dau) cells (derived from a single PGCC or pooled PGCCs) were exposed to the indicated increasing concentrations of olaparib for 7 days and assayed by PI staining. Data represent mean ± SD from two independent experiments. (C) Hey cells were treated with the indicated concentrations of mifepristone (MF) alone, olaparib alone, or a combination of both drugs for 7 days. Cell viability was determined by PI flow cytometry. Percentages of dead cells are shown on the left, and statistical analysis results are shown on the right. (D) Hey cells were treated with the indicated concentrations of MF or olaparib alone or with a combination of both drugs for 3 or 7 days. Apoptotic cells were identified by annexin V–PI staining. Q2 and Q3 represent the late apoptotic cells and early apoptotic cells, respectively. Statistical analysis results are shown on the right. (E) Hey cells were exposed to 50 μM olaparib with or without MF for 7 days to induce PGCC formation. Polyploidy was measured by PI flow cytometry analysis, and the percentage of PGCCs is shown. Data are shown as mean ± SD in (A) to (E). Each data point corresponds to one biological replicate in (A), (C), (D), and (E). The exact P values are shown on the graph (Welch’s t test).
Fig. 6.
Fig. 6.. Olaparib enhances polyploidy in patient-derived ovarian cancer organoids.
(A) Flowchart of procedures for establishing organoids from PDXs. MACS, magnetic-activated cell sorting. (B) Phase-contrast images of 3 HGSC organoids (left) together with H&E and immunohistochemical staining (right) in organoids and corresponding parental tumors. Tumors and organoids showed robust expression of p53, PAX8 (a marker of serous subtype), and WT1 in the nucleus. Scale bars, 100 μm (right). (C) PI flow cytometry analysis (left) and quantification (right) of polyploidy in human ovarian cancer-derived organoids. Organoids (Org) were exposed to vehicle (DMSO) or olaparib at the indicated concentrations for 7 days and then collected and dissociated into single cells. Polyploidy was determined by PI flow cytometry analysis. (D) PI flow cytometry analysis (left) and quantification (right) of polyploidy in Org-2414. Org-2414 was exposed to the indicated concentrations of mifepristone (MF), 50 μM olaparib, or a combination of both drugs for 7 days. Data are shown as mean ± SD in (C) and (D). Each data point corresponds to one biological replicate. The exact P values are shown on the graph (Welch’s t test).
Fig. 7.
Fig. 7.. Mifepristone mitigates tumor growth in ovarian HGSC PDX models.
(A) Ovarian HGSC PDX-3008 xenografts (BRCAWT, olaparib-naive tumors) were treated with olaparib (n = 6), mifepristone (n = 7), vehicle (n = 5), or olaparib in combination with mifepristone (n = 7) for 60 days. The left shows the mean tumor volume in the xenograft-bearing mice at the indicated times; the right shows the tumor mass after 60 days of treatment. Mifepristone monotherapy and mifepristone/olaparib treatment significantly suppressed tumor growth compared with vehicle (two-way ANOVA, ****P < 0.0001). Tumors treated with mifepristone alone (Welch’s t test, ***P = 0.0002) and those treated with mifepristone/olaparib (****P < 0.0001) had significantly smaller masses at harvest than did vehicle-treated tumors. Error bars indicate SD. (B) Olaparib-resistant BRCAWT ovarian HGSC PDX-2445 xenografts were treated with olaparib (n = 7), mifepristone (n = 5), vehicle (n = 9), or mifepristone/olaparib (n = 8) for 60 days. Both mifepristone monotherapy (two-way ANOVA, ****P < 0.0001) and mifepristone/olaparib combination therapy (****P < 0.0001) significantly suppressed tumor growth compared with vehicle treatment. Tumors treated with mifepristone monotherapy (Welch’s t test, **P = 0.0061) and mifepristone/olaparib combination therapy (*P = 0.0257) had significantly smaller masses at harvest (60 days after treatment) than did vehicle-treated tumors. Error bars indicate SD. (C) Olaparib-resistant BRCAWT ovarian HGSC PDX-2428 xenografts were treated with olaparib (n = 8), mifepristone (n = 8), vehicle (n = 8), or mifepristone/olaparib (n = 7) for 53 days. Both mifepristone monotherapy (two-way ANOVA, ****P < 0.0001) and mifepristone/olaparib combination treatment (****P < 0.0001) significantly suppressed tumor growth compared with vehicle treatment. Tumors treated with mifepristone monotherapy (Welch’s t test, ****P < 0.0001) and mifepristone/olaparib combination therapy (***P = 0.0006) had significantly smaller masses at harvest than did vehicle-treated tumors. Error bars indicate SD. ns, not significant.
Fig. 8.
Fig. 8.. Schematic model on how mifepristone potentiates olaparib-induced therapeutic response and blocks acquired resistance to PARPi in ovarian cancer.
Continuous exposure to olaparib results in unrepaired DNA damage, causing the activation of the aberrant endoreplication cell cycle. Cells that undergo endoreplication develop into senescent PGCCs, which give rise to daughter cells via a variety of modes of depolyploidization. The daughter cells acquired resistance via the life cycle of PGCCs and escaped senescence, eventually leading to tumor recurrence. The combined use of mifepristone and olaparib could block the development of PGCCs, thereby suppressing tumor growth. In tumors with acquired resistance, mifepristone can directly attenuate tumor growth, possibly by inducing differentiation toward benign lineages.

References

    1. Cancer Genomic Atlas Research Network , Integrated genomic analyses of ovarian carcinoma. Nature 474, 609–615 (2011). - PMC - PubMed
    1. H. E. Bryant, N. Schultz, H. D. Thomas, K. M. Parker, D. Flower, E. Lopez, S. Kyle, M. Meuth, N. J. Curtin, T. Helleday, Specific killing of BRCA2-deficient tumours with inhibitors of poly(ADP-ribose) polymerase. Nature 434, 913–917 (2005). - PubMed
    1. M. P. Dias, S. C. Moser, S. Ganesan, J. Jonkers, Understanding and overcoming resistance to PARP inhibitors in cancer therapy. Nat. Rev. Clin. Oncol. 18, 773–791 (2021). - PubMed
    1. R. L. Coleman, A. M. Oza, D. Lorusso, C. Aghajanian, A. Oaknin, A. Dean, N. Colombo, J. I. Weberpals, A. Clamp, G. Scambia, A. Leary, R. W. Holloway, M. A. Gancedo, P. C. Fong, J. C. Goh, D. M. O'Malley, D. K. Armstrong, J. Garcia-Donas, E. M. Swisher, A. Floquet, G. E. Konecny, I. A. McNeish, C. L. Scott, T. Cameron, L. Maloney, J. Isaacson, S. Goble, C. Grace, T. C. Harding, M. Raponi, J. Sun, K. K. Lin, H. Giordano, J. A. Ledermann; ARIEL3 investigators , Rucaparib maintenance treatment for recurrent ovarian carcinoma after response to platinum therapy (ARIEL3): A randomised, double-blind, placebo-controlled, phase 3 trial. Lancet 390, 1949–1961 (2017). - PMC - PubMed
    1. K. A. Gelmon, M. Tischkowitz, H. Mackay, K. Swenerton, A. Robidoux, K. Tonkin, H. Hirte, D. Huntsman, M. Clemons, B. Gilks, R. Yerushalmi, E. Macpherson, J. Carmichael, A. Oza, Olaparib in patients with recurrent high-grade serous or poorly differentiated ovarian carcinoma or triple-negative breast cancer: A phase 2, multicentre, open-label, non-randomised study. Lancet Oncol. 12, 852–861 (2011). - PubMed

Publication types