. 2023 Sep 8;46(9):zsad193.
doi: 10.1093/sleep/zsad193.

Pontine Waves Accompanied by Short Hippocampal Sharp Wave-Ripples During Non-rapid Eye Movement Sleep

Affiliations

Pontine Waves Accompanied by Short Hippocampal Sharp Wave-Ripples During Non-rapid Eye Movement Sleep

Tomomi Tsunematsu et al. Sleep. .

Abstract

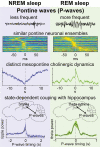
Ponto-geniculo-occipital or pontine (P) waves have long been recognized as an electrophysiological signature of rapid eye movement (REM) sleep. However, P-waves can be observed not just during REM sleep, but also during non-REM (NREM) sleep. Recent studies have uncovered that P-waves are functionally coupled with hippocampal sharp wave ripples (SWRs) during NREM sleep. However, it remains unclear to what extent P-waves during NREM sleep share their characteristics with P-waves during REM sleep and how the functional coupling to P-waves modulates SWRs. Here, we address these issues by performing multiple types of electrophysiological recordings and fiber photometry in both sexes of mice. P-waves during NREM sleep share their waveform shapes and local neural ensemble dynamics at a short (~100 milliseconds) timescale with their REM sleep counterparts. However, the dynamics of mesopontine cholinergic neurons are distinct at a longer (~10 seconds) timescale: although P-waves are accompanied by cholinergic transients, the cholinergic tone gradually reduces before P-wave genesis during NREM sleep. While P-waves are coupled to hippocampal theta rhythms during REM sleep, P-waves during NREM sleep are accompanied by a rapid reduction in hippocampal ripple power. SWRs coupled with P-waves are short-lived and hippocampal neural firing is also reduced after P-waves. These results demonstrate that P-waves are part of coordinated sleep-related activity by functionally coupling with hippocampal ensembles in a state-dependent manner.

Keywords: NREM sleep; PGO wave; REM sleep; sharp wave-ripples; theta rhythms.


Figures

None
Graphical abstract
Figure 1.
Figure 1.
P-waves during NREM and REM sleep. (A) A diagram of the experimental approach for P-wave recording, showing a cortical EEG electrode and a bipolar electrode for pontine EEG recording in the mouse. For EMG recording, a twisted bipolar electrode was also inserted in the neck muscle. (B) A photograph showing a track of a bipolar electrode in the mesopontine region. Scale bar, 500 µm. (C) Examples of P-waves during NREM (left) and REM sleep (right). (D) A diagram of the experimental approach to brainstem population recording, showing a cortical EEG electrode and a 32-channel silicon probe. (E) Examples of local field potentials (LFPs) and simultaneously recorded single unit activities (SUAs) during NREM (left) and REM sleep (right). Processed LFP signals for P-wave detection (red) are also shown. (F) Average waveforms of P-waves. blue, P-waves during NREM sleep; green, P-waves during REM sleep. Errors indicate SD. (G) Detected individual P-waves represented in first two PC (principal component) space. (H) Comparisons of average waveforms of P-waves (±50 milliseconds from the trough of P-waves) between sleep states based on Pearson’s correlation coefficient (n = 20, r = 0.97 ± 0.01).
Figure 2.
Figure 2.
Features of P-waves during NREM and REM sleep. (A) Comparison of P-wave frequency between sleep states. n = 38 recordings. *** p < 0.0001, signed-rank test. (B) Comparison of inter-P-wave intervals between sleep states. inset, comparison of the median intervals of P-waves between states. n = 38 recordings, *** p < 0.0001, signed-rank test. (C) Cross-correlation of bilateral P-wave timing. n = 9 recordings. (D) The relationship between P-wave frequency and sleep episode duration. Lines are linear regression lines. Bottom, distributions of P-wave frequency during NREM (blue) and REM sleep (green).
Figure 3.
Figure 3.
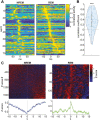
Brainstem neural firing associated with P-waves. (A) Normalized average firing profiles across cells during NREM (left) and REM sleep (right). Cells were sorted by peak timing during REM sleep. (B) Comparisons of mean firing profiles between sleep states across cells (n = 72) based on Pearson’s correlation coefficient. *** p < 0.0001, t-test. (C) Normalized (Z-scored) photometry signals of mesopontine cholinergic neurons associated with P-waves during NREM (left) and REM sleep (right). The top panels show individual normalized signal traces sorted by the first PC score. The color range is between −1.96 and 1.96 (equivalent to 0.05 P-value). The bottom panels show the average of the normalized signals.
Figure 4.
Figure 4.
Functional coupling between P-waves and hippocampal oscillations during REM and NREM sleep. (A) A diagram of the experimental approach to hippocampal population recording. (B) top, the average hippocampal LFPs triggered by P-wave timing. bottom, a scalogram of P-wave-triggered hippocampal LFPs. (C) The average of hippocampal theta (4–10 Hz) power relative to P-wave timing. Event-triggered theta power was computed across recordings (n = 7). (D) Temporal profiles of SWRs (blue) and P-waves (green) across NREM and REM sleep episodes. Each episode duration was divided into four discrete time bins as normalized time windows. (E) Cross-correlation between the ripple power (80–250 Hz) profile and P-waves during NREM sleep. Each cross-correlation profile was z-scored based on the profile in a −3~−2 seconds window. Inset, the asymmetry index, a normalized difference in the normalized ripple power before and after P-wave timing in a 250 milliseconds window. The negative value indicates the lower ripple power after P-waves. ** p < 0.005, t-test. n = 7. (F) Comparison of SWR duration between SWRs coupled with P-waves within 30 milliseconds (n = 84) and other SWRs (n = 16689). *** p < 0.001, rank-sum test. (G) Mean activity profiles of CA1 neurons (n = 65) relative to P-wave timing during NREM sleep. Cells were sorted by their first principal component score. (H) The modulation index, is a normalized difference in firing rate before and after P-waves in a 250 milliseconds window. Plus signs, outliers. *** p < 0.001, t-test.

References

    1. Adamantidis AR, Gutierrez Herrera C, Gent TC.. Oscillating circuitries in the sleeping brain. Nat Rev Neurosci. 2019;20(12):746–762. doi: 10.1038/s41583-019-0223-4 - DOI - PubMed
    1. Brown RE, Basheer R, McKenna JT, Strecker RE, McCarley RW.. Control of sleep and wakefulness. Physiol Rev. 2012;92(3):1087–1187. doi: 10.1152/physrev.00032.2011 - DOI - PMC - PubMed
    1. Buzsaki G. Hippocampal sharp wave-ripple: a cognitive biomarker for episodic memory and planning. Hippocampus. 2015;25(10):1073–1188. doi: 10.1002/hipo.22488 - DOI - PMC - PubMed
    1. Byron N, Semenova A, Sakata S.. Mutual interactions between brain states and alzheimer’s disease pathology: a focus on gamma and slow oscillations. Biology (Basel). 2021;10(8):707. doi: 10.3390/biology10080707 - DOI - PMC - PubMed
    1. Steriade M, McCormick DA, Sejnowski TJ.. Thalamocortical oscillations in the sleeping and aroused brain. Science. 1993;262(5134):679–685. doi: 10.1126/science.8235588 - DOI - PubMed

Publication types