. 2023 Aug 3;83(15):2792-2809.e9.
doi: 10.1016/j.molcel.2023.06.025. Epub 2023 Jul 20.

Genome-scale mapping of DNA damage suppressors through phenotypic CRISPR-Cas9 screens

Affiliations

Genome-scale mapping of DNA damage suppressors through phenotypic CRISPR-Cas9 screens

Yichao Zhao et al. Mol Cell. .

Abstract

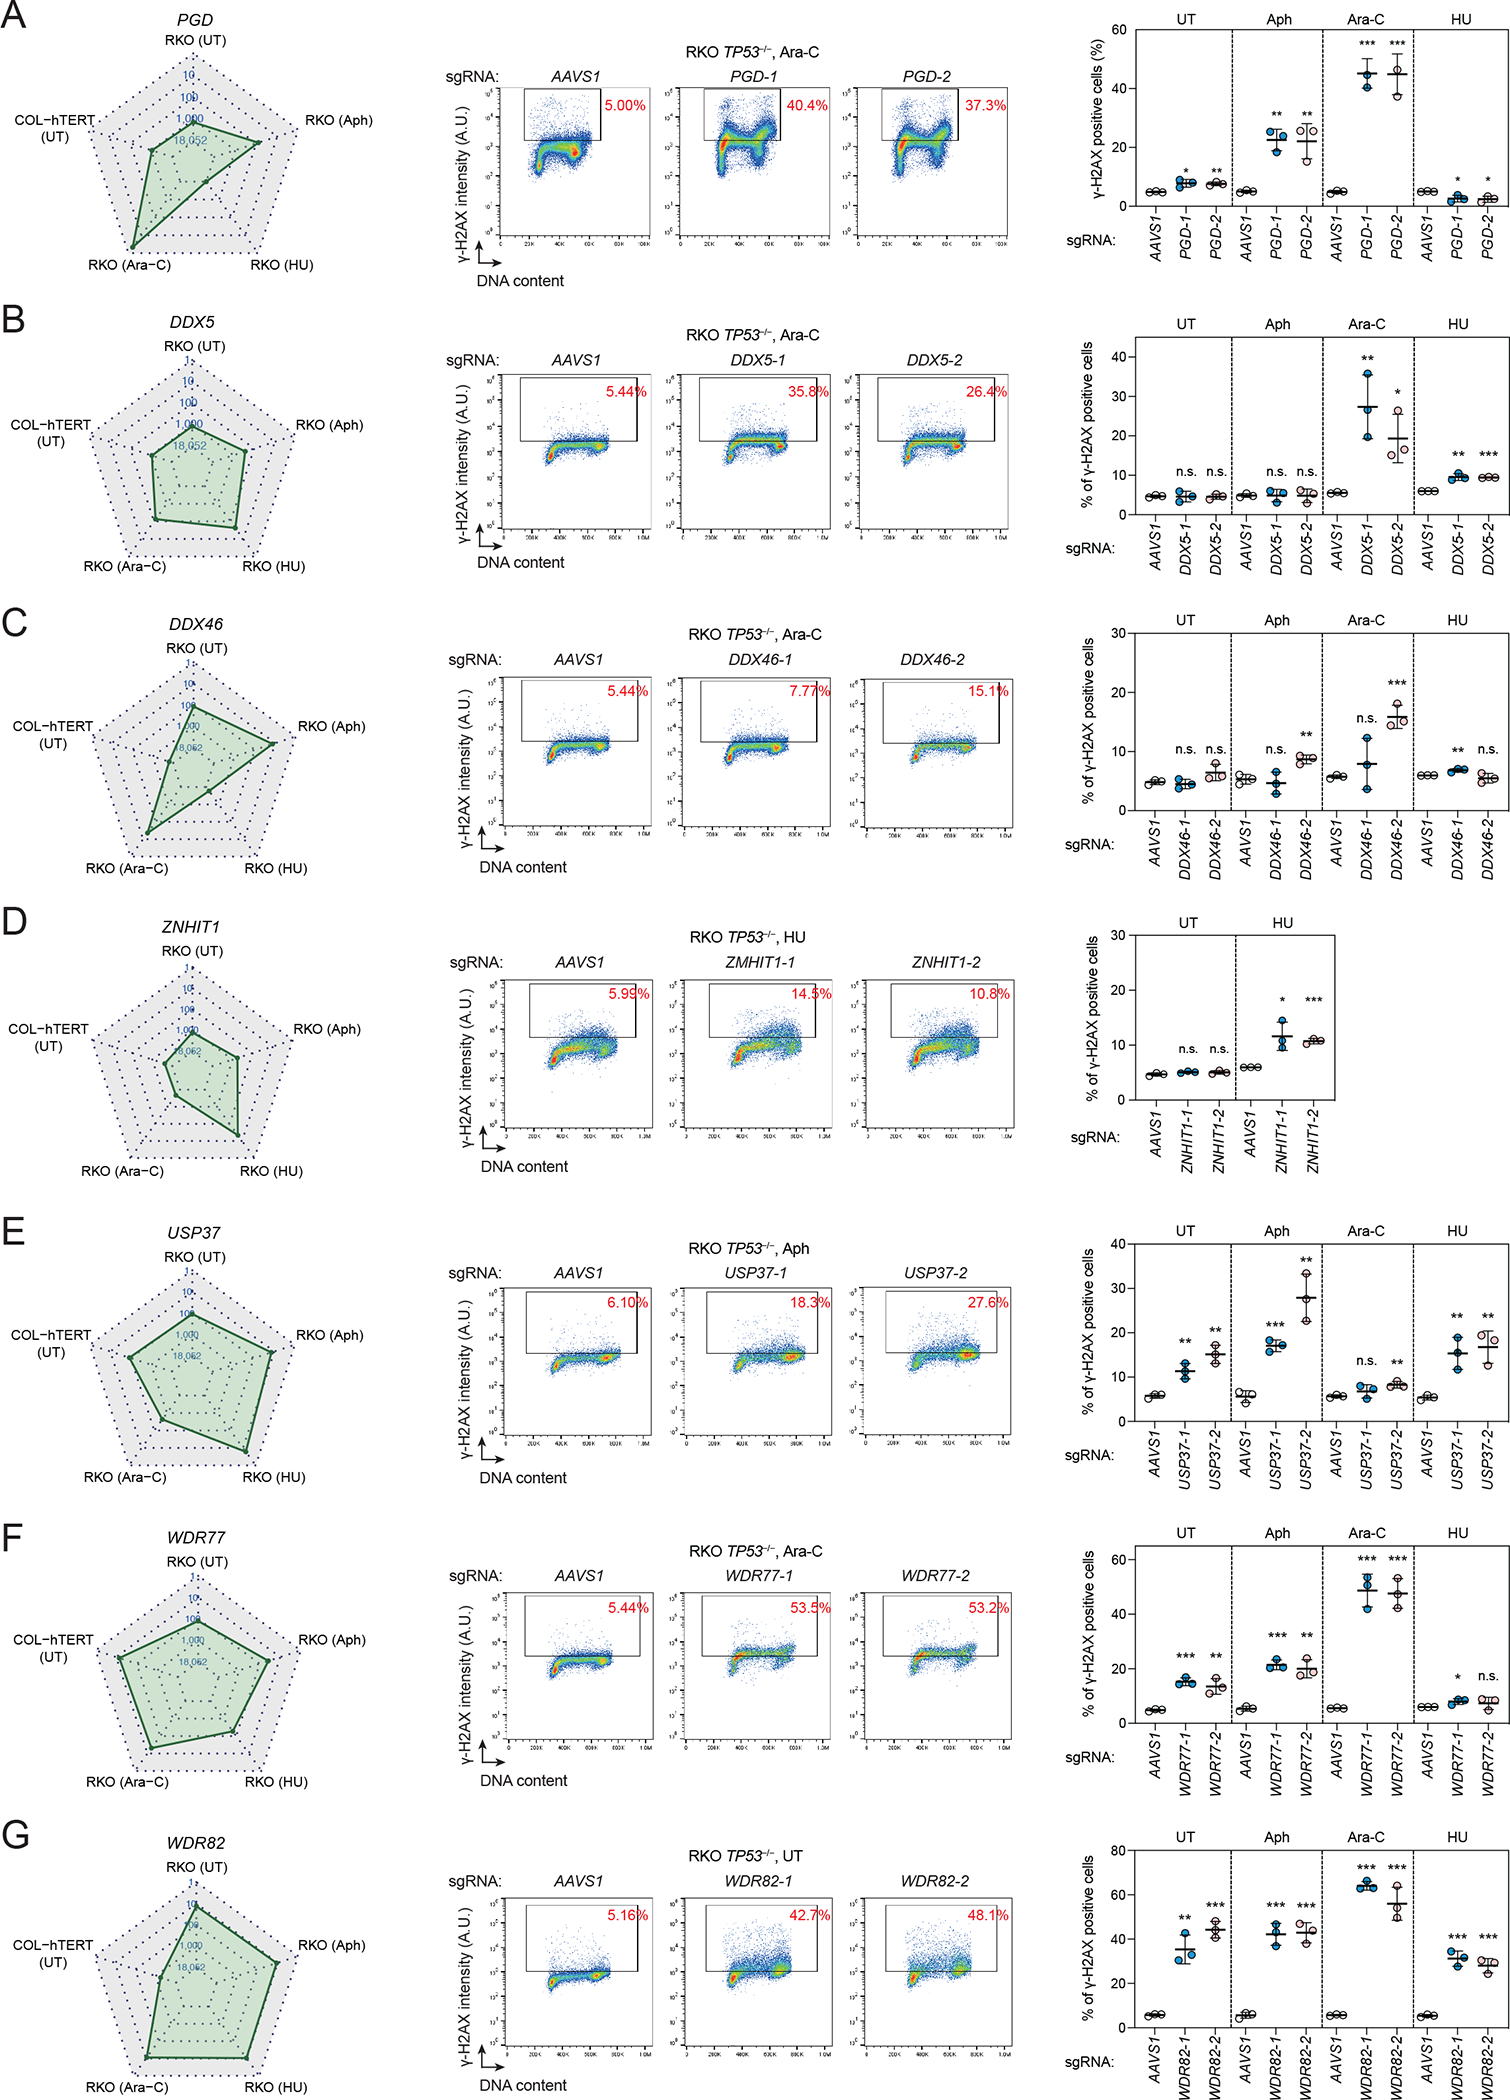
To maintain genome integrity, cells must accurately duplicate their genome and repair DNA lesions when they occur. To uncover genes that suppress DNA damage in human cells, we undertook flow-cytometry-based CRISPR-Cas9 screens that monitored DNA damage. We identified 160 genes whose mutation caused spontaneous DNA damage, a list enriched in essential genes, highlighting the importance of genomic integrity for cellular fitness. We also identified 227 genes whose mutation caused DNA damage in replication-perturbed cells. Among the genes characterized, we discovered that deoxyribose-phosphate aldolase DERA suppresses DNA damage caused by cytarabine (Ara-C) and that GNB1L, a gene implicated in 22q11.2 syndrome, promotes biogenesis of ATR and related phosphatidylinositol 3-kinase-related kinases (PIKKs). These results implicate defective PIKK biogenesis as a cause of some phenotypes associated with 22q11.2 syndrome. The phenotypic mapping of genes that suppress DNA damage therefore provides a rich resource to probe the cellular pathways that influence genome maintenance.

Keywords: ATR; DNA damage; DNA replication stress; TTT complex; cytarabine; genome stability.


Conflict of interest statement

Declaration of interests D.D. is a shareholder and advisor for Repare Therapeutics. A.-C.G. is a member of Molecular Cell’s Advisory Board.

Figures

Figure 1.
Figure 1.. Phenotypic CRISPR screens for genes that suppress spontaneous DNA damage.
(A) Schematic of the phenotypic CRISPR screens based on γ-H2AX staining and cell sorting. (B) Manhattan dot plots of γ-H2AX screen results in untreated (UT) RKO TP53−/− cells. The top 15 genes are highlighted. (C) Gene Ontology (GO) analysis of Biological Process for 160 γ-H2AX suppressors in RKO TP53−/− cells, visualized by GO-Figure! (D) STRING network analysis of 138 γ-H2AX suppressors in RKO TP53−/− cells. Pathways were manually curated and labeled with different colors: green, Fe-S cluster assembly; orange, nucleotide biosynthesis; brown, mitochondrial function; yellow, RNA metabolism and transcription; pink, telomere maintenance; purple, DNA repair; blue, DNA replication; red, ATR signaling; grey, others. (E) Distributions of gene essentiality scores (BF values) of γ-H2AX suppressors (brown) and whole genome reference (blue) in RKO TP53−/− cells. Kernel density estimation is used for the probability density function. Dashed lines indicate the median for each population. (F) Distributions of gene essentiality scores of hits from 27 dropout genotoxic screens (brown) and whole genome reference (blue) in RPE-hTERT TP53−/− cells.
Figure 2.
Figure 2.. Characterization of genes that prevent spontaneous DNA damage.
(A) Radar plot showing the ranking of CIAO1 in the five γ-H2AX screens. Custom scaling was used for five rings: 1, 10, 100, 1000, 18052, and linear scaling was used within each section. The grey shaded area indicates the top 100 ranking in each screen. (B) Radar plot showing the ranking of CFAP298 in five screens. (C) Flow cytometry analysis of RKO TP53−/− cells infected with lentiviruses expressing the indicated sgRNA. Left, representative plots. Red numbers indicate the percentage of γ-H2AX positive cells. Right, quantification of the experiment shown on the left. Bars represent the mean ± s.d. (n=3). Comparisons are made to the sgAAVS1 control, using an unpaired t-test. (D) Immunofluorescence analysis of cells described in (C) with γ-H2AX and 53BP1 antibodies. The images presented are representative of three immunostainings. Dashed lines indicate the nuclear area determined by DAPI staining. (E) Quantification of mean γ-H2AX intensity (left), mean γ-H2AX focus number (middle) and mean 53BP1 focus number (right) of three independent experiments as shown in (D). Each experiment includes a minimum of 500 cells for analysis. Bars represent the mean ± s.d. Comparisons were made to the sgAAVS1 condition using an unpaired t-test. A.U., arbitrary units.
Figure 3.
Figure 3.. Validation of genes that suppress replication-associated DNA damage.
(A)-(G) Validation of the screens. Left, the radar plot showing the ranking of each gene in five screens. Middle, representative flow cytometry plots of RKO TP53−/− cells expressing the indicated sgRNA. Cells were treated with the indicated replication inhibitor for 24 h or left untreated (UT). 300 nM Aph, 200 nM Ara-C, and 200 μM HU were used in this experiment, and the same drug concentrations were used for subsequent experiments unless otherwise specified. Right, quantification of γ-H2AX positive cells in all conditions. Bars represent the mean ± s.d. (n=3). Comparisons are made to the sgAAVS1 control within each treatment condition using an unpaired t-test. The Ara-C experiments in (B), (C) and (F) were performed simultaneously with the same sgAAVS1 control.
Figure 4.
Figure 4.. FANCJ protects cells from Aph-induced replication stress.
(A) Left, radar plot showing the ranking of FANCJ in the five γ-H2AX screens. Middle, flow cytometry analysis of RKO TP53−/− cells expressing the indicated sgRNA. Right, quantification of γ-H2AX positive cells in all four conditions. Bars represent the mean ± s.d. (n=3). Comparisons are made to the sgAAVS1 control within each treatment condition using an unpaired t-test. (B) Immunoblot analysis of FANCJ expression in RKO TP53−/− parental (WT) and FANCJ-KO cells. α-actinin was used as a loading control. (C) Aph dose-response assays using confluency as a readout 6 d post-treatment. Bars represent the mean ± s.d. (n=3). (D) Left, immunofluorescence analysis of γ-H2AX and chromatin-bound RPA2. Right, quantification of normalized mean intensities of γ-H2AX and RPA2. Bars represent the mean ± s.d. (n=3). Results of unpaired t-test between WT and FANCJ-KO cells are shown. A.U., arbitrary units. (E), (F) Recovery assay from Aph treatment. Cells were left untreated (−) or treated with 300 nM Aph for 24 h, then released into cell growth medium without the drug for the indicated time before harvesting. (E) Immunoblot analysis using the indicated antibodies. α-actinin, loading control. (F) Cell cycle distributions as determined by DAPI staining. UT, untreated. Brackets indicate S-phase cells. (G) Schematic of DNA fiber experiments. (H) Quantification of IdU/CIdU ratio. Each dot represents one fiber; at least 120 fibers are quantified from three independent experiments. Red bars represent the median. Results of the unpaired t-test are shown. (I) Model of FANCJ at the DNA replication fork.
Figure 5.
Figure 5.. DERA protects cells from Ara-C.
(A) Left, radar plot showing the ranking of DERA in the five γ-H2AX screens. Middle, flow cytometry analysis of RKO TP53−/− cells expressing the indicated sgRNA. Right, quantification of γ-H2AX positive cells in all four conditions. Bars represent the mean ± s.d. (n=3). Comparisons are made to the sgAAVS1 control within each treatment condition using an unpaired t-test. (B) Proliferation curves of RKO TP53−/− cells expressing sgAAVS1 control or sgDERA in the presence of 80 nM Ara-C. Confluency is normalized to the untreated condition for each genotype. Data is presented as mean ± s.d. (n=3). (C) Flow cytometry analysis of sgDERA-expressing cells complemented with sgRNA-resistant wildtype (WT) or catalytic dead (K254A) mutant of DERA. Cells were treated with 200 nM Ara-C for 24 h. Left, representative flow cytometry plots. Right, quantification of γ-H2AX positive cells. Bars represent the mean ± s.d. (n=3). Comparisons are made to the sgAAVS1 control using an unpaired t-test. (D) Immunoblot analysis of DERA expression in cells described in (C). α-actinin, loading control. (E) Chemical structures of cytarabine (Ara-C), gemcitabine, and fludarabine. (F) Flow cytometry analysis of sgAAVS1 or sgDERA-expressing cells treated with 20 nM gemcitabine or 5 μM fludarabine for 24 h. Bars represent the mean ± s.d. (n=2).
Figure 6.
Figure 6.. GNB1L protects cells under replication stress and promotes PIKK protein stability.
(A) Radar plot showing the ranking of GNB1L in five screens. (B) Representative flow cytometry analysis of RKO TP53−/− cells expressing the indicated sgRNA. Cells were treated with the indicated replication inhibitor for 24 h or left untreated (UT), then fixed and stained with a γ-H2AX antibody and DAPI. (C) Quantification of the experiment shown in (B). Bars represent the mean ± s.d. (n=3). Comparisons are made to the sgAAVS1 control within each treatment condition using an unpaired t-test. (D) QIBC analysis of γ-H2AX and chromatin-bound RPA2 signal intensities in RKO TP53−/− cells. Cells were treated with 200 μM HU or 250 nM CD437 for 24 h, then extracted, fixed and stained with antibodies to γ-H2AX and RPA2. Red numbers indicate the percentage of cells with high γ-H2AX and high RPA2 signal for each condition. A.U., arbitrary units. (E) Immunoblot analysis of PIKKs in lysates from RKO TP53−/− and RPE-hTERT TP53−/− cells expressing sgAAVS1 control or sgGNB1L. α-actinin, loading control. Asterisk denotes non-specific bands. (F) Immunoblot analysis of PIKKs in lysates from RKO TP53−/− cells expressing the indicated sgRNA. (G) Quantitative RT-PCR experiments to detect the mRNA levels of ATM, ATR, and DNA-PKcs using TaqMan assays. Bars represent the mean ± s.d. (n=3). Comparisons are made to the sgAAVS1 control using an unpaired t-test.
Figure 7.
Figure 7.. GNB1L-TELO2 interaction promotes PIKK levels.
(A) Left, Schematic of TELO2 truncations and mutations. Right, Flag immunoprecipitation in lysates of 293T cells expressing full length (FL) or mutant 3xFlag-TELO2 and probed for GNB1L. (B) Left, AlphaFold2-predicted structure of full-length GNB1L binding to a TELO2 fragment (residues 460–640). Purple, surface structure of GNB1L. Beige, ribbon structure of the TELO2 fragment. Right, magnified view of binding surface. Residues 498–501 of TELO2 are labeled and highlighted in green. (C), (D) RKO TP53−/− cells were infected with lentiviruses expressing sgTELO2 and sgRNA-resistant TELO2 variant constructs as indicated. WT, wild type. (C) Immunoblot analysis of cell lysates with the indicated antibodies. α-actinin, loading control. (D) Cells were treated with 250 nM CD437 for 24 h, then fixed and stained with a γ-H2AX antibody and DAPI. Red numbers indicate the percentage of γ-H2AX positive cells. The results are representative of two independent experiments. A.U., arbitrary units.

References

    1. Liu Q, Guntuku S, Cui XS, Matsuoka S, Cortez D, Tamai K, Luo G, Carattini-Rivera S, DeMayo F, Bradley A, et al. (2000). Chk1 is an essential kinase that is regulated by Atr and required for the G(2)/M DNA damage checkpoint. Genes Dev 14, 1448–1459. - PMC - PubMed
    1. Matsuoka S, Ballif BA, Smogorzewska A, McDonald ER 3rd, Hurov KE, Luo J, Bakalarski CE, Zhao Z, Solimini N, Lerenthal Y, et al. (2007). ATM and ATR substrate analysis reveals extensive protein networks responsive to DNA damage. Science 316, 1160–1166. - PubMed
    1. Couch FB, Bansbach CE, Driscoll R, Luzwick JW, Glick GG, Betous R, Carroll CM, Jung SY, Qin J, Cimprich KA, and Cortez D (2013). ATR phosphorylates SMARCAL1 to prevent replication fork collapse. Genes Dev 27, 1610–1623. 10.1101/gad.214080.113. - DOI - PMC - PubMed
    1. Ward IM, and Chen J (2001). Histone H2AX is phosphorylated in an ATR-dependent manner in response to replicational stress. J Biol Chem 276, 47759–47762. - PubMed
    1. Kumagai A, Lee J, Yoo HY, and Dunphy WG (2006). TopBP1 activates the ATR-ATRIP complex. Cell 124, 943–955. 10.1016/j.cell.2005.12.041. - DOI - PubMed

Publication types

LinkOut - more resources