. 2023 Aug 14;41(8):1427-1449.e12.
doi: 10.1016/j.ccell.2023.06.010. Epub 2023 Jul 20.

Loss of SYNCRIP unleashes APOBEC-driven mutagenesis, tumor heterogeneity, and AR-targeted therapy resistance in prostate cancer

Affiliations

Loss of SYNCRIP unleashes APOBEC-driven mutagenesis, tumor heterogeneity, and AR-targeted therapy resistance in prostate cancer

Xiaoling Li et al. Cancer Cell. .

Abstract

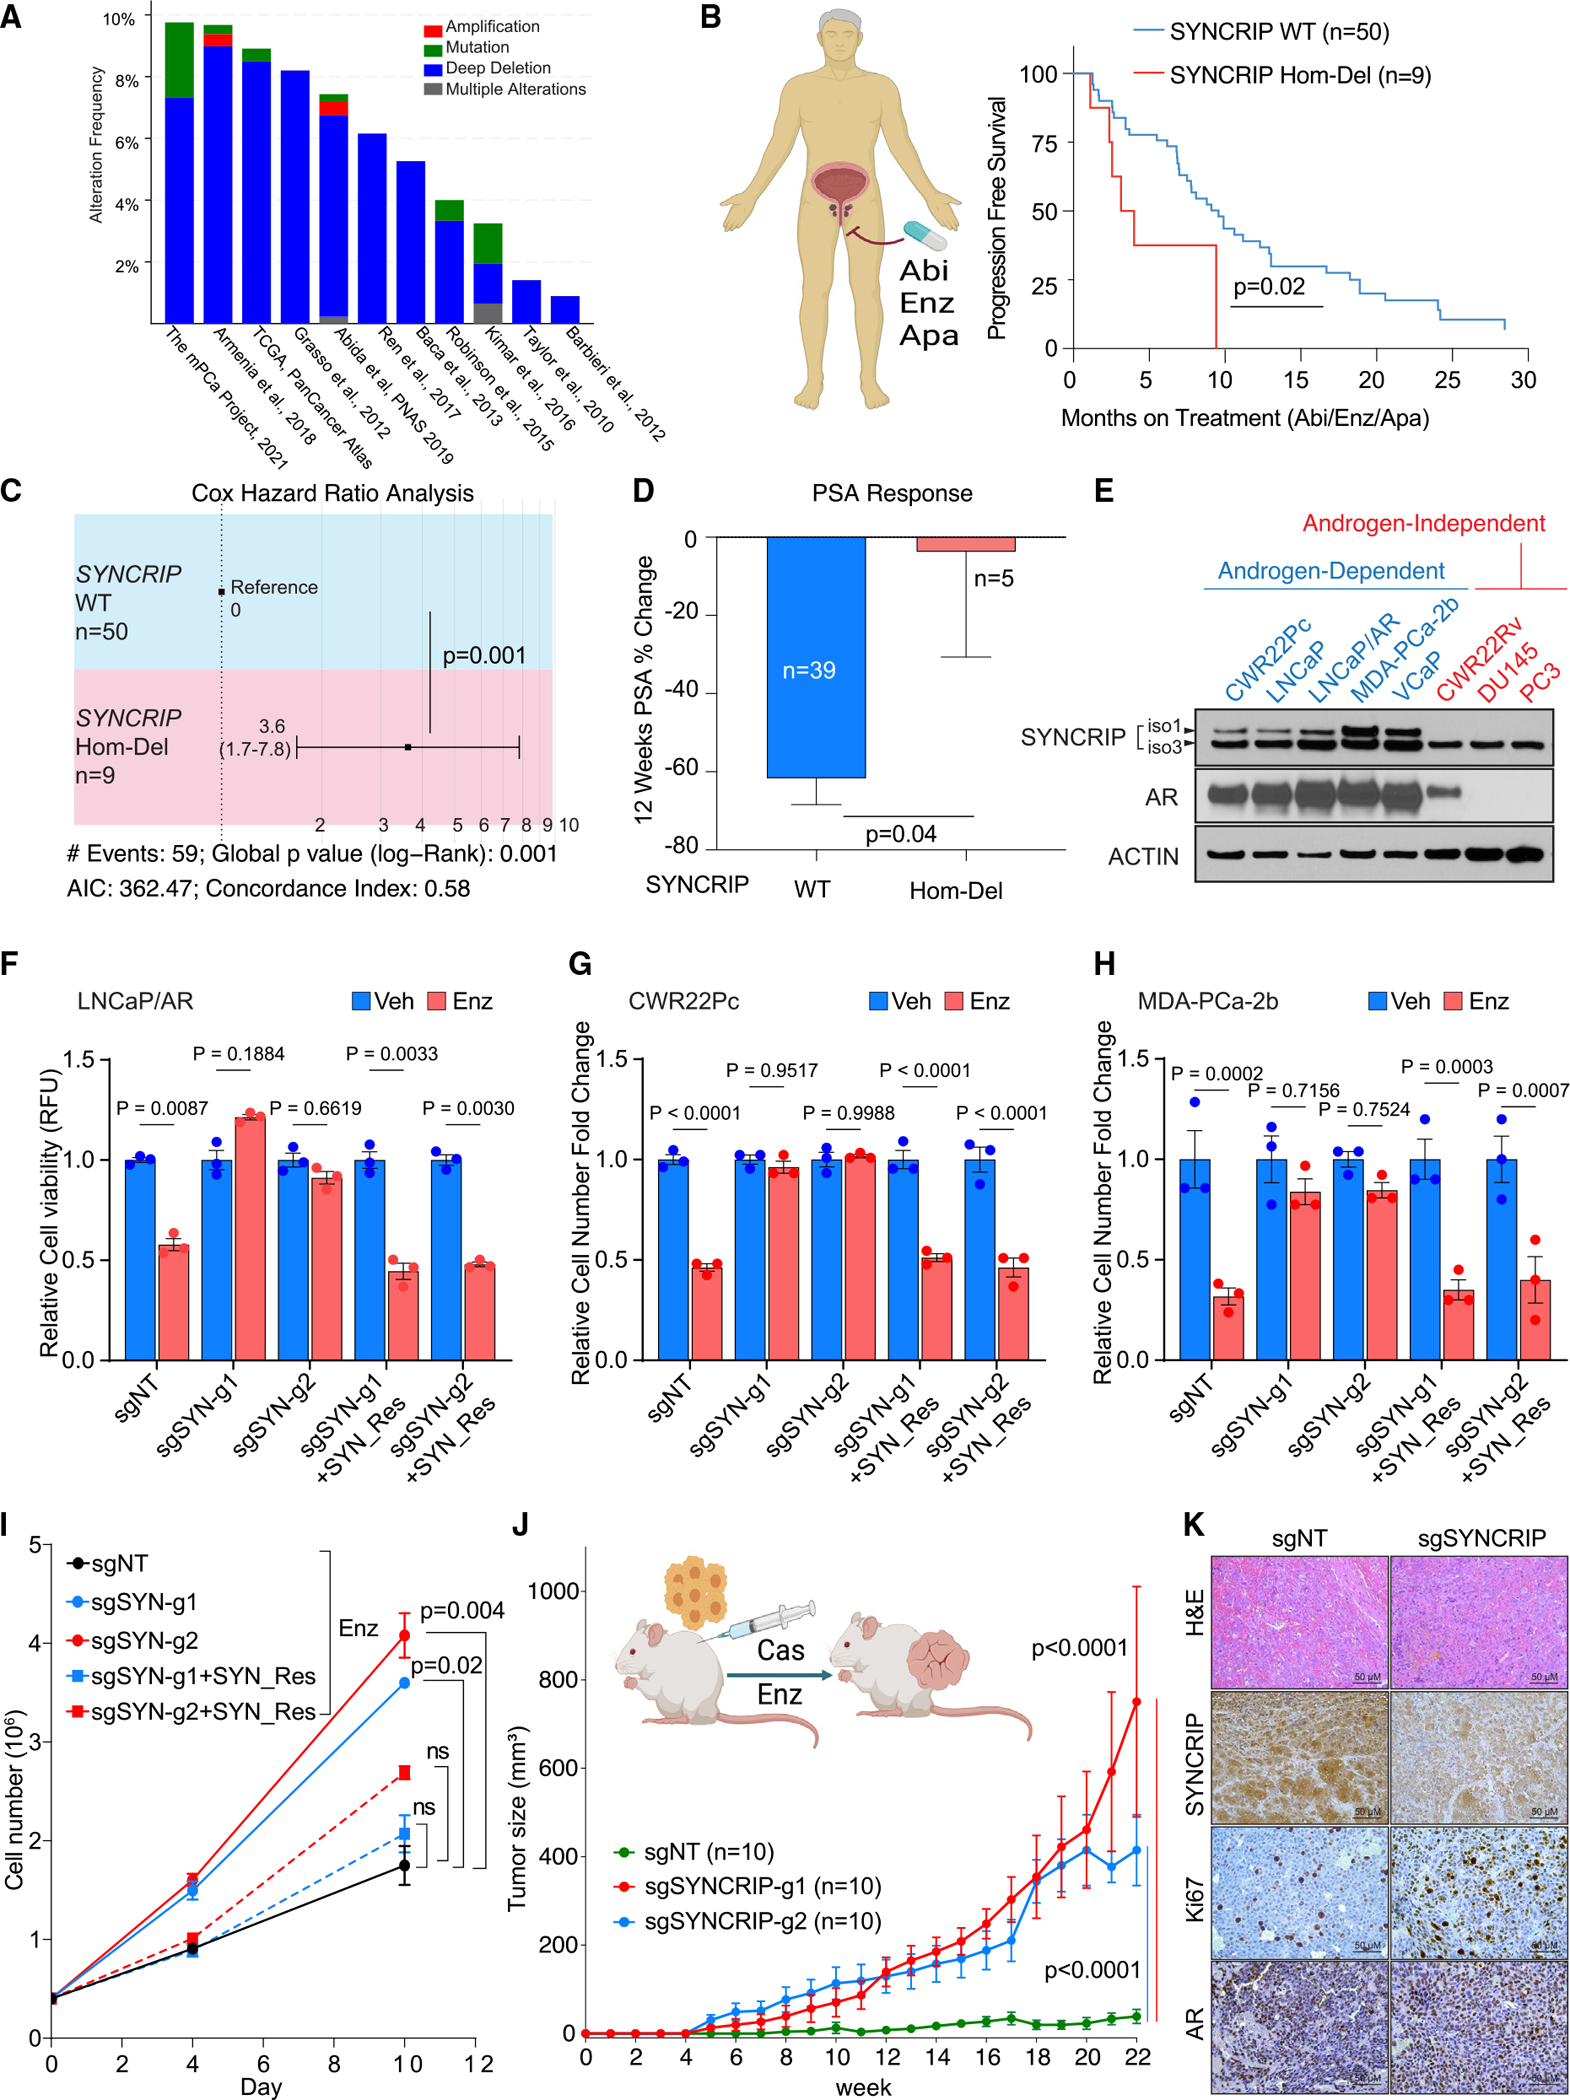
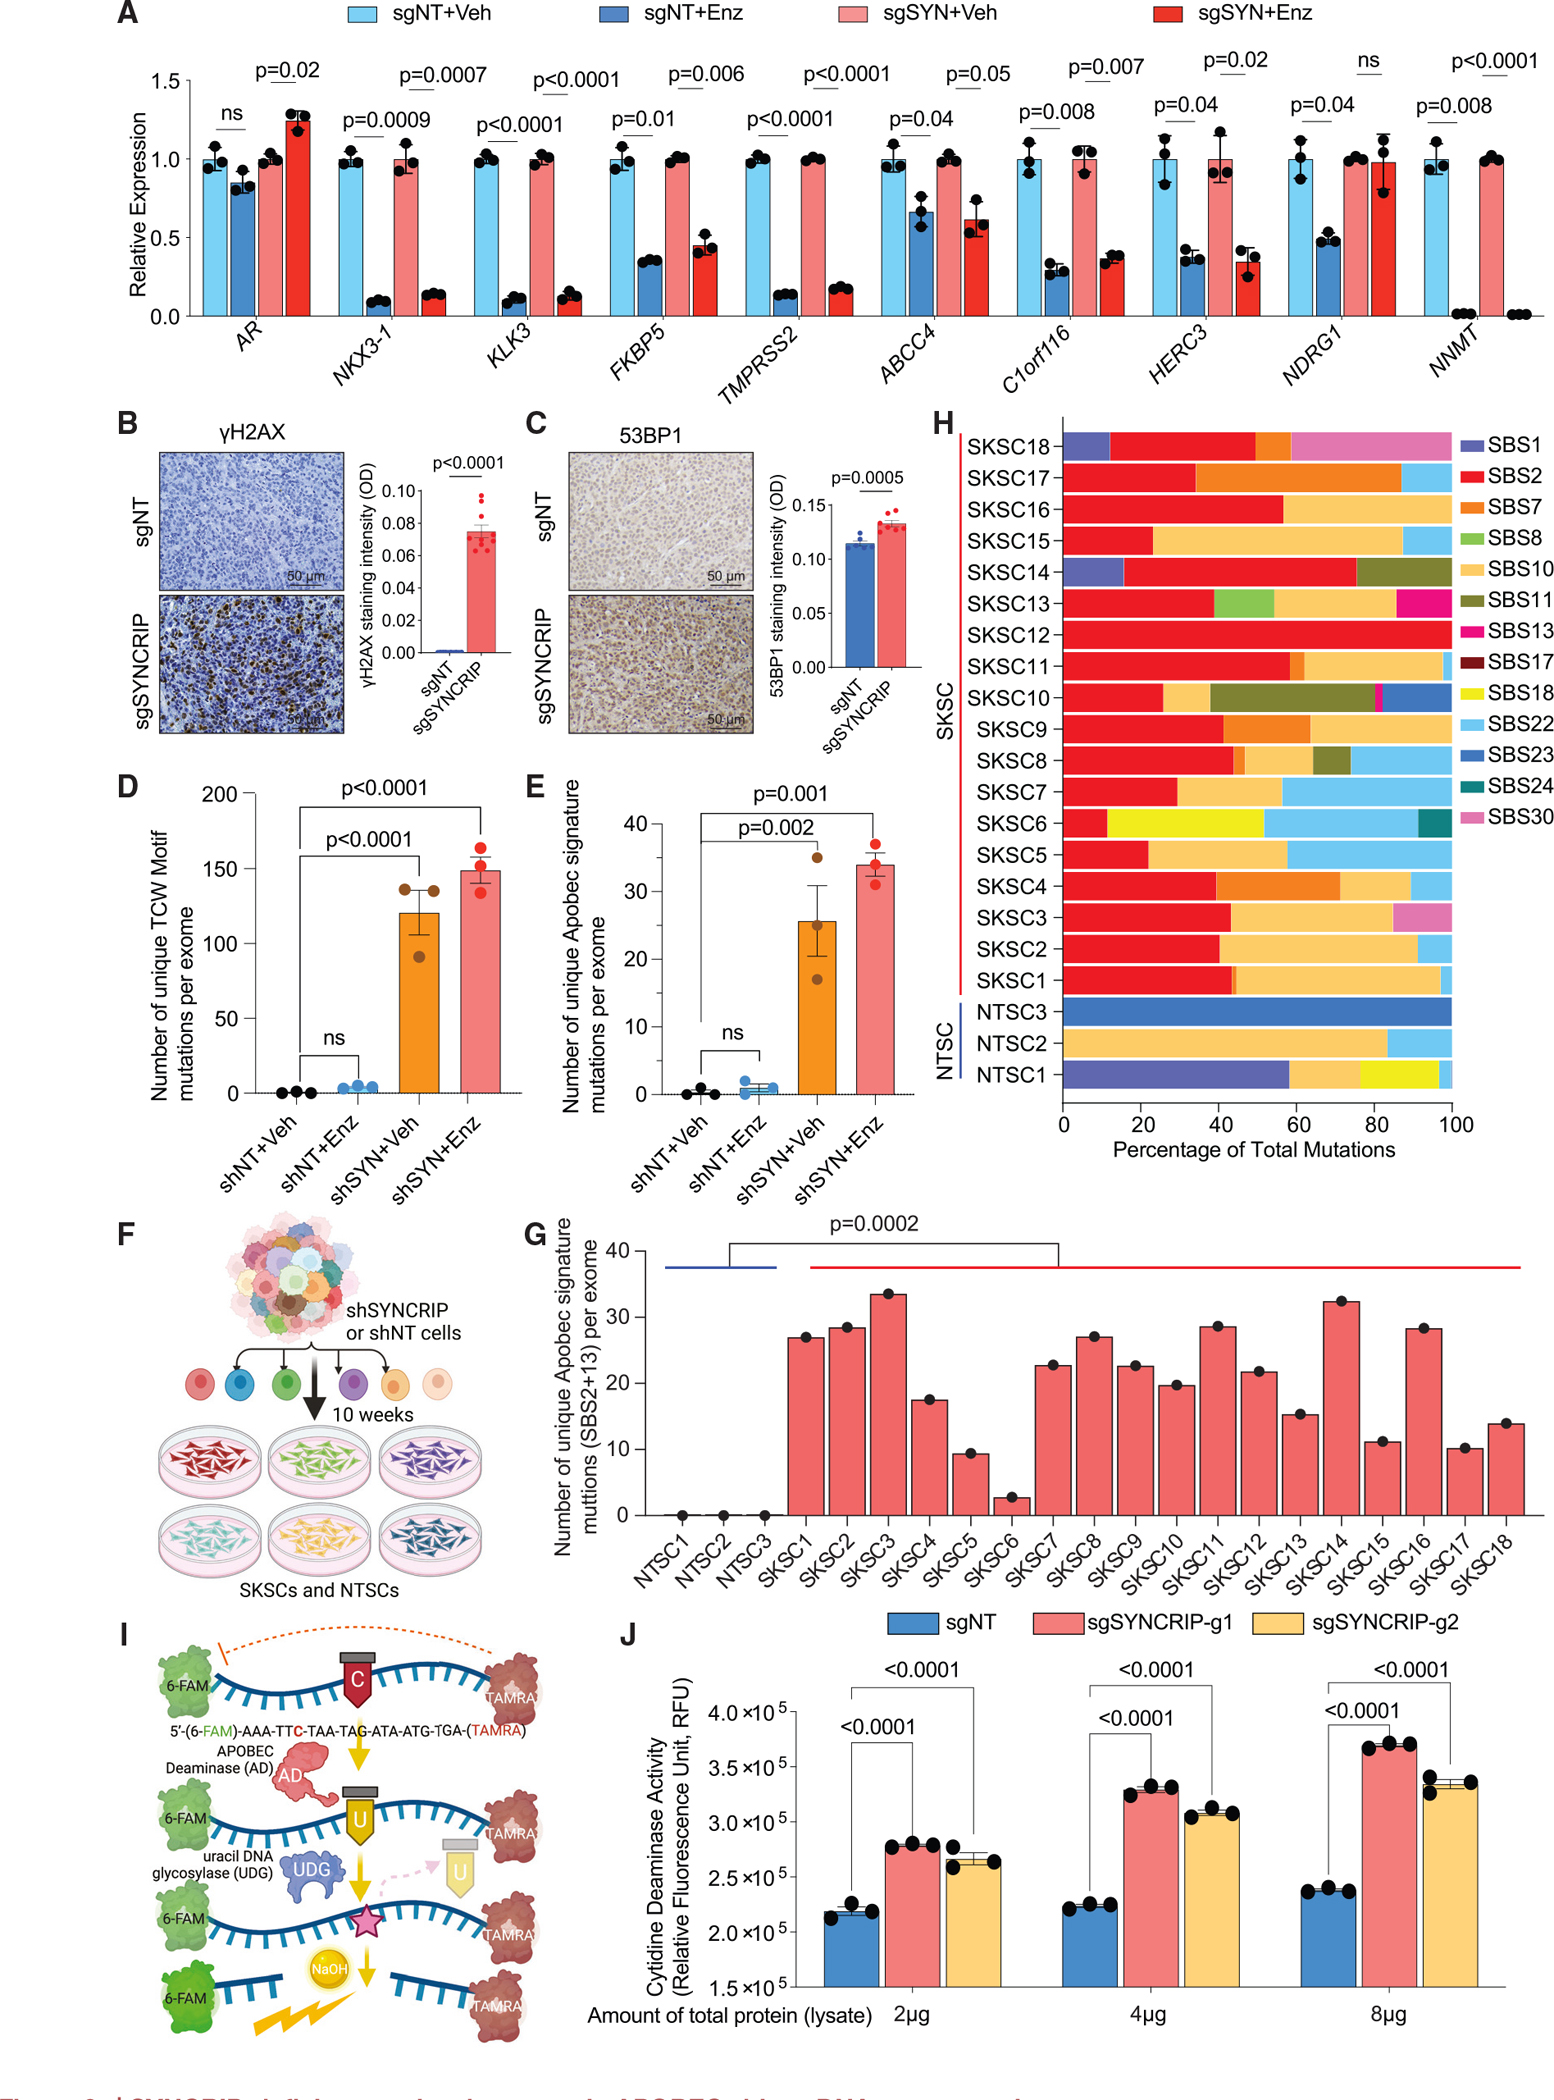
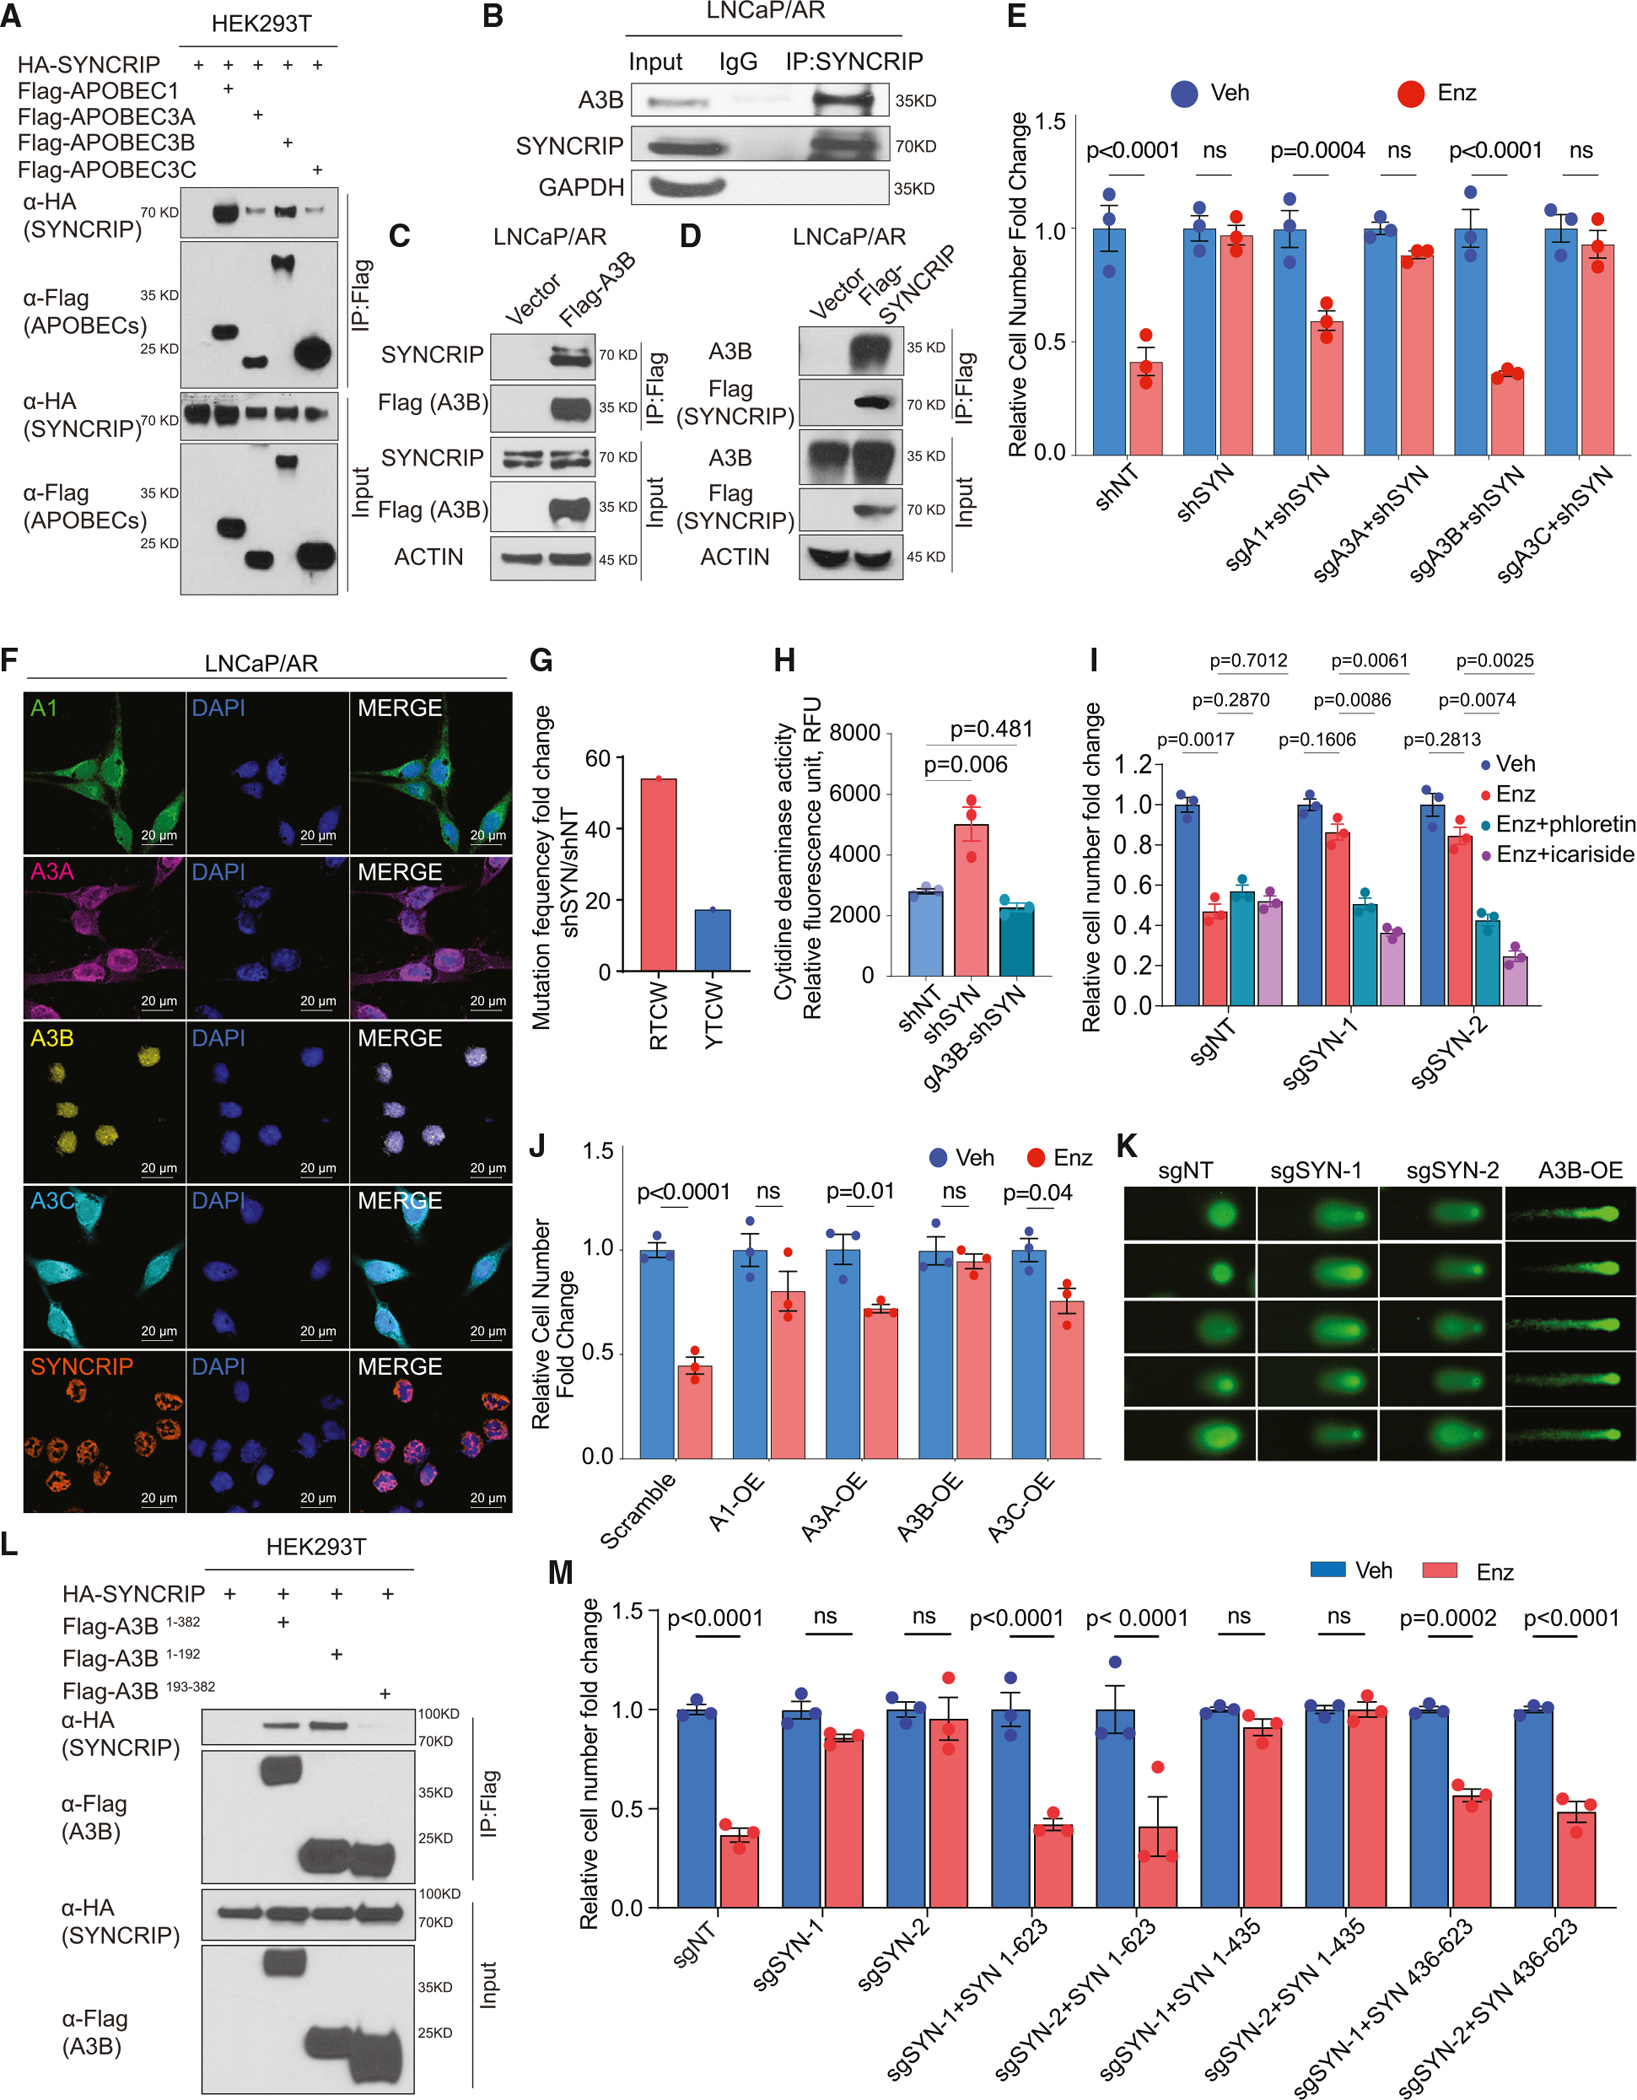
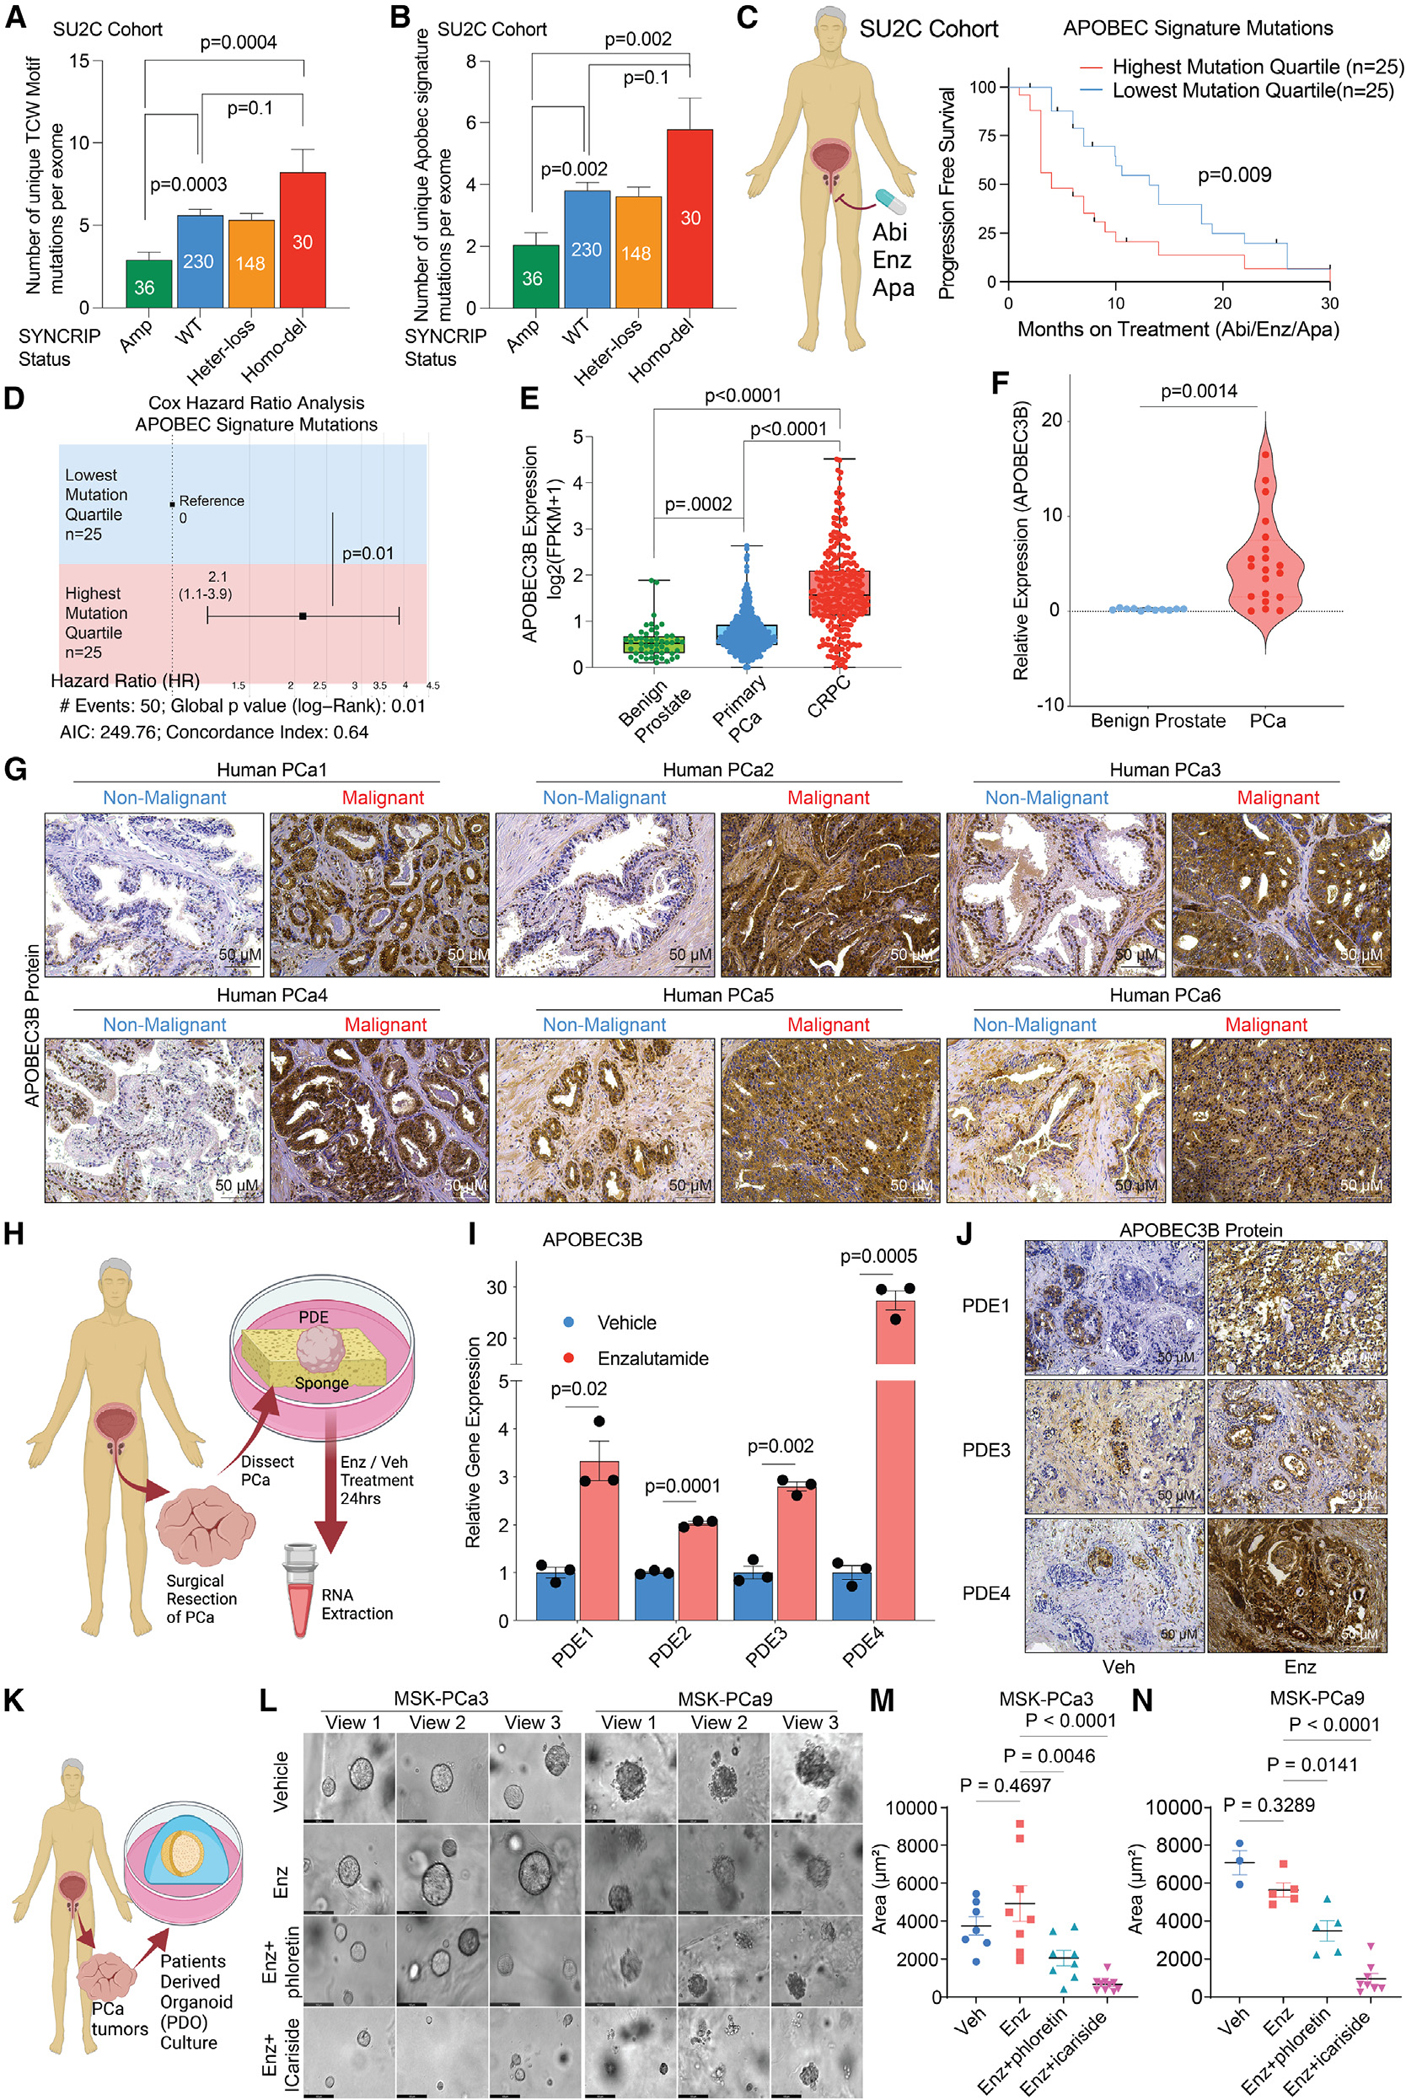
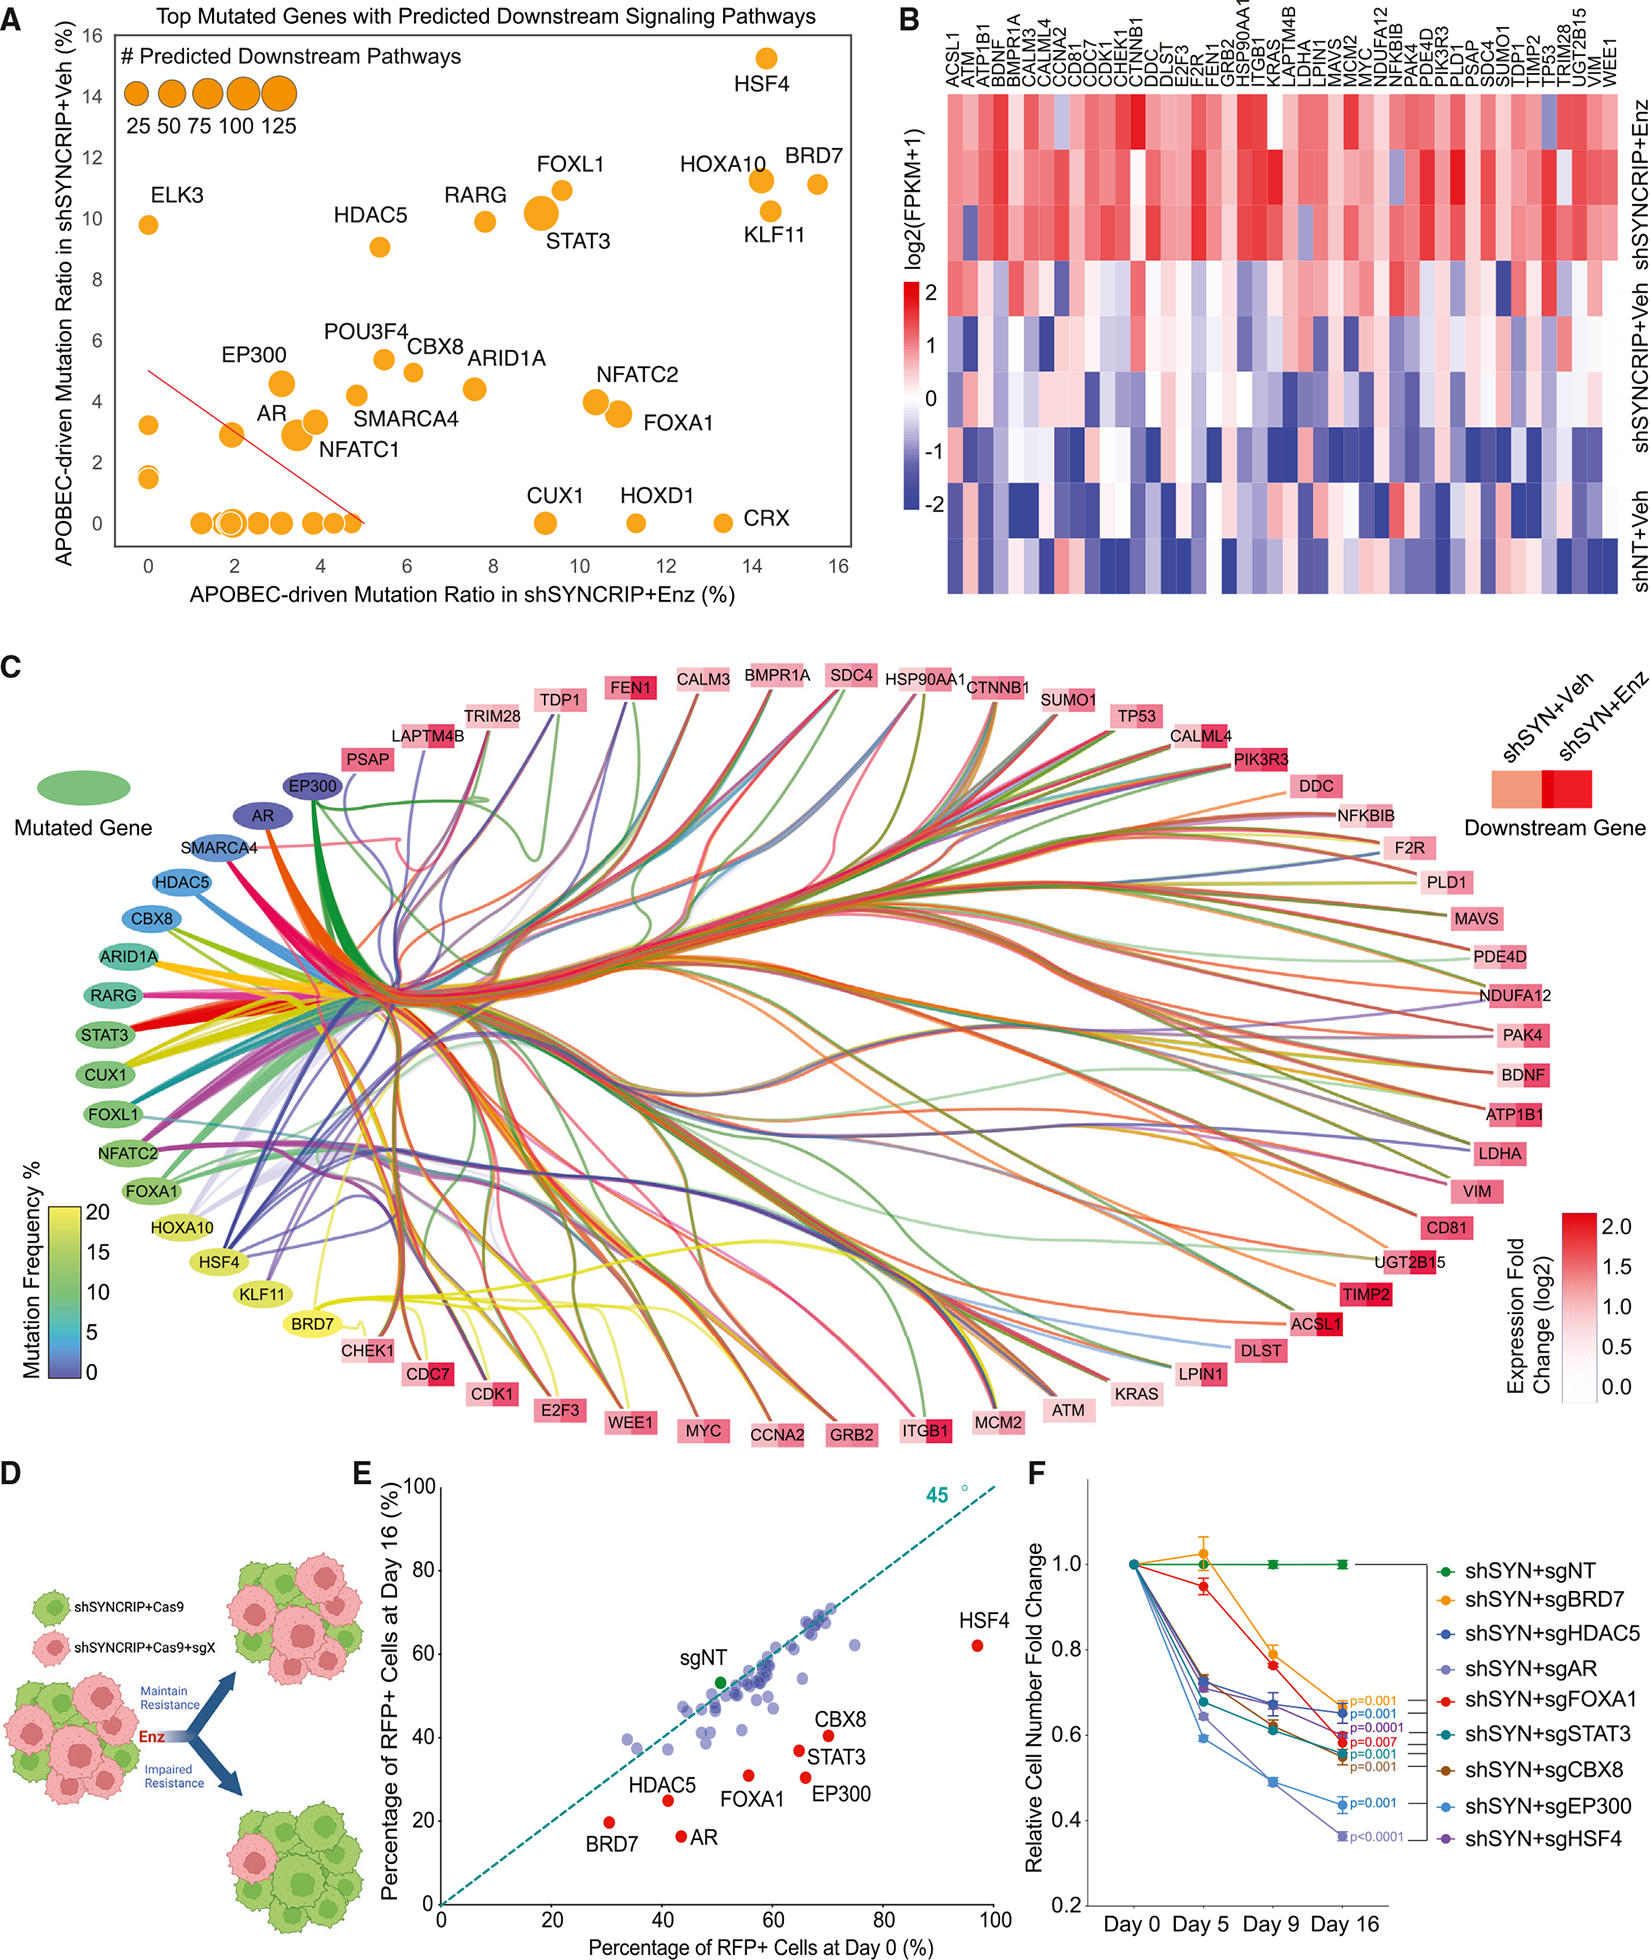
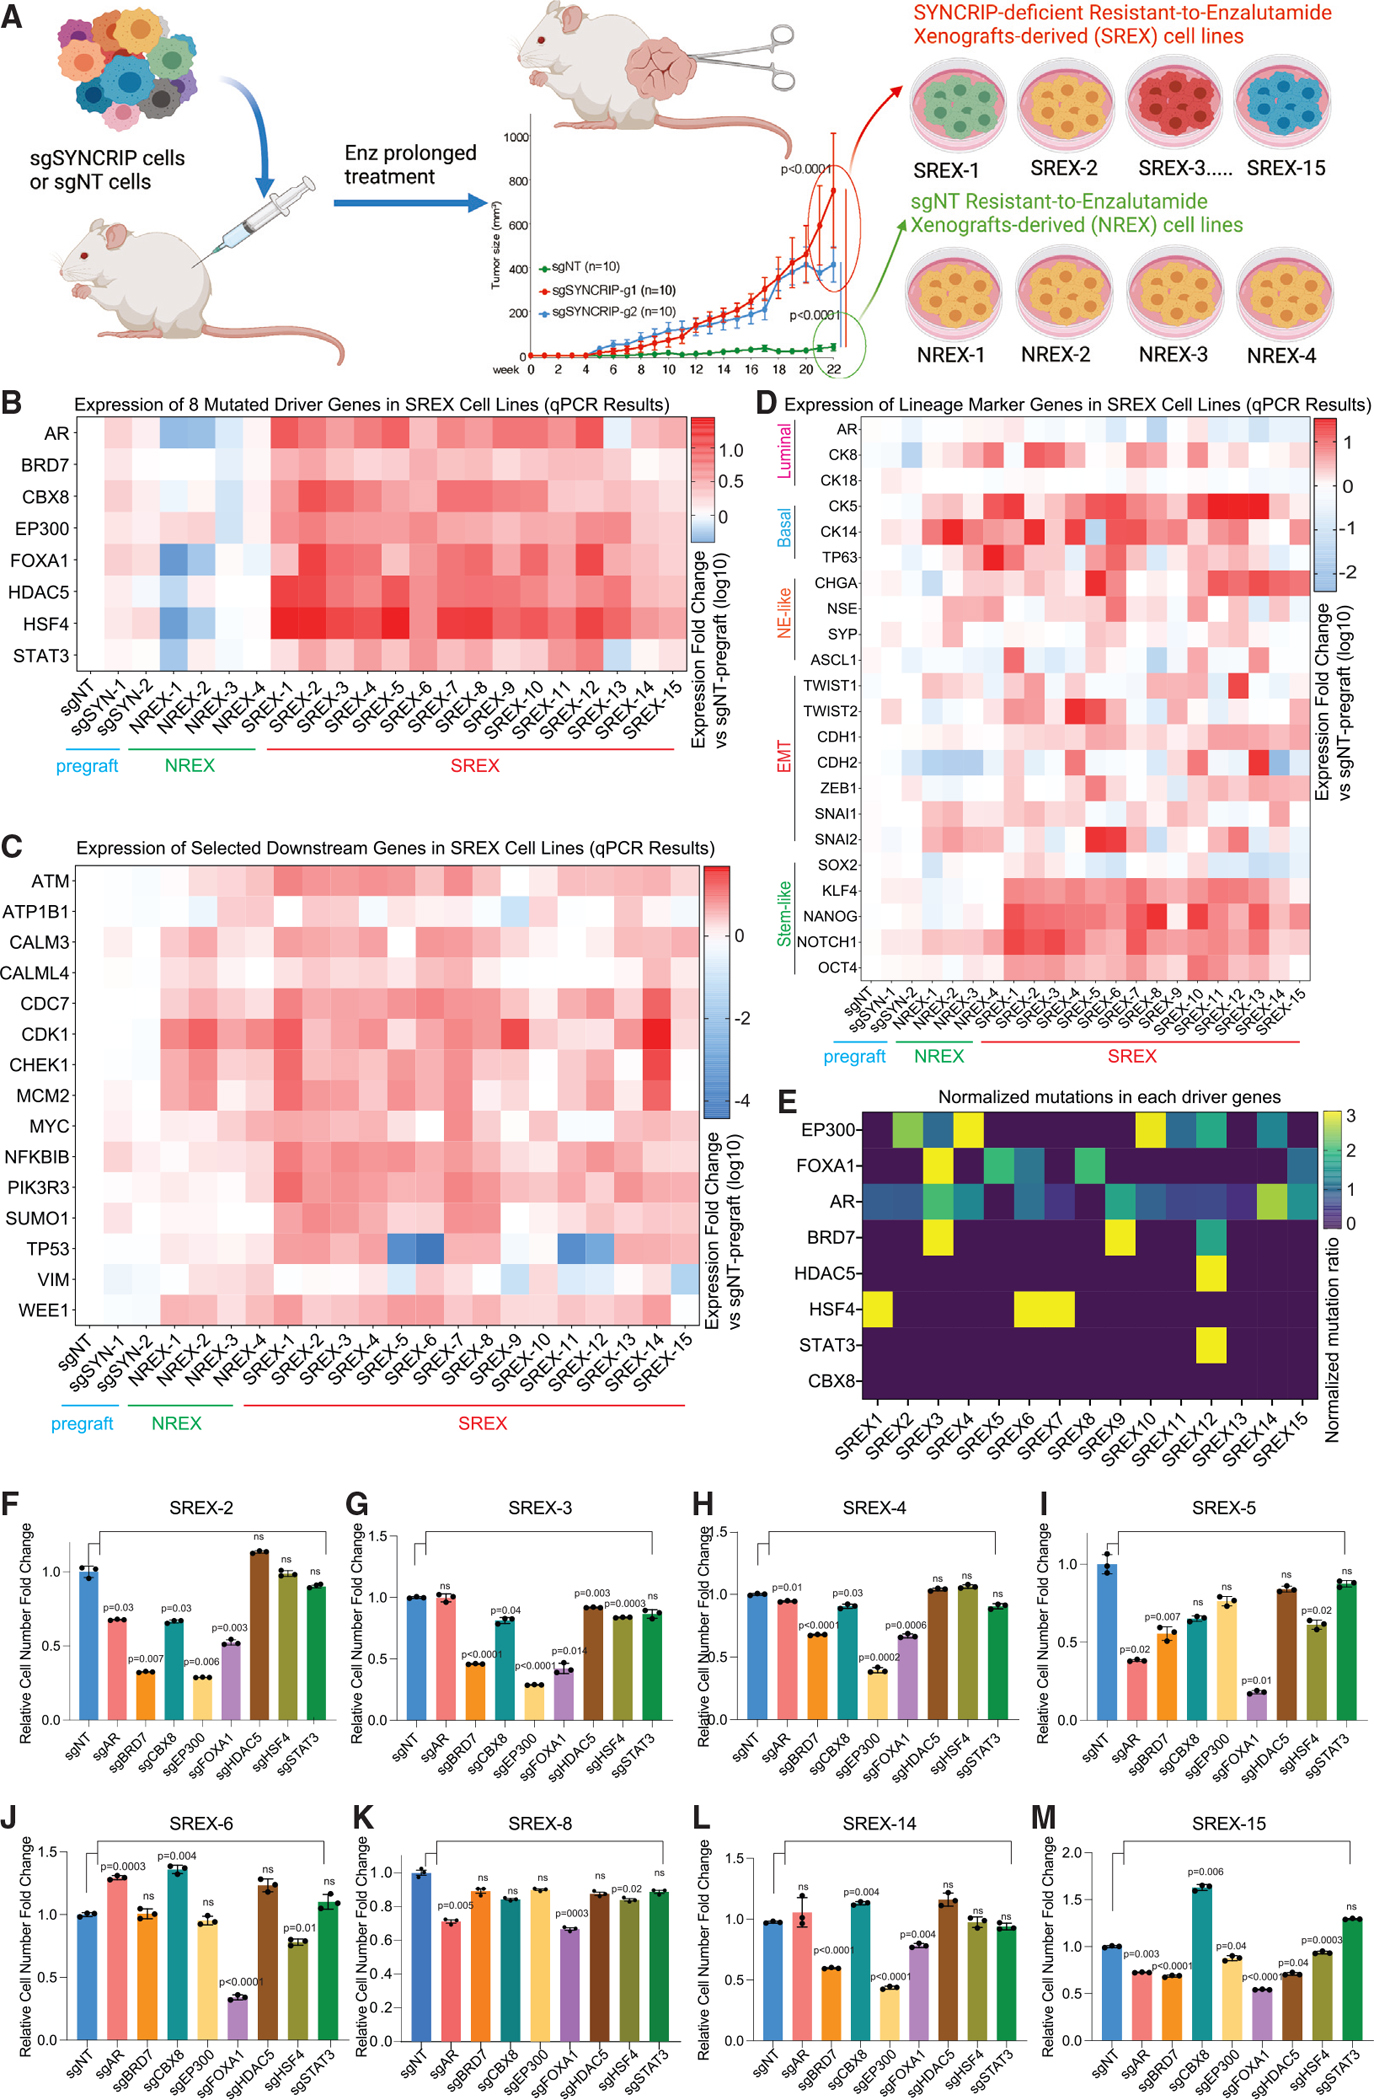
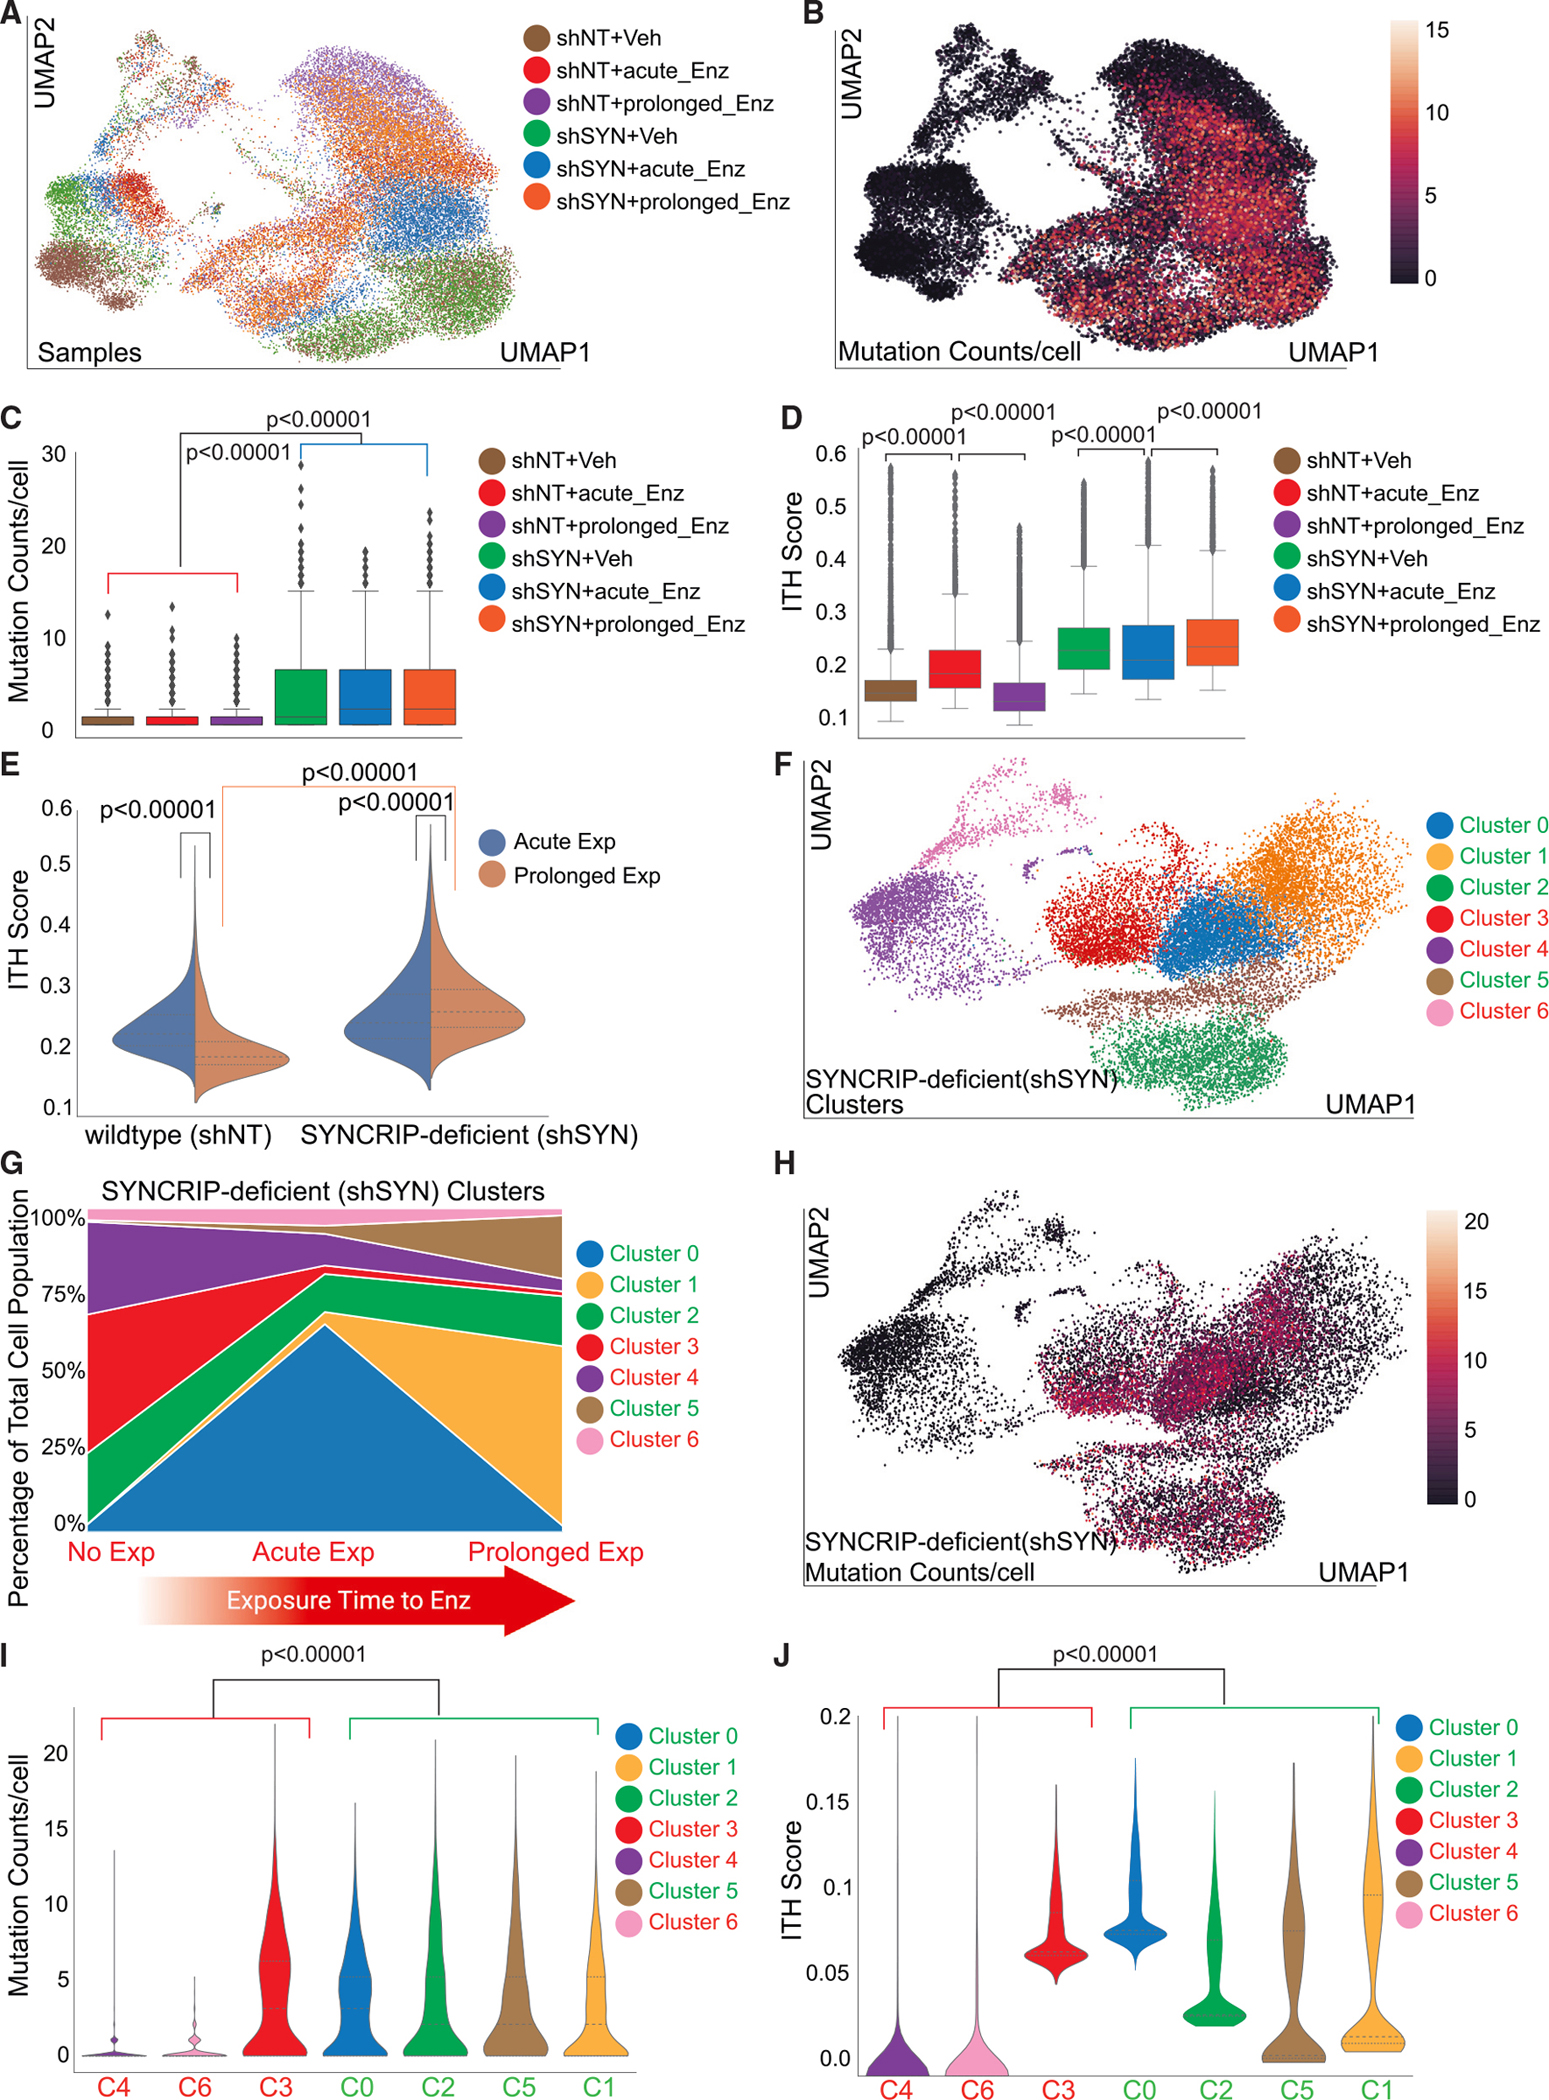
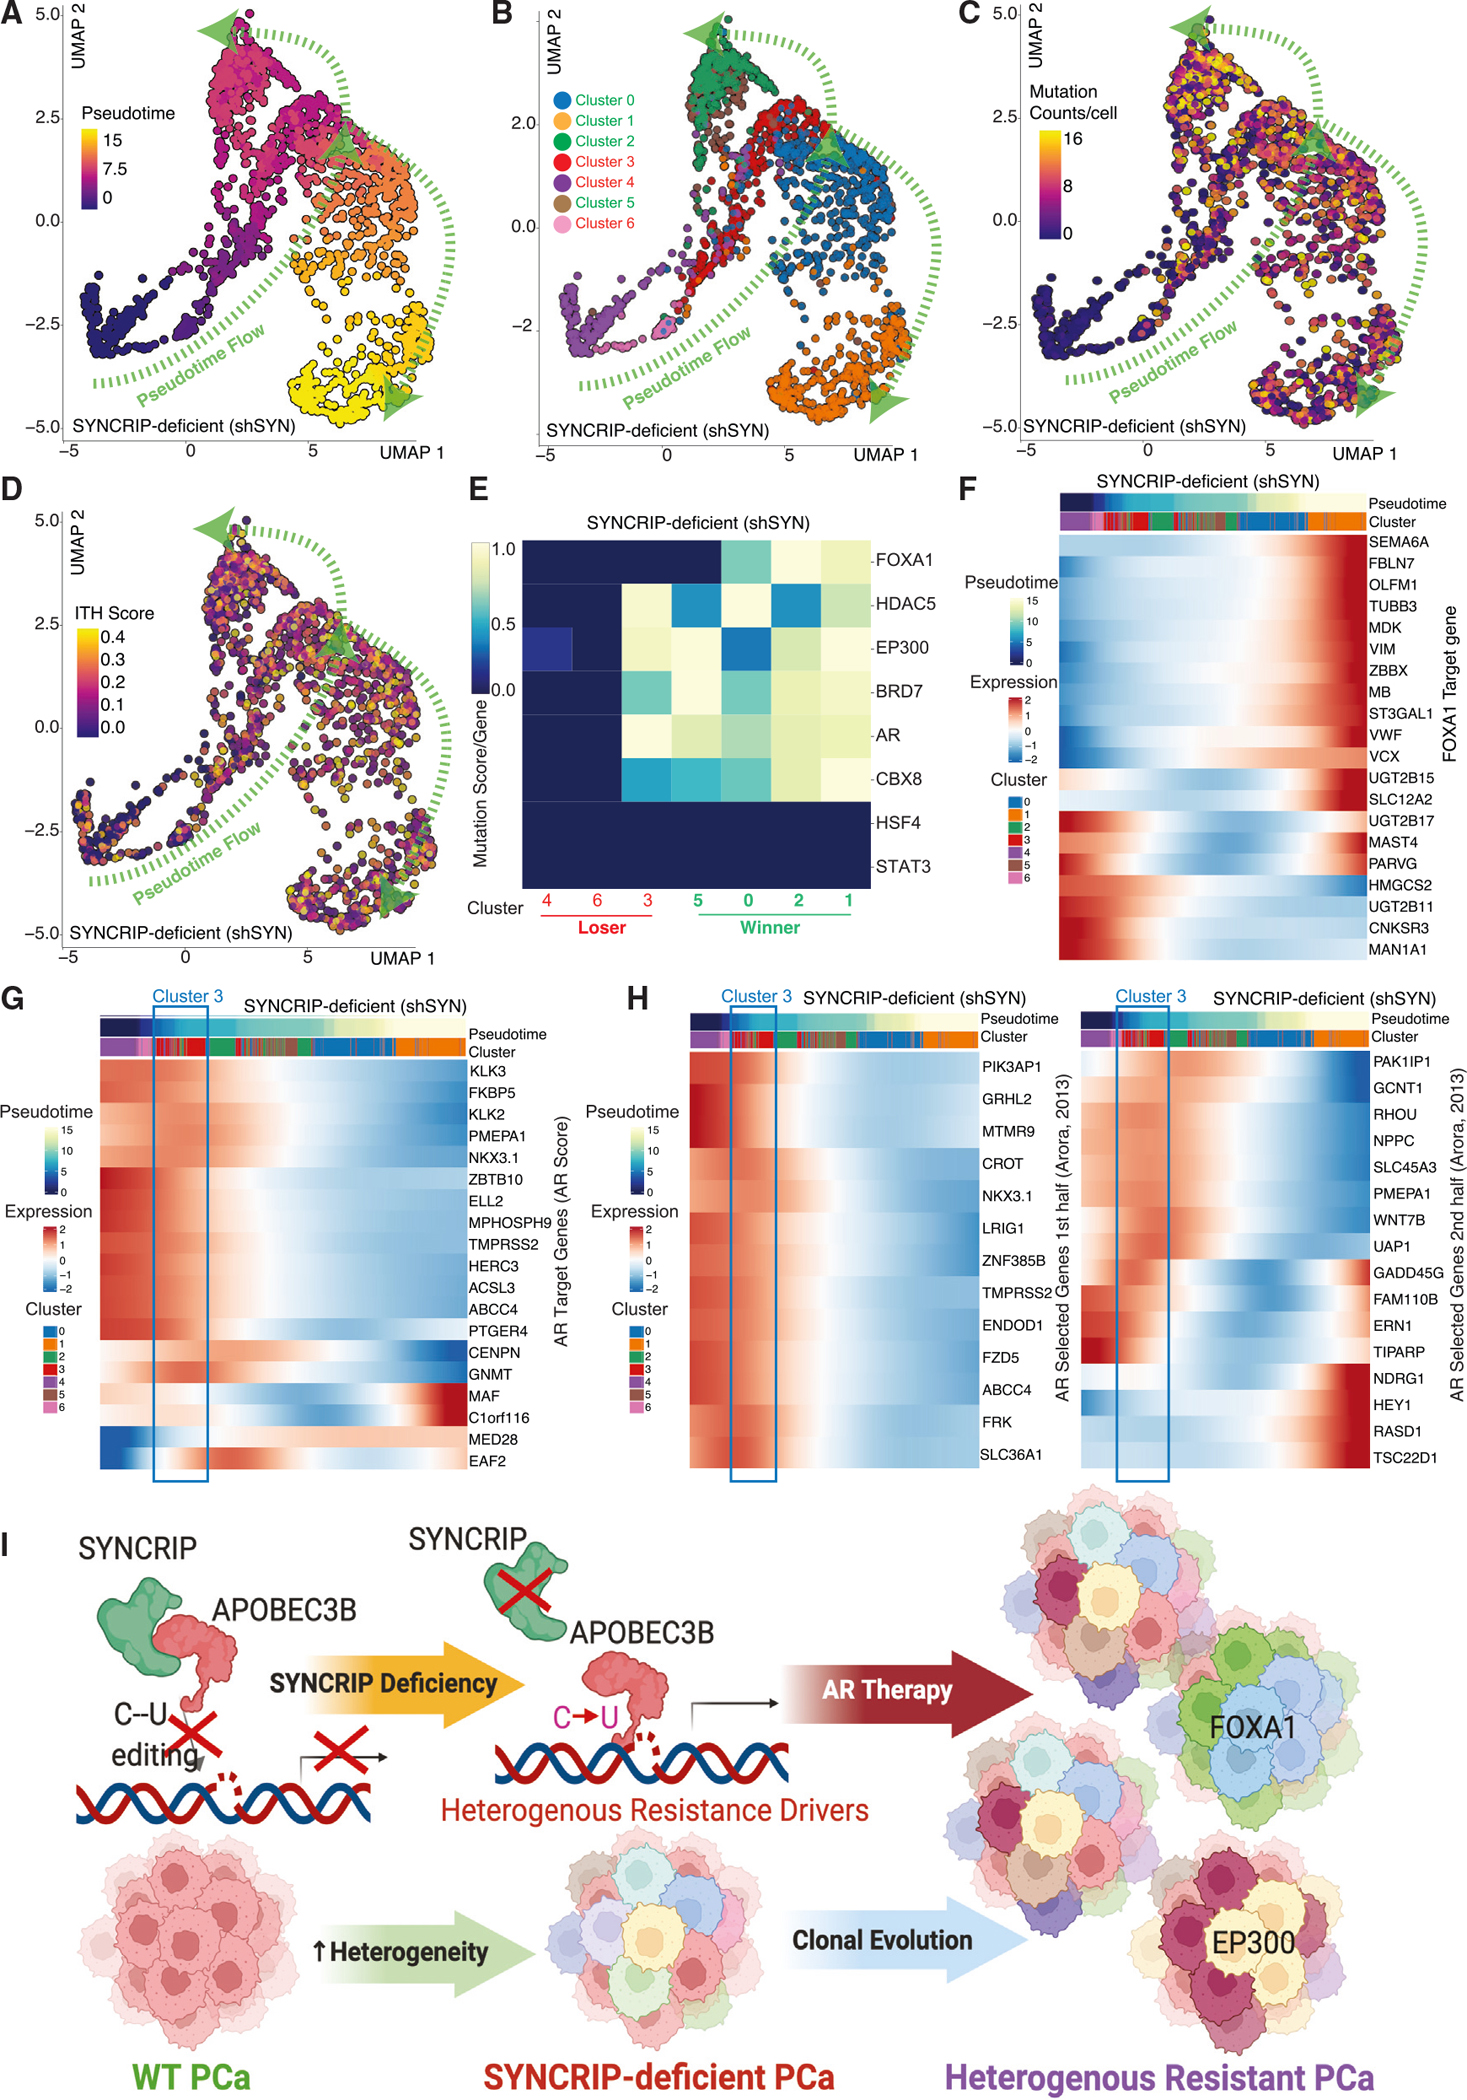
Tumor mutational burden and heterogeneity has been suggested to fuel resistance to many targeted therapies. The cytosine deaminase APOBEC proteins have been implicated in the mutational signatures of more than 70% of human cancers. However, the mechanism underlying how cancer cells hijack the APOBEC mediated mutagenesis machinery to promote tumor heterogeneity, and thereby foster therapy resistance remains unclear. We identify SYNCRIP as an endogenous molecular brake which suppresses APOBEC-driven mutagenesis in prostate cancer (PCa). Overactivated APOBEC3B, in SYNCRIP-deficient PCa cells, is a key mutator, representing the molecular source of driver mutations in some frequently mutated genes in PCa, including FOXA1, EP300. Functional screening identifies eight crucial drivers for androgen receptor (AR)-targeted therapy resistance in PCa that are mutated by APOBEC3B: BRD7, CBX8, EP300, FOXA1, HDAC5, HSF4, STAT3, and AR. These results uncover a cell-intrinsic mechanism that unleashes APOBEC-driven mutagenesis, which plays a significant role in conferring AR-targeted therapy resistance in PCa.

Keywords: APOBEC; AR-targeted therapy resistance; EP300; FOXA1; SYNCRIP; antiandorgen; mutagenesis; prostate cancer; tumor heterogeneity.


Conflict of interest statement

Declaration of interests P.M. served as a scientific consultant to Accutar Biotechnology, Inc. G.V.R. holds issued and pending patents, which have been licensed to EtiraRx. G.V.R. serves or has served in an advisory role to Bayer, Johnson and Johnson, Myovant, EtiraRx, Amgen, Pfizer, and Astellas. He has or has had grant support from Bayer, EtiraRx, and Johnson and Johnson. T.W. is a scientific co-founder of NightStar Biotechnologies, Inc. H.L. is a shareholder and scientific advisor of Precision Scientific Ltd.

Figures

Figure 1.
Figure 1.. SYNCRIP-deficiency confers resistance to AR-targeted therapies
(A) Stacked bar plot represents the percentage of PCa samples with genomic alterations of SYNCRIP, created using cbioportal.org. (B) Kaplan-Meier curve represents the treatment duration on AR-targeted therapies of patients with mCRPC patients (WT n = 50, Hom-del n = 9). Abi: abiraterone, Enz: enzalutamide, Apa: apalutamide. p value was calculated with Mantel-Cox test. (C) Cox proportional hazard ratio analysis of this cohort, p value was calculated with Log rank test. (D) Bar plot represents the percentage of PSA change in 12 weeks in patients receiving AR-targeted therapies, p value was calculated with two-tailed Mann-Whitney test. (E) Western blot of SYNCRIP and AR in a series of human PCa cell lines. (F–H) Bar plots represent the relative cell viability of LNCaP/AR (F), relative cell number fold change of CWR22Pc (G), and MDA-PCa-2b (H) cells transduced with annotated guide RNAs, and/or rescue plasmids (SYN_Res), measured as values of relative luminescence unit (RLU) or cell number fold change and normalized to vehicle conditions. Enz denotes 10 μM enzalutamide for LNCaP/AR, 1 μM for CWR22Pc, 5 μM for MDA-PCa-2b for 7 days and Veh denotes DMSO. (I) Cell number of LNCaP/AR cells transduced with annotated guide RNAs, and/or rescue plasmids (SYN_Res), measured by cell proliferation assay. Enz denotes 10 μM enzalutamide treatment. (J) Tumor growth curve of xenografted LNCaP/AR cells transduced with annotated guide RNAs in castrated mice. Enz denotes enzalutamide at 10 mg/kg. A number of tumors were annotated. (K) H&E and IHC staining on sgNT and sgSYNCRIP xenografts tumor slides. For all panels unless otherwise noted, 3 biological replicates in each group and mean ± s.e.m. is represented. p values were calculated using two-way ANOVA with Bonferroni multiple-comparison test. All schematic figures were created with BioRender.com. See also Figures S1, S2, and Table S1.
Figure 2. |
Figure 2. |. SYNCRIP-deficiency unleashes ectopic APOBEC-driven DNA mutagenesis
(A) Relative expression of AR-targeted genes in LNCaP/AR cells transduced with annotated guide RNAs and treated with vehicle (Veh, DMSO) or enzalutamide (Enz, 10 μM). (B and C) Representative image and quantification of IHC staining in sgNT and sgSYNCRIP xenograft tumors. (D–E) Bar plot represents the counts of C→T/G/A mutations in TCW motif (D) and APOBEC-signature mutations (E) in LNCaP/AR cells transduced with annotated shRNAs. p values were calculated using one-way ANOVA with Bonferroni multiple-comparison test. (F) Schematic figure illustrates SKSC or NTSC generation. (G) Bar plots represent the APOBEC signature mutations in single clones derived from SYNCRIP-deficient cells (SKSCs) and wild-type cells (NTSCs). (H) Bar plot represents the percentage of each SBS signatures identified in the SKSCs and NTSCs. (I) Schematic figure represents the FRET-based APOBEC deaminase activity assay. (J) Bar plot represents the relative fluorescence unit (RFU) of APOBEC deaminase activity in serially diluted cell extracts from LNCaP/AR cells transduced with annotated guide RNAs. For all panels unless otherwise noted, 3 biological replicates in each group and mean ± s.e.m. is represented. p values were calculated using two-way ANOVA with Bonferroni multiple-comparison test. Schematic figures were created with BioRender.com. See also Figure S3, and Table S2.
Figure 3.
Figure 3.. APOBEC3B-driven mutagenesis is required and sufficient to promote resistance
(A) Co-IP of SYNCRIP and APOBECs in HEK293T cells. (B) Co-IP of endogenous SYNCRIP and APOBEC3B in LNCaP/AR cells. (C) Co-IP of endogenous SYNCRIP and flag-tagged APOBEC3B in LNCaP/AR cells. (D) Co-IP of endogenous APOBEC3B and flag-tagged SYNCRIP in LNCaP/AR cells. (E) Bar plot represents the relative cell number fold change of LNCaP/AR cells transduced with annotated guide RNAs and shRNAs. (F) IF staining of annotated endogenous APOBECs and SYNCRIP in LNCaP/AR cells. (G) Bar plot represents the fold change of APOBEC-driven mutations observed in RTCW and YTCW motifs. (H) Bar plot represents the RFU of APOBEC deaminase activity in LNCaP/AR cells. p values were calculated using one-way ANOVA with Bonferroni multiple-comparison test. (I) Bar plot represents the relative fold change in cell numbers of sgNT or sgSYNCRIP LNCaP/AR cells, treated with Veh, Enz, or a combination of Enz and two A3B inhibitors (1 μM phloretin, 10 μM icariside I). (J) Bar plot represents the relative cell number fold change of LNCaP/AR cells transduced with constructs expressing annotated proteins. (K) Fluorescence pictures represent comet assay of LNCaP/AR cells transduced with sgNT, sgSYNCRIP, and A3B-OE constructs. (L) Co-IP of HA-tagged SYNCRIP and Flag-tagged APOBEC3B, APOBEC3B N-terminus and C-terminus regions in HEK293T cells. (M) Bar plot represents the relative cell number fold change of LNCaP/AR cells transduced with annotated guide RNAs, and/or rescue plasmids, measured by cell proliferation assay. For all panels unless otherwise noted, 3 biological replicates in each group and mean ± s.e.m. is represented. p values were calculated using two-way ANOVA with Bonferroni multiple-comparison test. Enz denotes 10 μM enzalutamide and Veh denotes DMSO. See also Figures S3 and S4.
Figure 4. |
Figure 4. |. APOBEC3B-driven mutagenesis was correlated with poor clinical outcome in patients with PCa
(A and B) Bar plot represents the C→T/G/A mutations in TCW motif (A), or APOBEC-signature mutations (B) in PCa of SU2C cohort. A number of patients were represented on the bars. p values were calculated using Kruskal-Wallis test with Benjamini correction. (C) Kaplan-Meier curve represents the treatment duration on AR-targeted therapies of patients with high or low APOBEC-signature mutations in their PCa. Abi: abiraterone, Enz: enzalutamide, Apa: apalutamide. p value was calculated with Log rank test. (D) Cox proportional hazard ratio analysis of the patients with high or low level of APOBEC-signature mutations in their PCa, p value was calculated with Log rank test. (E) Boxplots represent APOBEC3B expression in benign prostate tissue (n = 52), primary PCa (n = 498), and CRPC (n = 266). p values were calculated with Kruskal-Wallis test with Benjamini correction. (F) Violin plot represents APOBEC3B expression in benign prostate tissue (n = 11) or PCa (n = 20). p value was calculated using Mann-Whitney test. (G) IHC staining of APOBEC3B on PCa tumors and matched benign tissues (n = 6). (H) Schematic figure represents the generation of PDEs. (I) Relative expression of APOBEC3B in a series of PDEs treated with vehicle (DMSO) or enzalutamide (10 μM) for 24 h p values were calculated using multiple t-test with Bonferroni correction. (J) IHC staining of APOBEC3B on those PDEs. (K) Schematic figure represents the generation of PDOs. (L) Representative images depicting PDOs under the indicated treatments for 13 days. Enz denotes 5 μM enzalutamide, phloretin denotes 2 μM phloretin, and icarside I denotes 10 μM icariside I. (M and N) Statistical analysis of representative images of the PDOs. One dot represents one organoid. p values were calculated using one-way ANOVA and Bonferroni multiple comparisons test. For all panels, mean ± s.e.m. is represented. Schematic figures were created with BioRender.com. See also Figure S5.
Figure 5.
Figure 5.. Functional CRISPR screening identified eight frequently mutated resistance drivers in SYNCRIP-deficient tumors
(A) Most frequently mutated genes with downstream signaling predicted to be regulated in the SYNCRIP-deficient cells compared to wild-type cells. Mutation frequency of each gene (variant allele frequency) is represented, and size of circle represents the number of predicted downstream pathways of each mutated genes. (B) Heatmap represents the expression of 44 candidate downstream genes. (C) Gene regulatory network plot represents the 16 mutated resistant driver genes (oval circle) and 44 candidate downstream genes (square). Blue-yellow color intensity represents frequency of mutation. Red-white color intensity of the two squares represents the expression fold change of the 44 genes in SYNCRIP-deficient cells treated with vehicle (left square) or enzalutamide (right square). (D) Schematic representation of the functional CRISPR library screen, created with BioRender.com. (E) Scatterplot represents the results of the functional screen. Each dot represents guide RNAs targeting a candidate resistance driver gene. The green dot identifies sgNT control. The 8 genes that scored positive are highlighted in red and labeled. (F) Relative cell number fold change of SYNCRIP-deficient LNCaP/AR cells transduced with annotated guide RNAs and treated with 10 μM enzalutamide (Enz), measured by FACS-based competition assay and normalized to shSYNCRIP+sgNT group. 3 biological replicates in each group and mean ± s.e.m. is represented, p values were calculated using one-way ANOVA with Bonferroni multiple-comparison test. See also Figure S5 and Tables S3–S6.
Figure 6. |
Figure 6. |. SREX-resistant cell lines revealed high tumor heterogeneity in SYNCRIP-deficient tumors
(A) Schematic representation of the generation of SREX and NREX lines, created with BioRender.com. (B) Heatmap represents the expression fold changes (log10) of top 8 APOBEC-mutated resistance driver genes in a panel of SREX and NREX lines. (C) Heatmap represents the expression fold changes (log10) of top selected downstream targeted genes in SREX and NREX lines. (D) Heatmap represents the expression fold changes (log10) of marker genes for lineage-related transcriptional programs in SREX and NREX lines. For panels (B–D), results of qPCR assays and the average expression fold change (log10) of 3 biological replicates are shown. (E) Heatmap represents the normalized mutation counts (WES) in driver gene in SREX lines. (F–M) Relative cell number fold change of selected SREX lines treated with 10 μM enzalutamide (Enz), measured by cell proliferation assay and normalized to sgNT. For panel (F–M), 3 biological replicates in each group and mean ± s.e.m. is represented, p values were calculated using one-way ANOVA with Bonferroni multiple-comparison test. See also Figure S7 and Table S6.
Figure 7.
Figure 7.. Ectopic APOBEC-driven mutagenesis fuels tumoral heterogeneity and therapy resistance
(A) UMAP plot represents the transcriptomic profiles of LNCaP/AR cells transduced by annotated shRNAs, treated with vehicle (DMSO, Veh, shNT n = 6643, shSYN n = 5711) or 10 mM enzalutamide for 5 days (Acute_Enz, shNT n = 5603, shSYN n = 6721) or 14 days (Prolonged_Enz, shNT n = 5555, shSYN n = 5904). (B) UMAP plot represents the APOBEC-caused mutation counts in each single cell. Color intensity represents mutation counts per cell. (C) Boxplot represents APOBEC-caused mutation counts per cell. (D) Boxplot represents the ITH score in each single cell. (E) Violin plot represents the ITH score in wild-type (shNT) or SYNCRIP-deficient (shSYN) PCa cells exposed to acute or prolonged treatments. For (C–E), p values were calculated with Kruskal-Wallis test with Benjamini correction and n of each sample was the same as panel (A). (F) UMAP plot represents single cells colored by unsupervised clustering of 7 SYNCRIP-deficient (shSYN) subsets. (G) Pie plot represents the percentages of cells of the 7 SYNCRIP-deficient clusters at various times of exposure to treatment. Winner clusters were presented in green, loser clusters were presented in red. (H) UMAP plot represents the APOBEC-caused mutation counts in each SYNCRIP-deficient single cell. Color intensity represents mutation counts per cell. (I) Violin plot represents APOBEC-caused mutation counts per cell in clusters. (J) Violin plot represents ITH score in clusters. For (I and J), p values were calculated with Wilcoxon rank-sum test and n of each sample was the same as panel (F). See also Figure S8.
Figure 8.
Figure 8.. Evolutionary trajectory analysis revealed the dominant-resistant subclones with FOXA1 mutations
(A) UMAP plots represent the pseudotime trajectory of single cells of the SYNCRIP-deficient (shSYN) clusters. Color intensity represents the pseudotime estimation (B) UMAP plot represents the 7 SYNCRIP-deficient (shSYN) clusters of the single cell. (C) UMAP plot represents the APOBEC-caused mutation counts per cell. (D) UMAP plot represents the ITH score. For panels A–D, arrows and dot line represents the direction of pseudotime flow. (E) Heatmap represents the APOBEC-caused mutations (normalized mutation counts/cell) within 8 resistance drivers. Winner clusters were presented in green and loser clusters were presented in red. (F–H) Heatmap represents the expression of FOXA1 (F) and AR (G, H) downstream genes in each single cell along the pseudotime trajectory. For panels F–H, pseudotime estimation, normalized gene expression, and clusters are presented with different colored bars. Cluster 3 was annotated with blue square. (I) Schematic figure represents the hypothetic model, created with BioRender.com. See also Figure S8 and Table S7.

Comment in

Similar articles

Cited by

References

    1. Watson PA, Arora VK, and Sawyers CL (2015). Emerging mechanisms of resistance to androgen receptor inhibitors in prostate cancer. Nat. Rev. Cancer 15, 701–711. - PMC - PubMed
    1. Dagogo-Jack I, and Shaw AT (2018). Tumour heterogeneity and resistance to cancer therapies. Nat. Rev. Clin. Oncol. 15, 81–94. - PubMed
    1. Sabnis AJ, and Bivona TG (2019). Principles of Resistance to Targeted Cancer Therapy: Lessons from Basic and Translational Cancer Biology. Trends Mol. Med. 25, 185–197. - PMC - PubMed
    1. Stewart CA, Gay CM, Xi Y, Sivajothi S, Sivakamasundari V, Fujimoto J, Bolisetty M, Hartsfield PM, Balasubramaniyan V, Chalishazar MD, et al. (2020). Single-cell analyses reveal increased intratumoral heterogeneity after the onset of therapy resistance in small-cell lung cancer. Nat. Cancer 1, 423–436. - PMC - PubMed
    1. Marusyk A, Janiszewska M, and Polyak K (2020). Intratumor Heterogeneity: The Rosetta Stone of Therapy Resistance. Cancer Cell 37, 471–484. - PMC - PubMed

Publication types

Substances