. 2023 Aug 8;56(8):1862-1875.e9.
doi: 10.1016/j.immuni.2023.06.022. Epub 2023 Jul 20.

The gut protist Tritrichomonas arnold restrains virus-mediated loss of oral tolerance by modulating dietary antigen-presenting dendritic cells

Affiliations

The gut protist Tritrichomonas arnold restrains virus-mediated loss of oral tolerance by modulating dietary antigen-presenting dendritic cells

Luzmariel Medina Sanchez et al. Immunity. .

Abstract

Loss of oral tolerance (LOT) to gluten, driven by dendritic cell (DC) priming of gluten-specific T helper 1 (Th1) cell immune responses, is a hallmark of celiac disease (CeD) and can be triggered by enteric viral infections. Whether certain commensals can moderate virus-mediated LOT remains elusive. Here, using a mouse model of virus-mediated LOT, we discovered that the gut-colonizing protist Tritrichomonas (T.) arnold promotes oral tolerance and protects against reovirus- and murine norovirus-mediated LOT, independent of the microbiota. Protection was not attributable to antiviral host responses or T. arnold-mediated innate type 2 immunity. Mechanistically, T. arnold directly restrained the proinflammatory program in dietary antigen-presenting DCs, subsequently limiting Th1 and promoting regulatory T cell responses. Finally, analysis of fecal microbiomes showed that T. arnold-related Parabasalid strains are underrepresented in human CeD patients. Altogether, these findings will motivate further exploration of oral-tolerance-promoting protists in CeD and other immune-mediated food sensitivities.

Keywords: T helper 1; Tritrichomonas; celiac disease; dendritic cells; dietary antigen; loss of oral tolerance; microbiota; oral tolerance; regulatory T cell; reovirus.


Conflict of interest statement

Declaration of interests E.F.V. is a member of the Biocodex International and National (Canada) Scientific Review Boards, a member of the Center for Gut Microbiome Research and Education Scientific Advisory Board of the AGA, Secretary of the International Society of the Study of Celiac Disease, and holds grants from Kallyope and Codexis, unrelated to this study. H.J.G. holds a grant from Codexis, unrelated to this study.

Figures
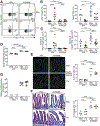
Figure 1.
Figure 1.. Suppression of T1L-induced LOT is associated with the presence of Tritrichomonas in in-housed mice.
(A-C) OT-II T cell conversion assay; see schematic in Figure S1A. Expression of Foxp3 and IFNγ in transferred OT-II T cells in the mLN assessed by flow cytometry. (A) Representative contour plots, (B) percentages and (C) absolute numbers. (D) Small intestine length (E) Tuft cells in the jejunum visualized by expression of DCLK1 in red; epithelial cells (EPCAM) in green; nuclei (DAPI) in blue. (F) Goblet cells in the jejunum visualized by PAS staining. (E-F) Representative images (left), quantification (right); Scale bars, 50 μm. (G) Tritrichomonas colonization in the cecum quantified by real time (RT)-PCR. Center is median. n.d. not detected. (A-G) Data represent two independent experiments (n=4-8 mice/group). (A-F) Center is mean, one-way ANOVA, Sidak’s post hoc test. *P < 0.05, **P < 0.01, ***P < 0.001, ****P < 0.0001, n.s. not significant.
Figure 2.
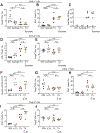
Figure 2.. T. arnold promotes dietary antigen-specific Treg cell responses.
(A) WT mice were inoculated perorally with T. arnold for 12 days. T. arnold colonization quantified by RT-PCR from intestinal contents of different regions. Center is median. (B-F) OT-II T cell conversion assay; see schematic in Figure S2D. Expression of (B-D) Foxp3 and IFNγ, (E) Gata3, and (F) Rorγt in transferred OT-II T cells in the mLN assessed by flow cytometry. (B) Representative contour plots, (C) percentages and (D-F) absolute numbers. (A-F) Data represent two independent experiments (n=5-9 mice/group). (C-F) Center is mean, two-tailed unpaired t-test. ***P < 0.001, n.s. not significant.
Figure 3.
Figure 3.. T. arnold protects against T1L-mediated LOT without impacting antiviral immunity and independent of the microbiota.
(A-F) OT-II T cell conversion assay; see schematic in Figure S3A. (A-C) Expression of Foxp3 and IFNγ in transferred OT-II T cells in the mLN assessed by flow cytometry. (A) Representative contour plots, (B) percentages and (C) absolute numbers. (D) T1L titers in the ileum assessed by plaque assay (post infection p.i.) (Plaque-forming unit (PFU)). Dotted line indicates detection limit. (E) 18 days post T1L infection sera were used for a plaque-reduction neutralization assay (PRNT 60). (D-E) Center is median. n.d. not detected. (F) RNA-seq of mLN 48 hours post T1L infection. Heat map of selected type-1 interferon inducible genes. The scale represents the Row Z-score. (n=4 mice/group). (G) T. arnold colonized mice were fed a non-water-soluble fiber diet for 4 weeks. T. arnold colonization quantified by RT-PCR from feces before (pre) and after (post) diet intervention. Lines connect values obtained from same mouse sampled pre and post diet intervention. Two-tailed paired t-test. (H) T. arnold colonized WT mice and control mice were fed non-water soluble fiber diet for 4 weeks prior to OT-II T cell transfer. One day after transfer mice were inoculated perorally with T1L or PBS and fed OVA in drinking water for 6 days. The expression of Foxp3 and IFNγ in transferred OT-II T cells in the mLN assessed by flow cytometry. Percentages are shown. (I-J) Germ-free WT mice were inoculated perorally with T. arnold or PBS for 12 days prior to OT-II T cell transfer. One day after transfer mice were inoculated perorally with T1L or PBS and fed OVA in drinking water for 6 days. The expression of (I) Tbet and (J) Foxp3 in transferred OT-II T cells in the mLN assessed by flow cytometry. Percentages are shown. (B-E, H-J) Data represent two independent experiments (n=3-9 mice/group). (B-C, I-J, H) Center is mean, one-way ANOVA, Sidak’s post hoc test. *P < 0.05, **P < 0.01, ***P < 0.001, n.s. not significant.
Figure 4.
Figure 4.. Succinate and IL-25 are not sufficient to protect against T1L-mediated LOT.
(A-E) OT-II T cell conversion assay; see schematic in Figure S4F. (A-B, D-E) The expression of Foxp3 and IFNγ in (A-B) transferred OT-II T cells (D-E) host CD4+ T cells in the mLN assessed by flow cytometry. Percentages are shown. (C) T1L titers in the ileum assessed by plaque assay 6 days post infection (Plaque-forming unit (PFU)). Dotted line indicates detection limit. . n.d. not detected. (F-J) OT-II T cell conversion assay; see schematic in Figure S4G. (F) Absolute numbers of ILC2 in the mLN. (G-J) Expression of Foxp3 and IFNγ in (G-H) transferred OT-II T cells (I-J) host CD4+ T cells in the mLN assessed by means of flow cytometry. Percentages are shown. (A-J) Data represent two independent experiments (n=4-7 mice/group). (A-B, D-J) Center is mean, one-way ANOVA, Sidak’s post hoc test. (C) Center is median. *P < 0.05, **P < 0.01, ***P < 0.001, ****P < 0.0001, n.s. not significant.
Figure 5.
Figure 5.. T. arnold restrains the virus-mediated proinflammatory program in dietary antigen-presenting DCs.
(A-M) WT mice were inoculated perorally with T. arnold or PBS for 12 days followed by peroral inoculation with T1L or PBS for 48 hours. (A-F) Expression of (A-B, D-E) IL-12p40 and (C, F) CD86 on (A-C) gated MHC-II+ CD11c+ CD103 CD11b+ PP DCs and (D-F) gated MHC-II+ CD11c+ CD103+ CD11b CD8a+ mLN DCs assessed by flow cytometry. (A, D) Representative dot plots, (B, E) percentages, and (C, F) MFI. (G) Il27 gene expression in the mLN quantified by RT-PCR. (H-K) RNA-seq of MHC-II+ CD11c+ CD103+ CD11b CD8a+ mLN DCs (n =3-4 mice/group). (H) Volcano blot for PBS vs T1L. (I) Normalized count number of Irf1. (J) Volcano blot for T1L vs T1L + T. arnold. (K) Heatmap showing IRF1 and NF-κB dependent DEGs increased in T1L compared to PBS. * Indicate significant differences between T1L vs T1L + T. arnold based on false discovery rate < 0.1. (L-M) mLN DCs co-cultured with naïve OT-II T cells for 3 days in presence of OVA peptide. (L) Expression of Tbet in OT-II T cells assessed by flow cytometry. (M) IFNγ in co-culture supernatants assessed by electrochemiluminescence (n=3 mice/group). (N) mLN DCs were pre-incubated with T. arnold culture supernatant and OVA peptide for 5 hours followed by co-culture with naïve OT-II T cells for 3 days. Expression of Tbet in OT-II T cells assessed by flow cytometry. Lines connect same mouse in the presence or absence of T. arnold supernatant (T. arnold SN). Two-tailed paired t-test. (O) OT-II T cell conversion assay; see schematic in Figure S3A. Mice were inoculated perorally with CW3 or PBS instead of T1L. Expression of IFNγ in transferred OT-II T cells in the mLN assessed by means of flow cytometry. Percentages are shown. (A-G, N-O) Data represent two independent experiments (n=4-8 mice/group). (A-G, I, L-M, O) Center is mean, one-way ANOVA, Tukey’s post hoc test. *P < 0.05, **P < 0.01, ***P < 0.001, ****P < 0.0001.
Figure 6.
Figure 6.. Parabasalia protect against LOT to gluten and are underrepresented in CeD patients compared to healthy controls.
(A-B) DTH assay; see schematic in Figure S6A. (A) Serum levels of Glia-specific IgG2c antibodies. (B) Degree of ear swelling. Data represent two independent experiments (n=4-7 mice/group). (C) Amount of remaining Glia measured by G12 antibody, detecting the immunogenic QPQLPY sequence within the 33-mer after in vitro Glia- T. arnold or small intestinal (SI) content co-incubation at indicated time points (n=2-3 biological replicates/group). (D) DQ8tg mice were inoculated perorally with T. arnold or PBS for 12 days followed by peroral inoculation with T1L or PBS for 18 hours. TG2 enzymatic activity assessed in the jejunum by 5BP cross-linking is shown in red (nuclei (blue), TG2 protein (green)). Representative images are shown. Scale bars, 50 μm. (E-G) Human stool DNA from healthy volunteers and active CeD patients subjected to ITS PCR-DNA sequence analysis. Frequency of (E) Parabasalia (F) Tritrichomonas spp. and (G) Pentatrichomonas spp. detected in healthy and active CeD patients (detected (Pos), not detected (Neg)). Two-sided Fisher’s exact test. (A-C) Center is mean, one-way ANOVA, Sidak’s post hoc test. *P < 0.05, **P < 0.01, ***P < 0.001, ****P < 0.0001, n.s. not significant.

References

    1. Abadie V, Sollid LM, Barreiro LB, and Jabri B (2011). Integration of genetic and immunological insights into a model of celiac disease pathogenesis. Annu Rev Immunol 29, 493–525. 10.1146/annurev-immunol-040210-092915. - DOI - PubMed
    1. Tjon JM, van Bergen J, and Koning F (2010). Celiac disease: how complicated can it get? Immunogenetics 62, 641–651. 10.1007/s00251-010-0465-9. - DOI - PMC - PubMed
    1. Sollid LM, and Jabri B (2013). Triggers and drivers of autoimmunity: lessons from coeliac disease. Nat Rev Immunol 13, 294–302. 10.1038/nri3407. - DOI - PMC - PubMed
    1. Green PH, and Jabri B (2003). Coeliac disease. Lancet 362, 383–391. 10.1016/S0140-6736(03)14027-5. - DOI - PubMed
    1. Rubio-Tapia A, Barton SH, and Murray JA (2011). Celiac disease and persistent symptoms. Clin Gastroenterol Hepatol 9, 13–17; quiz e18. 10.1016/j.cgh.2010.07.014. - DOI - PMC - PubMed

Publication types