. 2023 Aug 8;56(8):1910-1926.e7.
doi: 10.1016/j.immuni.2023.06.019. Epub 2023 Jul 20.

Influenza vaccine format mediates distinct cellular and antibody responses in human immune organoids

Affiliations

Influenza vaccine format mediates distinct cellular and antibody responses in human immune organoids

Jenna M Kastenschmidt et al. Immunity. .

Abstract

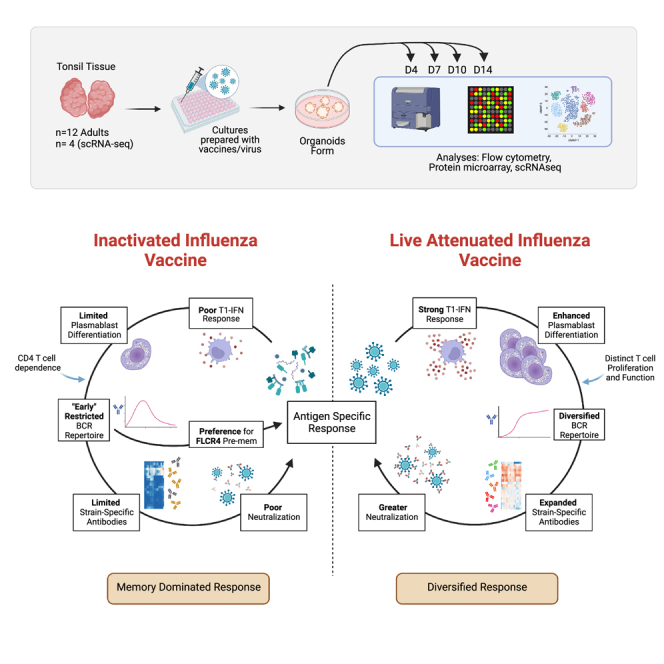
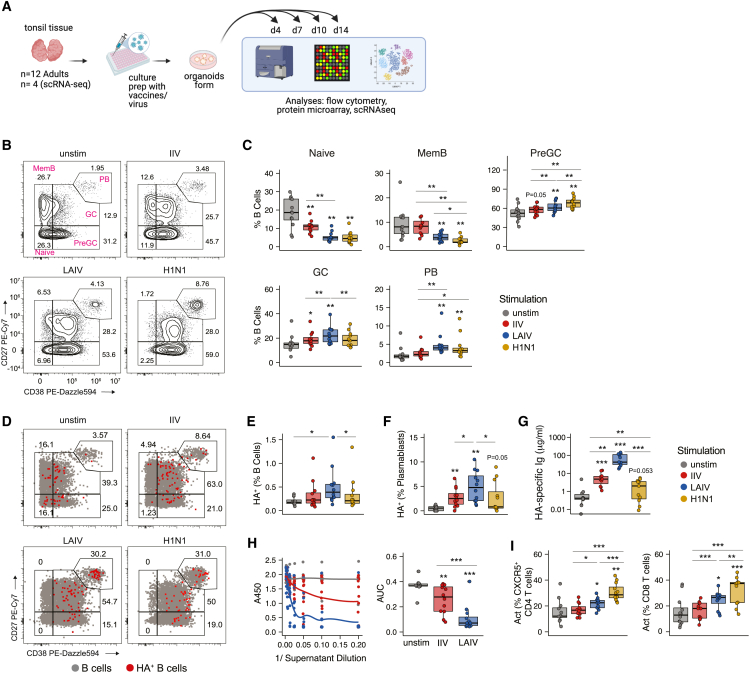
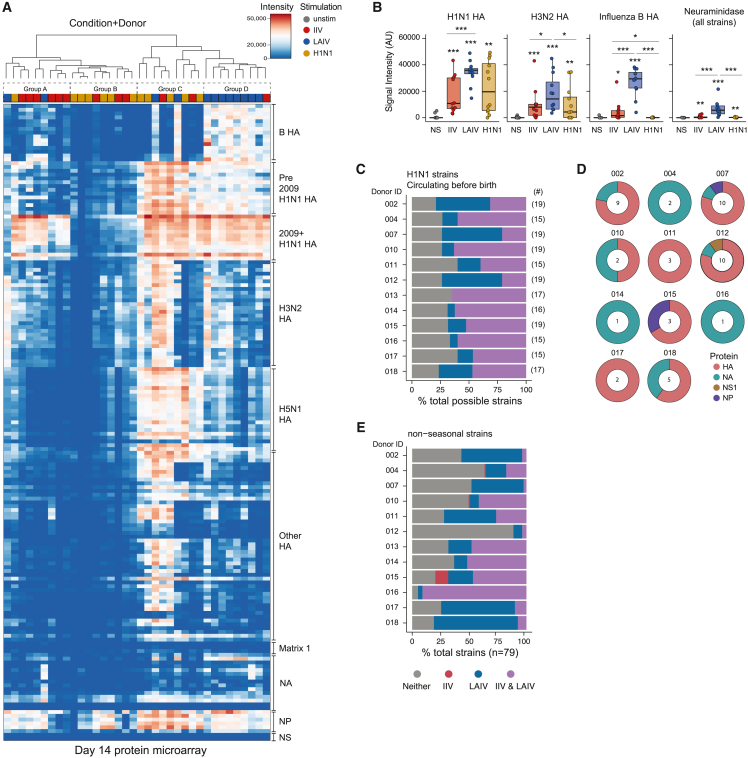
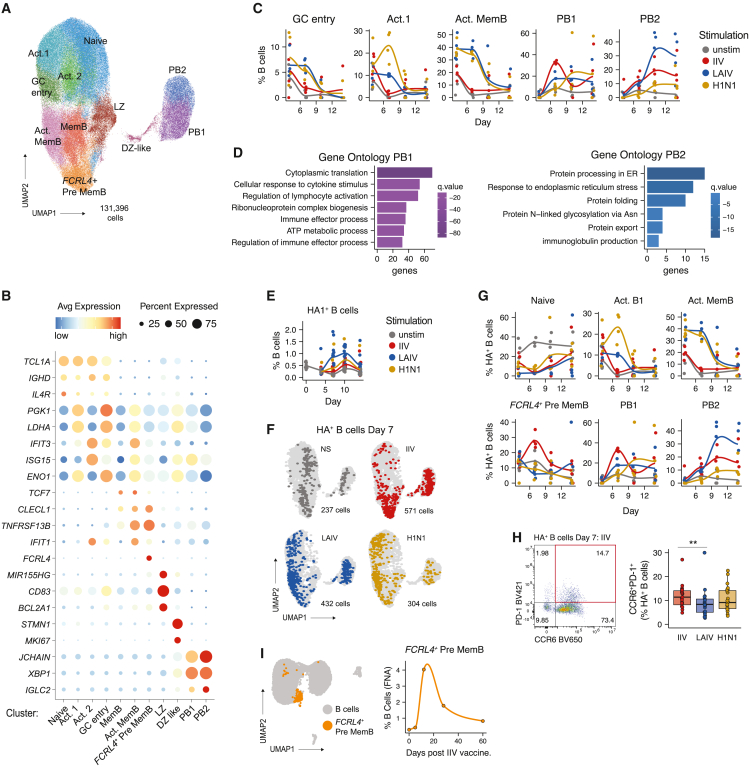
Highly effective vaccines elicit specific, robust, and durable adaptive immune responses. To advance informed vaccine design, it is critical that we understand the cellular dynamics underlying responses to different antigen formats. Here, we sought to understand how antigen-specific B and T cells were activated and participated in adaptive immune responses within the mucosal site. Using a human tonsil organoid model, we tracked the differentiation and kinetics of the adaptive immune response to influenza vaccine and virus modalities. Each antigen format elicited distinct B and T cell responses, including differences in their magnitude, diversity, phenotype, function, and breadth. These differences culminated in substantial changes in the corresponding antibody response. A major source of antigen format-related variability was the ability to recruit naive vs. memory B and T cells to the response. These findings have important implications for vaccine design and the generation of protective immune responses in the upper respiratory tract.

Keywords: B cells; B/T cell repertoire; T cells; adaptive immunity; antibodies; human immunology; influenza; organoids; vaccine modalities; vaccines.


Conflict of interest statement

Declaration of interests L.E.W. is the co-inventor of intellectual property assigned to Stanford University, “Systems and Methods to Model Adaptive Immune Responses,” which describes the immune organoid technology.

Figures

None
Graphical abstract
Figure 1
Figure 1
Multiple influenza antigen modalities induce GC reactions and specific antibody secretion in human tonsil organoids (A) Experimental design and workflow for tonsil organoids. Cells and supernatants were assessed using multiple readouts to define immune signatures. Created with Biorender.com. (B and C) Representative flow cytometry staining (B) and summary data (C) for total B cell (CD45+CD19+CD3) phenotypes from day 14 organoids stimulated with different influenza Ag modalities. (D) Representative flow cytometry staining of HA+ (red) and nonspecific (gray) B cells from day 14 organoids. Numbers indicate frequency of HA+ B cells of a given phenotype out of total HA+ B cells. (E) HA+ B cell frequencies. (F) HA+ plasmablast frequencies. (G) Quantification of HA-specific antibodies in day 14 organoid culture supernatants. (H) Virus neutralization by day 14 organoid culture supernatants; neutralization quantification by area under the curve (AUC). (I) Frequency of activated CXCR5+CD4 T cells and activated CD8 T cells on day 7. Activation was defined by dual expression of CD38 and HLA-DR. n = 12 donors (one experiment) for all data shown. ∗p < 0.05, ∗∗p < 0.01, ∗∗∗p < 0.001, ∗∗∗∗p < 0.0001 using a Kruskal-Wallis test followed by paired Mann-Whitney U tests to compare groups. p values shown are for comparisons against the unstimulated control unless otherwise indicated by lines. Boxplots show the median, with hinges indicating the first and third quartiles and whiskers indicating the highest and lowest value within 1.5 times the interquartile range of the hinges. See also Tables 1 and S5 and Figures S1 and S2.
Figure 2
Figure 2
Influenza vaccine modality influences antibody magnitude, specificity, and breadth (A) Heatmap of antibody-binding magnitude against influenza proteins on a high-throughput protein microarray. Culture supernatants are from day 14 organoids. Column dendrogram represents unbiased sample grouping based on similarity; top bar color represents the antigen stimulation. Rows represent individual proteins on the microarray and were manually arranged based on influenza strain origin and protein type. (B) Summary antibody data from the protein microarray by protein type and virus source. Data represent median values. Each point is an individual donor. ∗p < 0.05, ∗∗p < 0.01, and ∗∗∗p < 0.001 using a Kruskal-Wallis test followed by paired Mann-Whitney U tests to compare groups. p values shown are for comparisons against the unstimulated control unless otherwise indicated by lines. Boxplots show the median, with hinges indicating the first and third quartiles and whiskers indicating the highest and lowest value within 1.5 times the interquartile range of the hinges. (C) Detection of cross-reactive Ab production from IIV- vs. LAIV-stimulated tonsil organoids. Each donor is a row. The numbers of protein antigens from H1N1 strains that circulated prior to each donor’s birth are shown to the right of the plot. Abs produced from the organoids were classified as either present or absent in the culture supernatants. (D) Protein targets from Ab responses unique to LAIV-stimulated organoids. NA, neuraminidase; NS, nonstructural; NP, nucleoprotein. The number of strains uniquely targeted by Abs from LAIV stimulation are shown in doughnut centers. (E) Organoid Ab responses to nonseasonal influenza strain proteins on the microarray. Ab presence or absence was classified and plotted as in (C). n = 12 donors for all analyses (1 experiment). See also Tables 1, S1, and S6.
Figure 3
Figure 3
Influenza vaccine modalities elicit distinct antigen-specific B cell populations (A) Combined uniform manifold approximation and projection (UMAP) of scRNA-seq data from immune organoid B cells. Cells from days 4, 7, 10, and 14 and all stimulation conditions are shown in aggregate. Clusters are represented by different colors and labels were manually annotated based on transcriptional and protein profiles. n = 4 donors (1 experiment). (B) Bubble plot of select marker genes for each B cell cluster. Bubble size indicates the frequency of cells with gene expression and color represents level of RNA expression. (C) B cell scRNA-seq cluster frequencies over time for each stimulation. Each donor is a point. n = 4 donors (1 experiment). (D) Gene ontology analysis comparing PB1 and PB2 transcriptional profiles. (E) Kinetics of HA+ B cell frequencies as determined by flow cytometry. n = 12 donors (1 experiment). (F) Distribution of day 7 HA+ B cells (colored points) on the total B cell (light gray) UMAP. n = 4 donors (1 experiment). (G) Transcriptional profiles (cluster identity) and kinetics of HA+ B cells. Frequencies shown were calculated out of total HA+ B cells. n = 4 donors (1 experiment). (H) Representative flow cytometry staining (left) and quantification (right) of CCR6+PD-1+ HA+ pre-memory B cells on day 7 poststimulation. n = 23 donors (3 experiments combined). Paired Mann-Whitney U tests were used to compare groups; ∗∗p < 0.01 (I) Analysis of public data from Turner et al. UMAP (left) and quantification (right) of FCRL4+ memory B cells in fine needle aspirates (FNAs) of an adult vaccinated with IIV. Data were derived from a public scRNA-seq dataset (GSE148633). n = 1 donor analyzed before vaccination and on days 5, 12, 28, and 60 postimmunization. See also Tables 1 and S2 and Figure S3.
Figure 4
Figure 4
IIV and LAIV elicit distinct BCR repertoires and transcriptional profiles (A) Kinetics of HA+ B cells with a given transcriptional profile in tonsil organoids. Phenotypes were defined based on scRNA-seq and manual annotation of cluster identities. Activated, Act. 1, Act. 2, and GC-entry clusters. Memory, MemB, Act. MemB, and FCRL4 Pre-MemB clusters. GC, LZ and DZ-like clusters. PB, PB1 and PB2 clusters. (B) BCR isotype usage in HA+ memory, GC, and PB B cells at different time points. (C) BCR SHM frequencies of HA+ B cell subsets following organoid stimulation with IIV, LAIV, or H1N1. Unpaired Mann-Whitney U tests were used to compare groups; ∗p < 0.05 and ∗∗∗∗p < 0.0001. (D) V gene usage of HA+ plasmablasts following stimulation with different influenza antigens on day 7. (E) Shannon index as a metric of BCR diversity for HA+ plasmablasts. Boxplots show the median, with hinges indicating the first and third quartiles and whiskers indicating the highest and lowest value within 1.5 times the interquartile range of the hinges. (F) Representative data (1 of 4 donors) of the number and size of HA+ BCR clonal families. Each wedge represents a clonal family. n = 4 donors (1 experiment) for all data. See also Table 1 and Figure S3.
Figure 5
Figure 5
T cells respond to influenza vaccine and virus antigens with different functional abilities (A) UMAP (generated from scRNA-seq data) of sorted CD4 T cells from organoids collected on days 4, 7, 10, and 14 from n = 4 donors (1 experiment). (B) Bubble plot of top differentially expressed genes used to identify T cell clusters. Bubble size indicates percentage of cells expressing the marker and color indicates magnitude of expression. (C) Frequencies of key T cell clusters in organoids at different time points poststimulation with influenza antigen modalities (n = 4 donors, 1 experiment). (D) Frequencies of GC TFH following organoid stimulation (n = 12 donors, 1 experiment) as quantified by flow cytometry. (E) GC TFH frequencies at the peak of CD4 T cell activation (day 7) as quantified by flow cytometry (n = 5 donors, 1 experiment). (F) Top gene ontology (GO) terms of genes upregulated in LAIV relative to IIV-stimulated organoids in TFH and GC TFH on day 7. (G) Violin plot of candidate genes (mapping to “cytokine-mediated signaling pathway”) upregulated with LAIV relative to IIV stimulation in TFH and GC TFH on day 7. (H) Cytokine production by GC TFH under different stimulation conditions on day 7 as quantified by intracellular staining (n = 12 donors, 1 experiment). (I) Frequencies of Th1- (CXCR3+CCR4CCR6), Th2- (CXCR3CCR4+CCR6), and Th17-like (CXCR3CCR4+CCR6+) GC TFH on day 7 as quantified by flow cytometry (n = 12 donors, 1 experiment). ∗p < 0.05, ∗∗p < 0.01, and ∗∗∗p < 0.001 using a Kruskal-Wallis test followed by paired Mann-Whitney U tests to compare groups. p values shown are for comparisons against the unstimulated control unless otherwise indicated by lines. (J) Bar graphs comparing Chao diversity metric within activated (OX40+) T cells, TFH, and GC TFH on day 7 poststimulation. (K) Secreted cytokines and chemokines in organoid supernatants on day 4, measured using Luminex (n = 4 donors, 1 experiment). Boxplots show the median, with hinges indicating the first and third quartiles and whiskers indicating the highest and lowest value within 1.5 times the interquartile range of the hinges. See also Tables 1, S2, and S3 and Figures S4–S6.
Figure 6
Figure 6
Cellular and signaling mechanisms underlying differences in the quality and magnitude of the IIV vs. LAIV antibody response (A–C) Type I interferon supplementation of immune organoids. Frequencies of HA+ B cells (A), HA+ plasmablasts (B), and influenza-specific antibodies (C) on day 7. (D–F) Effects of naive or memory CD4 T cell depletion on organoid responses. Frequencies of total plasmablasts (D), HA+ B cells (E), and HA-specific Abs (F) on day 7. (G–J) Effects of memory B cell depletion on organoid responses. Flow cytometry analysis of wild-type and memory B cell-depleted tonsil organoids on day 7 poststimulation (G). Antibody quantification (top) or fold-change (bottom) of specific antibodies on day 7 against hemagglutinin (H), neuraminidase (I), and nucleoprotein (J) in wild-type and memory B cell-depleted organoids. n = 6 donors combined from 2 experiments for all data shown. Boxplots show the median, with hinges indicating the first and third quartiles and whiskers indicating the highest and lowest value within 1.5 times the interquartile range of the hinges. ∗p < 0.05 and ∗∗p < 0.01 using a Kruskal-Wallis test followed by paired Mann-Whitney U tests to compare groups. p values shown are for comparisons against the unstimulated control unless otherwise indicated by lines. See also Tables 1 and S5.

References

    1. Erbelding E.J., Post D.J., Stemmy E.J., Roberts P.C., Augustine A.D., Ferguson S., Paules C.I., Graham B.S., Fauci A.S. A universal influenza vaccine: the strategic plan for the National Institute of Allergy and Infectious Diseases. J. Infect. Dis. 2018;218:347–354. doi: 10.1093/infdis/jiy103. - DOI - PMC - PubMed
    1. Nachbagauer R., Feser J., Naficy A., Bernstein D.I., Guptill J., Walter E.B., Berlanda-Scorza F., Stadlbauer D., Wilson P.C., Aydillo T., et al. A chimeric hemagglutinin-based universal influenza virus vaccine approach induces broad and long-lasting immunity in a randomized, placebo-controlled phase I trial. Nat. Med. 2021;27:106–114. doi: 10.1038/s41591-020-1118-7. - DOI - PubMed
    1. Krammer F., Fouchier R.A.M., Eichelberger M.C., Webby R.J., Shaw-Saliba K., Wan H., Wilson P.C., Compans R.W., Skountzou I., Monto A.S. NAction! How can neuraminidase-based immunity contribute to better influenza virus vaccines? mBio. 2018;9:e02332-17. doi: 10.1128/mBio.02332-17. - DOI - PMC - PubMed
    1. Park J., Fong S., Schwartzman L.M., Sheng Z.-M., Freeman A., Matthews L., Xiao Y., Ramuta M.D., Batchenkova N.A., Qi L., et al. An inactivated multivalent influenza A virus vaccine is broadly protective in mice and ferrets. Sci Transl. Med. 2021;14:eabo2167. doi: 10.1126/scitranslmed.abo2167. - DOI - PMC - PubMed
    1. Ivachtchenko A.V., Ivanenkov Y.A., Mitkin O.D., Yamanushkin P.M., Bichko V.V., Shevkun N.A., Karapetian R.N., Leneva I.A., Borisova O.V., Veselov M.S. Novel oral anti-influenza drug candidate AV5080. J. Antimicrob. Chemother. 2014;69:1892–1902. doi: 10.1093/jac/dku074. - DOI - PubMed

Publication types