. 2023 Aug 8;56(8):1844-1861.e6.
doi: 10.1016/j.immuni.2023.06.021. Epub 2023 Jul 20.

Obesity-induced dysregulation of skin-resident PPARγ+ Treg cells promotes IL-17A-mediated psoriatic inflammation

Affiliations

Obesity-induced dysregulation of skin-resident PPARγ+ Treg cells promotes IL-17A-mediated psoriatic inflammation

Pulavendran Sivasami et al. Immunity. .

Abstract

Obesity is a major risk factor for psoriasis, but how obesity disrupts the regulatory mechanisms that keep skin inflammation in check is unclear. Here, we found that skin was enriched with a unique population of CD4+Foxp3+ regulatory T (Treg) cells expressing the nuclear receptor peroxisome proliferation-activated receptor gamma (PPARγ). PPARγ drove a distinctive transcriptional program and functional suppression of IL-17A+ γδ T cell-mediated psoriatic inflammation. Diet-induced obesity, however, resulted in a reduction of PPARγ+ skin Treg cells and a corresponding loss of control over IL-17A+ γδ T cell-mediated inflammation. Mechanistically, PPARγ+ skin Treg cells preferentially took up elevated levels of long-chain free fatty acids in obese mice, which led to cellular lipotoxicity, oxidative stress, and mitochondrial dysfunction. Harnessing the anti-inflammatory properties of these PPARγ+ skin Treg cells could have therapeutic potential for obesity-associated inflammatory skin diseases.

Keywords: IL-17A; PPARγ; Treg; free fatty acid; high-fat diet; immunometabolism; obesity; psoriasis; skin; γδ T cell.


Conflict of interest statement

Declaration of interests The authors declare no competing interests.

Figures

Figure 1.
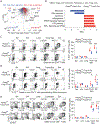
Figure 1.. Identification and characterization of PPARγ+ Treg cells in the skin.
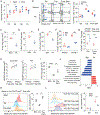
(A) Volcano plots comparing transcriptomes of CD45+TCRβ+CD4+ Foxp3/YFP+ Treg cells sorted from the skin or spleen (Spl) from 2-week-old Pparg+/+Foxp3-Yfp-Cre littermates. Transcripts increased or decreased (FC>2.5, P<0.05) in skin Treg cells compared to spleen Treg cells were designated as skin Treg up- or down-signatures and highlighted in red or blue, respectively. FC: fold change. (B) GSEA showing the Kegg pathways most enriched (NES>1, P<0.05) or depleted (NES<−1, P<0.05) in skin Treg cells compared to spleen Treg cells from 2-week-old Pparg+/+Foxp3-Cre littermates. NES, normalized enrichment score; FDR, false discovery rate. (C) Representative flow cytometric plots showing frequencies of PPARγ+ Treg cells among CD4+ T cells from Spl, iLN, lung, trunk skin, and ear of PPARγ-Tdt Foxp3-GFP mice at various ages. Numbers in the plots indicate the frequencies of cells within each gate. Cells were gated on live CD45+CD3+CD4+ T cells. (D) Summary plot showing the frequencies of Treg cells among CD4+ T cells (top) or the frequencies of PPARγ+ cells among Treg cells (bottom) in spleen, iLN, lung, trunk skin, or ear of PPARγ-Tdt Foxp3-GFP mice at different ages (n≥3). (E) Summary plot showing normalized RNA-seq reads of PPARG in blood naïve Treg cells, blood memory Treg cells, or skin Treg cells (CD4+CD127CD25+) from human donors (n=5). (F) Frequencies of proliferating cells among PPARγ- or PPARγ+ skin Treg cells from 2-week-old PPARγ-Tdt Foxp3-GFP mice. Mice were pulsed i.p. for 5h with EdU (40µg/g body weight) and then euthanized for flow cytometric analysis (n=5). (G&H) Frequencies of ST2+ (G) or IL-10+ (H) cells among PPARγ or PPARγ+ skin Treg cells from 2-week-old PPARγ-Tdt Foxp3-GFP mice (n=4). IL-10 protein was detected by anti-IL-10 antibody staining in cells following 4 hours of ex vivo stimulation with phorbol 12-myristate 13-acetate (PMA) and ionomycin. Summary plots show data pooled from 2–4 independent experiments. Mean ± SD. FC: fold change. See also Figure S1 and S2.
Figure 2.
Figure 2.. PPARγ promotes skin Treg cell homeostasis.
(A&B) Frequencies (Foxp3+ cells among CD45+CD3+CD4+ T cells) and numbers of CD4+ Foxp3+ Treg cells from different tissues of Ppargf/fFoxp3-Cre and Pparg+/+Foxp3-Cre littermates at 2 weeks (A) or 8 weeks (B) of age (n≥4). (C&D) Frequencies of EdU+ (C) or Annexin V+ (D) cells among CD4+ Foxp3+ Treg cells from different tissues of 2-week-old Ppargf/fFoxp3-Cre and Pparg+/+Foxp3-Cre littermates (n≥3). Summary plots show data pooled from 2–4 independent experiments. Mean ± SD. See also Figure S3.
Figure 3.
Figure 3.. PPARγ is a major driver for the distinct phenotype of skin Treg cells.
(A) Volcano plot comparing gene expression of CD45+TCRβ+CD4+ Foxp3/YFP+ skin Treg cells from 2-week-old Pparg+/+Foxp3-Cre and Ppargf/fFoxp3-Cre mice. Skin Treg signature genes (defined in Fig 1A) are highlighted in red (increased) or blue (decreased). The number of genes from each signature preferentially expressed by one or the other population are shown at the top of the plot. FC: fold change. (B) GSEA showing the Kegg and Hallmark pathways most enriched or depleted in wild-type (WT) skin Treg cells from 2-week-old Pparg+/+Foxp3-Cre compared to PPARγ-deficient skin Treg cells from 2-week-old Ppargf/fFoxp3-Cre mice (P<0.05, NES>1 or <−1). (C-E) Left: Representative plots showing the frequencies of ST2+ (C), IL-10+ (D), or KLRG1+ (E) Treg cells from different tissues of 2-week-old Pparg+/+Foxp3-Cre and Ppargf/fFoxp3-Cre mice. Gated on live CD45+CD3+CD4+ T cells. Right: Summary plot displaying the frequencies of ST2+ (C), IL-10+ (D), or KLRG1+ (E) cells among CD4+ Foxp3+ Treg cells from different tissues of 2-week-old Pparg+/+Foxp3-Cre and Ppargf/fFoxp3-Cre mice (n≥5). Summary plots show data pooled from 2–4 independent experiments. Mean ± SD.
Figure 4.
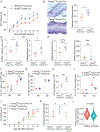
Figure 4.. Treg-specific deletion of Pparg exacerbates IMQ-induced psoriasis.
(A-I) 8-week-old Pparg+/+Foxp3-Cre or Ppargf/fFoxp3-Cre mice were treated with 15mg cream containing 5% IMQ onto each ear daily for 7 days (n≥4). (A) Changes in ear thickness relative to day 0 of IMQ application. Mean ± SEM. (B) Left: representative image of hematoxylin and eosin (H&E) staining of ear sections on day 7 after IMQ treatment. Arrows and solid lines indicate measurement of ear thickness. An average of at least 3 measurements per sample was calculated. Right: Summary of epidermal thickness. Mean ± SD. Scale bars on the graph indicate 100μM. (C) Numbers of total CD45+ cells in the ear on day 7 after IMQ treatment. Mean ± SD. (D) Numbers of Ly6G+ neutrophils in the ear on day 7 after IMQ treatment. Mean ± SD. (E) qPCR quantification of Il17a (left) and Ifna (right) gene expression from ear on day 7 after IMQ treatment. Mean ± SD. (F) Frequencies of IL-17A+ cells among CD45+ CD3+ γδ TCRint cells in the spleen (Spl) and ear on day 7 after IMQ treatment. Mean ± SD. (G) Frequencies of Foxp3+ Treg cells among CD4+ cells in the spleen and ear on day 7 after IMQ treatment. Mean ± SD. (H) Numbers of CD4+Foxp3+ Treg cells in the ear on day 7 after IMQ treatment. Mean ± SD.. (I) Frequencies of IL-10+ cells among CD4+ Foxp3+ Treg cells in the spleen and ear on day 7 after IMQ treatment. Mean ± SD. (J-K) 8-week-old Pparg+/+Foxp3-Cre or Ppargf/fFoxp3-Cre mice were injected intravenously with 1µg recombinant mouse IL-10 or PBS daily and ears were treated with 15mg cream containing 5% IMQ daily for 6 days (n≥4). (J) Changes in ear thickness relative to day 0 of IMQ application. Mean ± SEM. Stars on graph indicate statistical analysis between corresponding groups and the Ppargf/fFoxp3-Cre group. (K) Summary of epidermal thickness. Mean ± SD. (L) PPARγ module score in skin Treg cells (identified as CD3D+ FOXP3+ IL2RA+ CTLA4+ TIGIT+) from healthy donors (n=5) or patients with psoriasis (n=13). Kolmogorov–Smirnov test. Data was derived from GSE151177. Summary plots show data representing 2–3 independent experiments. See also Figure S4.
Figure 5.
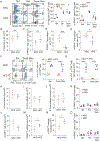
Figure 5.. Loss of PPARγ+ Treg cells and increase in IL-17+ γδ T cells in the skin from HFD-fed mice.
6–8-week-old PPARγ-Tdt Foxp3-thy1.1 mice were either sustained on NCD or switched to HFD for 16 weeks (n≥4). (A) Treg compartment in the spleen (Spl), ear, and trunk skin of NCD- or HFD-fed mice. Left: representative flow cytometric plot. Gated on live CD45+CD3+CD4+ T cells. Middle: summary plot displaying the frequency of Foxp3+ Treg cells among CD4+ T cells. Right: summary plot displaying the frequency of PPARγ+ cells among CD4+ Foxp3+ Treg cells. (B) Number of CD4+ Foxp3+ Treg cells in the spleen. (C-E) Number of CD4+ PPARγ+ Foxp3+ Treg cells in the spleen (C), ear (D), or trunk skin (E). (F) Frequencies of IL-17A+ cells among CD45+ CD3+ γδ TCRint cells in the ear and trunk skin. Left: representative flow cytometric plot. Gated on CD45+ CD3+ γδ TCRint cells. Right: summary plot. (G) Numbers of IL-17A+ CD45+ CD3+ γδ TCRint cells in the ear and trunk skin. (H-J) Number of CD4+ Foxp3- Tconv cells in the spleen (H), ear (I), and trunk skin (J). (K) Frequency of PPARγ+ cells among CD4+ Foxp3- Tconv cells in different tissues. (L-N) Number of CD8+ T cells in the spleen (L), ear (M), and trunk skin (N). (O) Frequency of PPARγ+ cells among CD3+ CD8+ T cells in different tissues. Summary plots show data representing 3 independent experiments. Mean ± SD. ns, not significant. See also Figure S5.
Figure 6.
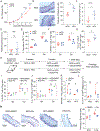
Figure 6.. Topical Pio treatment alleviates IL-17A-mediated psoriatic inflammation in HFD-fed mice.
(A-G) 6–8-week-old PPARγ-Tdt Foxp3-thy1.1 mice were either sustained on NCD or switched to HFD for 16 weeks. 15mg cream containing 5% IMQ was applied onto each ear daily for 5 days (n≥4). (A) Changes in ear thickness relative to day 0 of IMQ application. Mean ± SEM. (B) Left: representative image of hematoxylin and eosin (H&E) staining of ear sections on day 5 after IMQ treatment. Right: summary of epidermal thickness. Mean ± SD. Scale bars on the graph indicate 200μM. (C&D) qPCR quantification of Il17a (C) and Ifna (D) gene expression from ear on day 5 after IMQ treatment. Mean ± SD. (E) Frequency of Foxp3+ Treg cells among CD4+ T cells in the spleen and ear. Mean ± SD. (F) Frequency of PPARγ+ cells among Foxp3+ Treg cells in the spleen and ear. Mean ± SD. (G) Frequency of IL-17A+ cells among CD45+CD3+γδ TCRint cells in the ear. Mean ± SD. (H-M) 6-week-old PPARγ-Tdt Foxp3-thy1.1 mice were fed on NCD or HFD for 8 weeks, and then sustained on the same diet while being applied topically with 0.4mg Pio or DMSO onto each ear three times a week for 8 weeks. 15mg cream containing 5% IMQ along with 0.2mg Pio or DMSO were then applied onto each ear daily for another 6 days (n=4). Mean ± SD. (H) Experimental design scheme. (I) Frequency of PPARγ+ cells among CD4+Foxp3+ Treg cells. Mean ± SD. (J) Frequency of IL-17A+ cells among CD45+CD3+γδ TCRint T cells. Mean ± SD. (K) Number of CD4+ Foxp3+ PPARγ+ Treg cells in the ear. Mean ± SD. (L) Number of CD45+ CD3+ IL-17A+ γδ TCRint T cells in the ear. Mean ± SD. (M) Left: representative image of H&E staining of ear sections on day 6 after IMQ treatment. Right: Summary of epidermal thickness. Mean ± SD. Scale bars on the graph indicate 200μM. Summary plots show data representing 2–3 independent experiments. See also Figure S6.
Figure 7.
Figure 7.. Elevated long-chain FFAs drive the loss of PPARγ+ skin Treg cells during obesity.
(A) Quantification of FFA levels in the ear of PPARγ-Tdt Foxp3-thy1.1 mice fed on NCD or HFD for 16 weeks. PA, palmitic acid; SA, stearic acid; OA, oleic acid; LA, linoleic acid. (B) 3 μmol/g body weight palmitate or vehicle control was injected subcutaneously into 2-week-old PPARγ-Tdt Foxp3-thy1.1 mice 3 times a week for 2 weeks (n≥4). Left: representative flow cytometric plot showing the Treg compartment in spleen, ear, and trunk skin. Gated on live CD45+ CD3+ CD4+ T cells. Right: summary plot displaying the frequencies of PPARγ+ cells among CD4+Foxp3+ Treg cells. (C-F) CD45+ CD4+ CD3+ Foxp3+ Treg cells were sorted from the skin of 2–3-week-old PPARγ-Tdt Foxp3-thy1.1 mice and cultured in the presence of anti-CD3/CD28-coated beads, 2000 U/ml recombinant human IL-2, and 20 ng/ml IL-33 with 300 μM BSA or BSA-conjugated PA for 3 days. In the last 2 hrs of culture, cells were pulsed with 10 μM EdU (n=3). (C) Number of live CD4+Foxp3+ Treg cells. (D) Frequency of EdU+ cells among live CD4+ Foxp3+ Treg cells. (E) Frequency of live cells among CD4+Foxp3+ Treg cells. (F) Frequency of EdU+ cells among PPARγ+ or PPARγ- CD4+Foxp3+ Treg cells. (G) Frequency of CD36+ cells among CD4+Foxp3+ PPARγ+ or PPARγ- Treg cells in the skin from 2-week-old Pparg-Tdt Foxp3-thy1.1 mice (n=4). (H) Mean fluorescence intensity (MFI) of BODIPY-PA uptake in PPARγ+ or PPARγ- CD4+Foxp3+ Treg cells in the trunk skin (left) or ear (right) from 2-week-old PPARγ-Tdt Foxp3-thy1.1 mice (n=4). (I) Skin CD45+ CD4+ CD3+ Foxp3+ Treg cells from 2–3-week-old PPARγ-Tdt Foxp3-thy1.1 mice were cultured in the presence of anti-CD3/CD28-coated beads, 2000 U/ml recombinant human IL-2, and 20 ng/ml IL-33 with BSA, BSA-PA, or BSA-PA+SSO for 3 days. Plot displays the number of live CD4+ Foxp3+ Treg cells (n=3). (J) GSEA analysis of pathways induced or suppressed in skin Treg cells by treatment with 300μM BSA-PA compared to BSA alone in vitro for 3 days (n=3) (P<0.05, NES>1 or <−1). (K) Mitotracker deep red (MTDR) staining in skin CD4+Foxp3+ Treg cells cultured with BSA, BSA-PA, or BSA-PA+SSO for 3 days. Left, representative plot. Gated on live CD4+Foxp3+ Treg cells. Right: summary plot showing the MFI of MTDR staining in CD4+Foxp3+ Treg cells (n=4). (L) MTDR staining in spleen or skin CD4+Foxp3+ Treg cells from PPARγ-Tdt Foxp3-thy1.1 mice fed on NCD or HFD for 16 weeks. Left, representative plot. Gated on live CD45+ CD4+ CD3+ Foxp3+ Treg cells. Right: summary plot showing the MFI of MTDR staining in CD4+ Foxp3+ Treg cells (n≥3). Summary plots show data representing 2–3 independent experiments. See also Figure S7.

Comment in

References

    1. Kunz M, Simon JC, and Saalbach A (2019). Psoriasis: Obesity and Fatty Acids. Front Immunol 10, 1807. 10.3389/fimmu.2019.01807. - DOI - PMC - PubMed
    1. Jensen P, and Skov L (2016). Psoriasis and Obesity. Dermatology 232, 633–639. 10.1159/000455840. - DOI - PubMed
    1. Setty AR, Curhan G, and Choi HK (2007). Obesity, waist circumference, weight change, and the risk of psoriasis in women: Nurses’ Health Study II. Arch Intern Med 167, 1670–1675. 10.1001/archinte.167.15.1670. - DOI - PubMed
    1. Alotaibi HA (2018). Effects of Weight Loss on Psoriasis: A Review of Clinical Trials. Cureus 10, e3491. 10.7759/cureus.3491. - DOI - PMC - PubMed
    1. Zhang Y, Li Q, Rao E, Sun Y, Grossmann ME, Morris RJ, Cleary MP, and Li B (2015). Epidermal Fatty Acid binding protein promotes skin inflammation induced by high-fat diet. Immunity 42, 953–964. 10.1016/j.immuni.2015.04.016. - DOI - PMC - PubMed

Publication types