. 2023 Aug 15;4(8):101128.
doi: 10.1016/j.xcrm.2023.101128. Epub 2023 Jul 20.

Mechanical confinement promotes heat resistance of hepatocellular carcinoma via SP1/IL4I1/AHR axis

Affiliations

Mechanical confinement promotes heat resistance of hepatocellular carcinoma via SP1/IL4I1/AHR axis

Guo-Pei Zhang et al. Cell Rep Med. .

Abstract

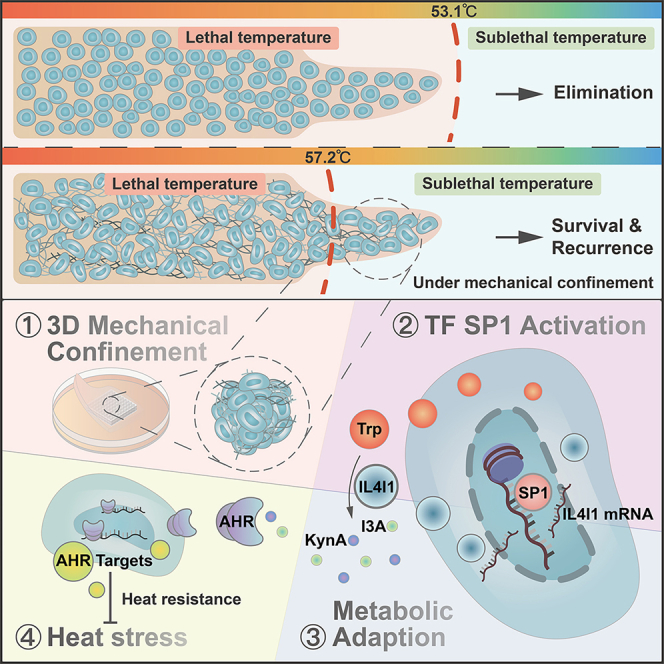
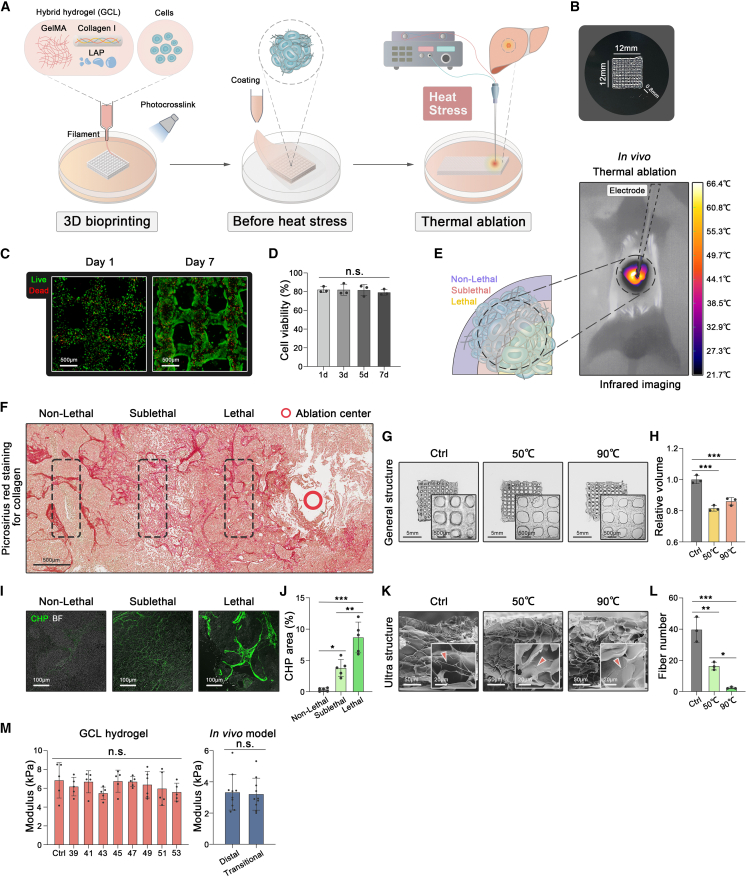
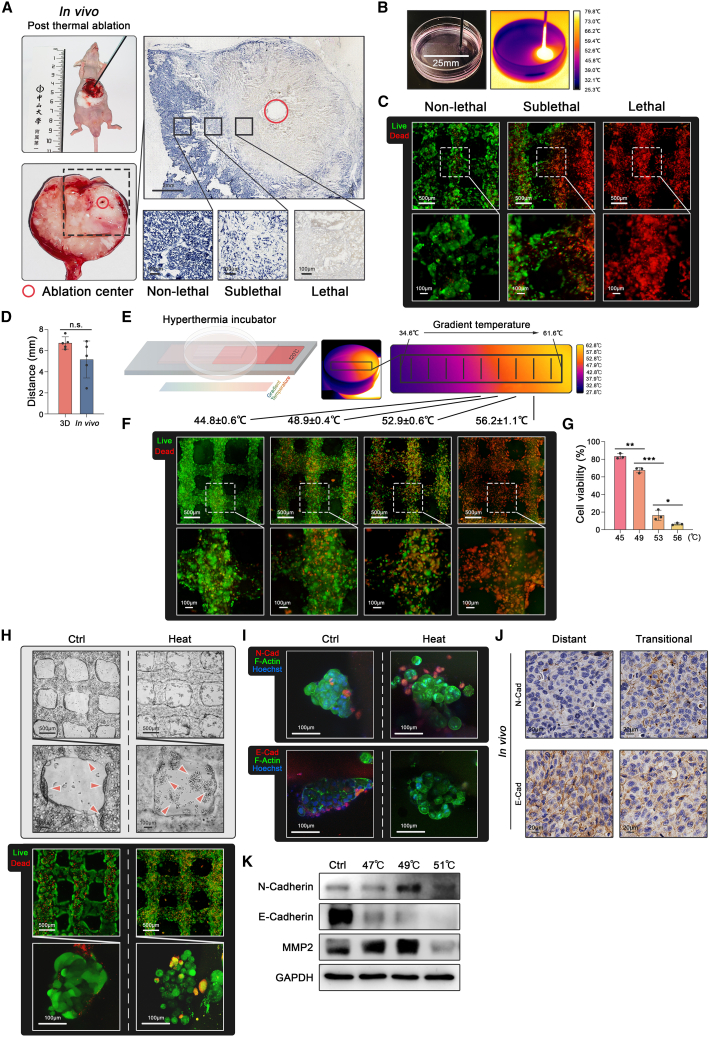
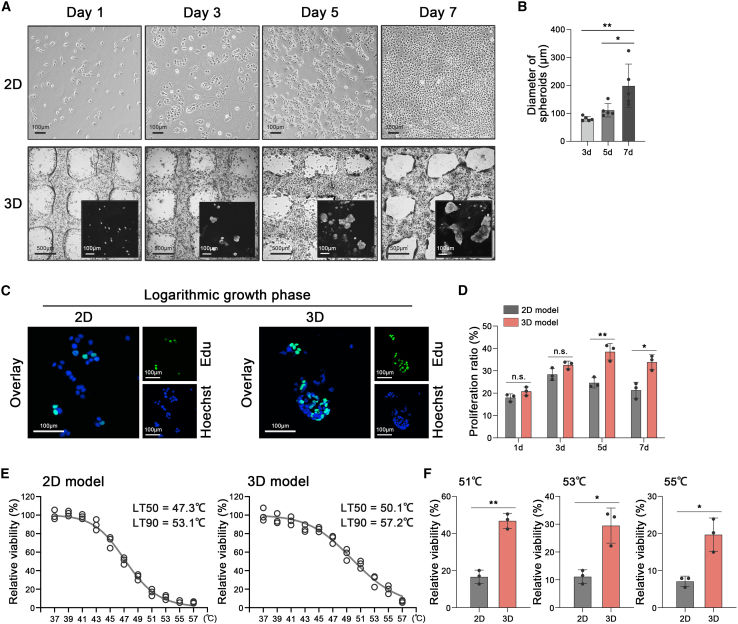
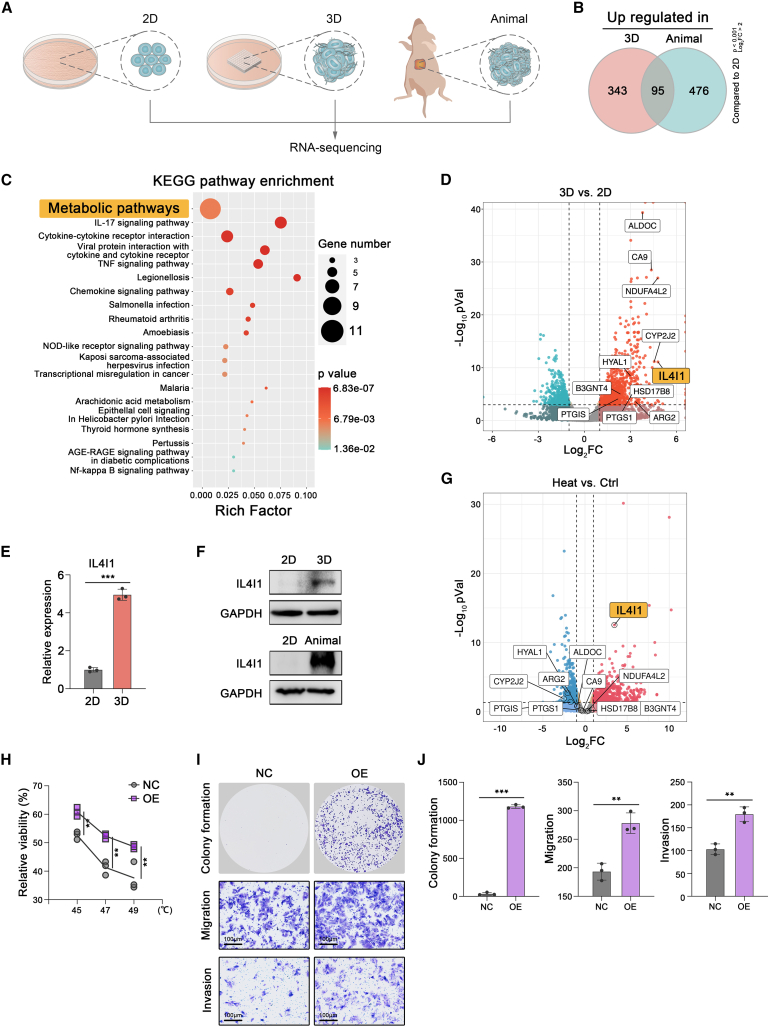
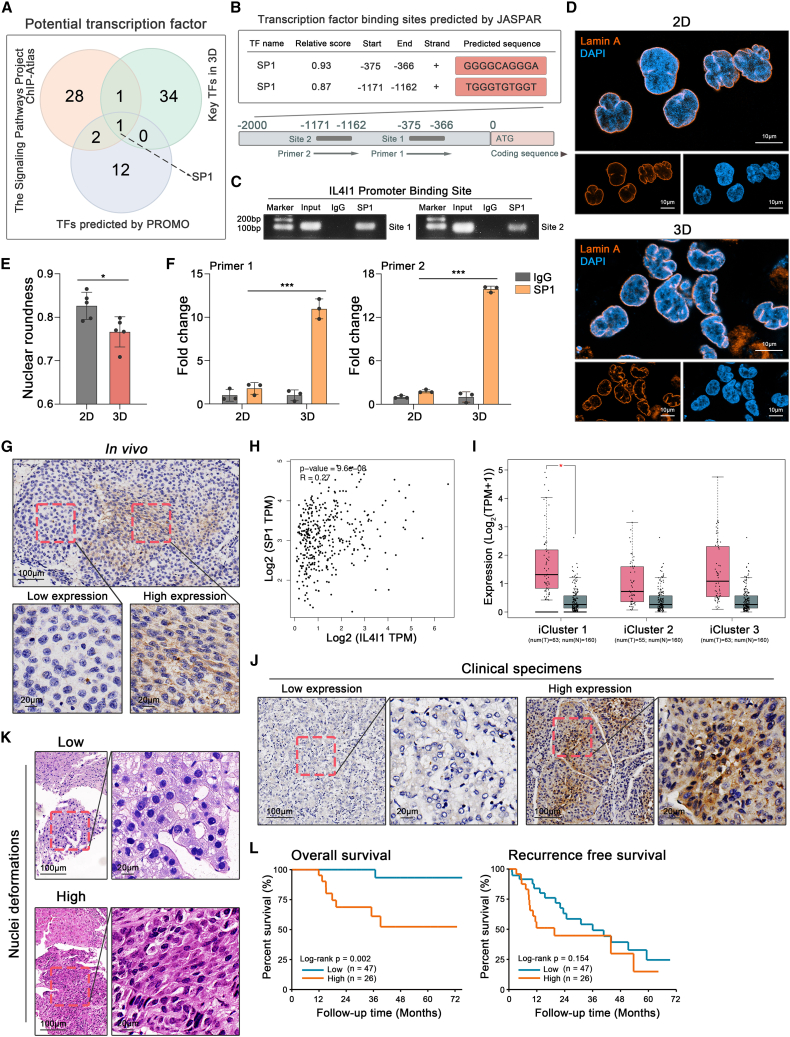
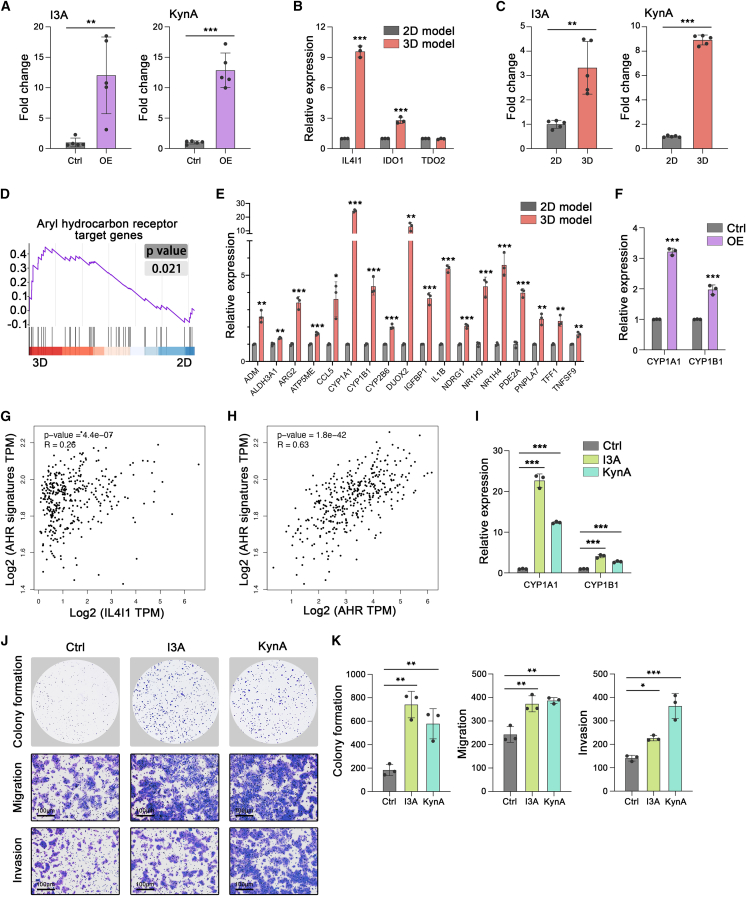
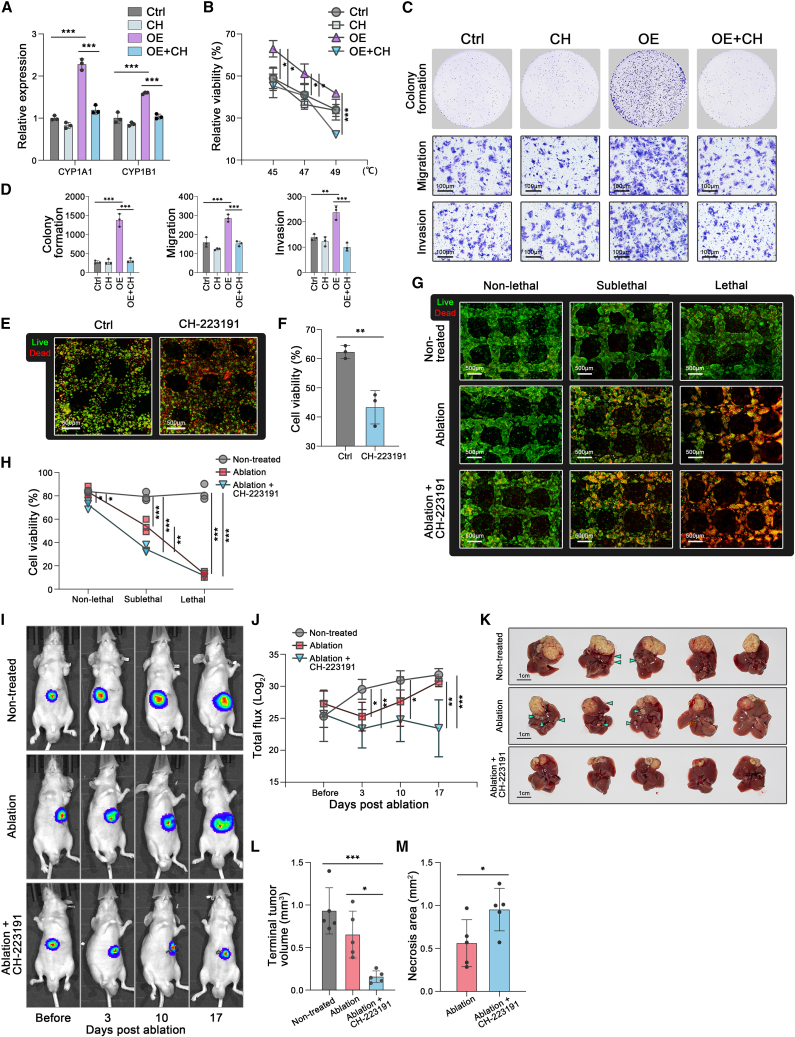
Mechanical stress can modulate the fate of cells in both physiological and extreme conditions. Recurrence of tumors after thermal ablation, a radical therapy for many cancers, indicates that some tumor cells can endure temperatures far beyond physiological ones. This unusual heat resistance with unknown mechanisms remains a key obstacle to fully realizing the clinical potential of thermal ablation. By developing a 3D bioprinting-based thermal ablation system, we demonstrate that hepatocellular carcinoma (HCC) cells in this 3D model exhibit enhanced heat resistance as compared with cells on plates. Mechanistically, the activation of transcription factor SP1 under mechanical confinement enhances the transcription of Interleukin-4-Induced-1, which catalyzes tryptophan metabolites to activate the aryl hydrocarbon receptor (AHR), leading to heat resistance. Encouragingly, the AHR inhibitor prevents HCC recurrence after thermal ablation. These findings reveal a previously unknown role of mechanical confinement in heat resistance and provide a rationale for AHR inhibitors as neoadjuvant therapy.

Keywords: heat resistance; hepatocellular carcinoma; mechanical confinement; nucleus deformations; tryptophan metabolism.


Conflict of interest statement

Declaration of interests The authors declare no competing interests.

Figures

None
Graphical abstract
Figure 1
Figure 1
3D bioprinted GCL construct (A) The schematic representation of the 3D thermal ablation model using the mixture of GCL hydrogel and HCC cell lines. (B) A photograph of a 3D bioprinted model with a grid-like structure. (C and D) Live/dead staining of MHCC-97H and quantifications in 3D model for days 1 and 7 (three biological replicates). (E) Schematic diagram and infrared imaging of orthotopic HCC tumor during thermal ablation for 30 s in BALB/C nude mice. (F) Picrosirius red staining of fibrillar collagen in the different regions of the tumor tissue after thermal ablation for 30 s. (G and H) The images and volume of GCL structure after different heat treatments for 15 min (three biological replicates). (I and J) Collagen hybridizing peptide staining of fibrillar collagen in the different regions of tumor tissue after thermal ablation for 30 s (five biological replicates). (K and L) SEM images of fibrillar collagen (red arrows) and quantifications in GCL structure after different heat treatments for 15 min (three biological replicates). (M) The stiffness of 3D (five biological replicates) and animal (10 biological replicates) models detected by nano-indentation under different temperatures. Mean ± standard deviation. Statistical analysis, one-way ANOVA for (D), (H), (J), (L), and (M, left), two-tailed Student’s t test for (M, right). n.s., not significant, ∗p < 0.05, ∗∗p < 0.01, ∗∗∗p < 0.001.
Figure 2
Figure 2
3D thermal ablation model (A) Orthotopic HCC tumor after thermal ablation for 30 s in BALB/C nude mice. Cell viability determined by NADH staining in the non-lethal, sublethal, and lethal regions of tumor tissue after thermal ablation for 30 s. (B) A long cuboid construct (25∗10∗0.8 mm3) for thermal ablation (left) monitored by infrared imaging (right). (C) Live/dead staining of MHCC-97H in the different regions of the 3D model after thermal ablation. (D) The distance from the lethal to the non-lethal region in 3D and animal models (five biological replicates). (E) Schematic diagram of a hyperthermal device (left) and its infrared imaging during operation for 15 min (right). (F and G) Live/dead staining of MHCC-97H and quantifications in the different regions under temperature gradients generated by the homemade hyperthermal device for 15 min (three biological replicates). (H) The bright field images and live/dead staining of spheroids (red arrows) in the 3D model with or without 49°C treatment for 15 min. (I) Immunofluorescence on the 3D model with or without 49°C treatment for 15 min and the animal thermal ablation model for N-cadherin (red), E-cadherin (red), F-Actin (green), and Hoechst (blue). (J) Immunohistochemistry staining of N-cadherin and E-cadherin from the animal thermal ablation model. (K) E-cadherin, N-cadherin, and MMP2 protein expression detected by western blot assay in the 3D model after different heat treatments. Mean ± standard deviation. Statistical analysis, two-tailed Student’s t test for (D), one-way ANOVA with post Tukey’s comparisons test for (G). n.s., not significant, ∗p < 0.05, ∗∗p < 0.01, ∗∗∗p < 0.001.
Figure 3
Figure 3
HCC endured high temperatures in the 3D model (A) Images of the monolayer growth of MHCC-97H in the 2D model (upper) and the spheroids generation of MHCC-97H in the 3D model (lower) on days 1, 3, 5, and 7 (three biological replicates). (B) Quantification of the diameters of spheroids in the 3D model on days 3, 5, and 7 (n = 5) (three biological replicates). (C) Immunofluorescence on MHCC-97H in 2D or 3D models during the logarithmic growth phase, stained for EdU (green) and Hoechst (blue) (three biological replicates). (D) Quantification of proliferative rates of MHCC-97H in 2D or 3D models on days 1, 3, 5, and 7 (n = 3) (three biological replicates). (E) Cell viability and LT50/LT90 fitted curves of MHCC-97H in the 2D model (left) and 3D model (right), respectively, detected by trypan blue staining and live/dead staining after different heat treatments for 15 min (37–57°C) (three biological replicates). (F) Cell viability of MHCC-97H in the 2D and 3D models after heat treatment of 51, 53, or 55°C. Mean ± standard deviation (three biological replicates). Statistical analysis, one-way ANOVA with post Tukey’s comparisons test for (B), two-tailed Student’s t test for (D), two-tailed Student’s t test with correction for multiple comparisons for (F). n.s., not significant, ∗p < 0.05, ∗∗p < 0.01.
Figure 4
Figure 4
IL4I1 promoted HCC survival after heat stress (A) RNA sequencing for MHCC-97H in 2D, 3D, and animal models (three biological replicates). (B) Upregulated genes in 3D and animal models, respectively, compared with the 2D model. (C) The KEGG enrichment of 95 overlapped genes. (D) Volcano plot of DEGs among “Metabolic pathways” in the 3D model versus 2D model. The names of 11 3D-specific metabolic genes are indicated in the plot. (E and F) qRT-PCR and western blot assay determining the IL4I1 expression of MHCC-97H in 2D and 3D models (three biological replicates). (G) Volcano plot of DEGs in HCC cells after heat stress compared with untreated control in the 3D model (three biological replicates). The names of 11 3D-specific metabolic genes are indicated in the plot. (H) Cell viability of MHCC-97H detected by trypan blue staining in different groups after heat treatments for 15 min (45°C, 47°C, and 49°C) (three biological replicates). (I and J) Representative images and quantification of the colony formation (4 × 103 cells/well), migration assay (1 × 105 cells/well), and invasion assay (1 × 105 cells/well) in IL4I1-overexpressed and control groups after 47°C treatment for 15 min (three biological replicates). Mean ± standard deviation. Statistical analysis, two-tailed Student’s t test for (E), (H), and (J). ∗∗p < 0.01, ∗∗∗p < 0.001.
Figure 5
Figure 5
SP1 activation increases IL4I1 expression under mechanical confinement (A) IL4I1 potential transcription factors in PROMO (purple circle), The Signaling Pathways Project (orange circle), and our data using TTRUST (green circle). (B) SP1 binding sites on IL4I1 promotor predicted by JASPAR database. (C) Validation of SP1 on IL4I1 promotor by ChIP-PCR (three biological replicates). (D) The immunofluorescence of nuclear morphology in 2D and 3D models, stained for Lamin A (orange) and DAPI (blue) (three biological replicates). (E) Quantification of nuclear roundness in 2D and 3D models (three biological replicates). (F) Putative SP1 binding sites on IL4I1 promotor detected by ChIP-qPCR assay in 2D and 3D models (three biological replicates). (G) IL4I1 expression in the orthotopic tumor of animal model detected by immunohistochemistry (IHC). (H) Correlation between IL4I1 and SP1 expression in TCGA HCC dataset. (I) IL4I1 expression of tumor tissues (red) and normal liver tissues (gray) in TCGA HCC cohort separated by iCluster 1, 2, and 3. (J) IL4I1 expression in human HCC specimens detected by IHC. (K) Low or high nucleus deformations showed by hematoxylin-eosin staining. (L) The Kaplan-Meier curve of overall survival and recurrence-free survival between low and high groups of nuclei deformations. Mean ± standard deviation. Statistical analysis, two-tailed Student’s t test for (E) and (F). ∗p < 0.05, ∗∗∗p < 0.001.
Figure 6
Figure 6
IL4I1-induced AHR activation promotes HCC survival after heat stress (A) Relative abundance of I3A and KynA in supernatants of Ctrl and IL4I1 MHCC-97H cells (4 days) (five biological replicates). (B) mRNA expression of IL4I1, IDO, and TDO2 in 2D and 3D models (three biological replicates). (C) Relative abundance of I3A and KynA in supernatants of MHCC-97H cells in the 2D and 3D models (4 days) (five biological replicates). (D) GSEA analysis of AHR pathway in the 3D model versus 2D model. (E) mRNA expression of AHR signature targets in 2D and 3D models (three biological replicates). (F) mRNA expression of CYP1A1 and CYP1B1 in IL4I1-overexpressed and control groups of MHCC-97H (three biological replicates). (G) Correlation between the expression of IL4I1 and AHR-targeted genes in TCGA HCC dataset. (H) Correlation between the expression of AHR and AHR-targeted genes in TCGA HCC dataset. (I) mRNA expression of CYP1A1 and CYP1B1 in MHCC-97H treated with I3A (50 μM) or KynA (250 μM) for 8 h (three biological replicates). (J and K) Representative images and quantification of the colony formation (4 × 103 cells/well), migration assay (1 × 105 cells/well), and invasion assay (1 × 105 cells/well) in MHCC-97H with or without I3A (50 μM) or KynA (250 μM) treatment for 8 h, following 47°C treatment for 15 min (three biological replicates). Mean ± standard deviation. Statistical analysis, two-tailed Student’s t test for (A), (B), (C), (E), and (F), one-way ANOVA with post Tukey’s comparisons test for (I) and (K). ∗p < 0.05, ∗∗p < 0.01, ∗∗∗p < 0.001.
Figure 7
Figure 7
AHR inhibition attenuated IL4I1-driven survival after thermal ablation for HCC (A) mRNA expression of CYP1A1 and CYP1B1 in control, CH-232191 (20 μM), IL4I1-overexpressed and IL4I1-overexpressed+CH-232191 (20 μM) groups of MHCC-97H (three biological replicates). (B) Cell viability of MHCC-97H detected by trypan blue staining in control, CH-232191 (20 μM), IL4I1-overexpressed, and IL4I1-overexpressed+CH-232191 (20 μM) groups after 47°C treatments for 15 min (45°C, 47°C, and 49°C) (three biological replicates). (C and D) Representative images and quantification of the colony formation (4 × 103 cells/well), migration assay (1 × 105 cells/well), and invasion assay (1 × 105 cells/well) in control, CH-232191 (20 μM), IL4I1-overexpressed, and IL4I1-overexpressed+CH-232191 (20 μM) groups of MHCC-97H after 47°C treatment for 15 min (three biological replicates). (E and F) Live/dead staining and quantification of the 3D model in control and CH-232191 (100 μM) groups after thermal ablation (three biological replicates). (G and H) Live/dead staining and quantification in the non-treatment, ablation monotherapy, and combined ablation and CH-223191 (100 μM) groups in the different regions treated with the hyperthermal device for 15 min (three biological replicates). (I and J) Tumor burden longitudinally monitored by IVIS imaging in the non-treatment, ablation monotherapy, and combined ablation and CH-223191 (10 mg/kg/d) groups (n = 5 mice/group). (K and M) Representative images, tumor volume, and intra-tumor necrosis area of dissected orthotopic HCC at the endpoint. Mean ± standard deviation. Statistical analysis, one-way ANOVA with post Tukey’s comparisons test for (A), (B), (D), (H), (J), and (L), two-tailed Student’s t test for (F) and (M). ∗p < 0.05, ∗∗p < 0.01, ∗∗∗p < 0.001.

Similar articles

Cited by

References

    1. Nader G.P.d.F., Agüera-Gonzalez S., Routet F., Gratia M., Maurin M., Cancila V., Cadart C., Palamidessi A., Ramos R.N., San Roman M., et al. Compromised nuclear envelope integrity drives TREX1-dependent DNA damage and tumor cell invasion. Cell. 2021;184:5230–5246.e22. doi: 10.1016/j.cell.2021.08.035. - DOI - PubMed
    1. Lomakin A.J., Cattin C.J., Cuvelier D., Alraies Z., Molina M., Nader G.P.F., Srivastava N., Sáez P.J., Garcia-Arcos J.M., Zhitnyak I.Y., et al. The nucleus acts as a ruler tailoring cell responses to spatial constraints. Science. 2020;370 doi: 10.1126/science.aba2894. - DOI - PMC - PubMed
    1. Denais C.M., Gilbert R.M., Isermann P., McGregor A.L., te Lindert M., Weigelin B., Davidson P.M., Friedl P., Wolf K., Lammerding J. Nuclear envelope rupture and repair during cancer cell migration. Science. 2016;352:353–358. doi: 10.1126/science.aad7297. - DOI - PMC - PubMed
    1. Stowers R.S., Shcherbina A., Israeli J., Gruber J.J., Chang J., Nam S., Rabiee A., Teruel M.N., Snyder M.P., Kundaje A., Chaudhuri O. Matrix stiffness induces a tumorigenic phenotype in mammary epithelium through changes in chromatin accessibility. Nat. Biomed. Eng. 2019;3:1009–1019. doi: 10.1038/s41551-019-0420-5. - DOI - PMC - PubMed
    1. Nava M.M., Miroshnikova Y.A., Biggs L.C., Whitefield D.B., Metge F., Boucas J., Vihinen H., Jokitalo E., Li X., García Arcos J.M., et al. Heterochromatin-Driven Nuclear Softening Protects the Genome against Mechanical Stress-Induced Damage. Cell. 2020;181:800–817.e22. doi: 10.1016/j.cell.2020.03.052. - DOI - PMC - PubMed

Publication types

MeSH terms