. 2023 Sep;22(9):100621.
doi: 10.1016/j.mcpro.2023.100621. Epub 2023 Jul 20.

Monitoring Both Extended and Tryptic Forms of Stable Isotope-Labeled Standard Peptides Provides an Internal Quality Control of Proteolytic Digestion in Targeted Mass Spectrometry-Based Assays

Affiliations

Monitoring Both Extended and Tryptic Forms of Stable Isotope-Labeled Standard Peptides Provides an Internal Quality Control of Proteolytic Digestion in Targeted Mass Spectrometry-Based Assays

Rachel A Lundeen et al. Mol Cell Proteomics. 2023 Sep.

Abstract

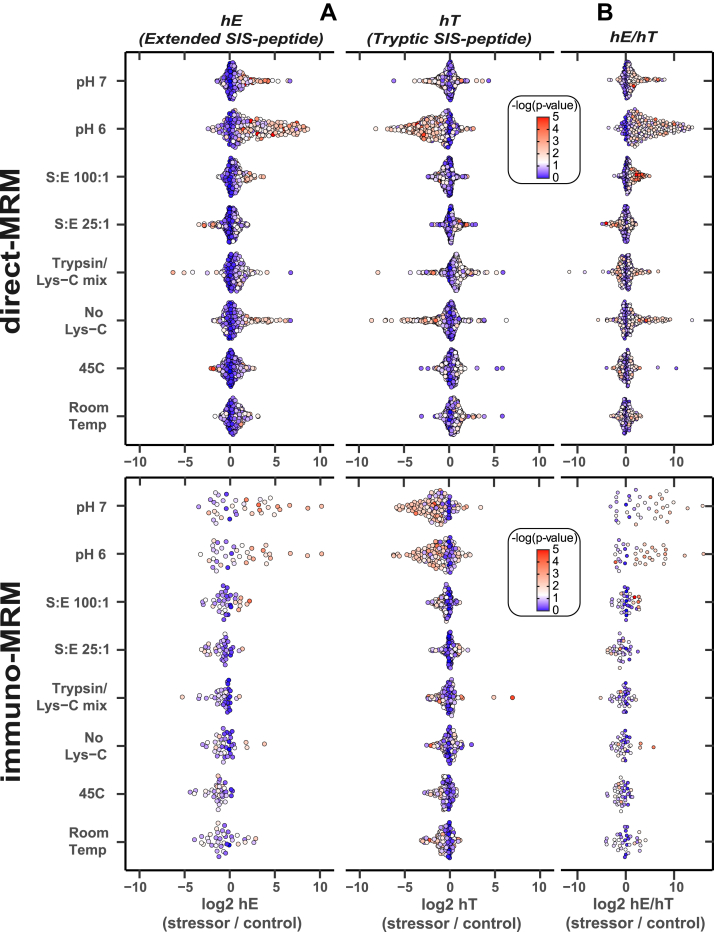
Targeted mass spectrometry (MS)-based proteomic assays, such as multiplexed multiple reaction monitoring (MRM)-MS assays, enable sensitive and specific quantification of proteotypic peptides as stoichiometric surrogates for proteins. Efforts are underway to expand the use of MRM-MS assays in clinical environments, which requires a reliable strategy to monitor proteolytic digestion efficiency within individual samples. Towards this goal, extended stable isotope-labeled standard (SIS) peptides (hE), which incorporate native proteolytic cleavage sites, can be spiked into protein lysates prior to proteolytic (trypsin) digestion, and release of the tryptic SIS peptide (hT) can be monitored. However, hT measurements alone cannot monitor the extent of digestion and may be confounded by matrix effects specific to individual patient samples; therefore, they are not sufficient to monitor sample-to-sample digestion variability. We hypothesized that measuring undigested hE, along with its paired hT, would improve detection of digestion issues compared to only measuring hT. We tested the ratio of the SIS pair measurements, or hE/hT, as a quality control (QC) metric of trypsin digestion for two MRM assays: a direct-MRM (398 targets) and an immuno-MRM (126 targets requiring immunoaffinity peptide enrichment) assay, with extended SIS peptides observable for 54% (216) and 62% (78) of the targets, respectively. We evaluated the quantitative bias for each target in a series of experiments that adversely affected proteolytic digestion (e.g., variable digestion times, pH, and temperature). We identified a subset of SIS pairs (36 for the direct-MRM, 7 for the immuno-MRM assay) for which the hE/hT ratio reliably detected inefficient digestion that resulted in decreased assay sensitivity and unreliable endogenous quantification. The hE/hT ratio was more responsive to a decrease in digestion efficiency than a metric based on hT measurements alone. For clinical-grade MRM-MS assays, this study describes a ready-to-use QC panel and also provides a road map for designing custom QC panels.

Keywords: clinical proteomics; immunoaffinity enrichment; quality control; quantification; targeted mass spectrometry; trypsin digestion.


Conflict of interest statement

Conflict of interest The authors declare no competing interests.

Figures

None
Graphical abstract
Fig. 1
Fig. 1
Experimental design characterizing proteolytic digestion efficiency by measuring extended stable isotope-labeled (SIS), tryptic SIS, and endogenous proteotypic peptides by direct-MRM and immuno-MRM. Extended SIS peptide standards spiked into protein lysates from human lymphoblast cell lines (LCLs), consisting of mock (untreated) and irradiated (10Gy IR) cells, were analyzed by immuno-MRM (500 μg protein input, 126 peptide targets) and direct-MRM (20 μg protein input, 398 peptide targets) assays. Schematic depicts example extended SIS peptides with amino acid color-coded circles: extended residues beyond the trypsin cleavage sites (lightblue), tryptic SIS sequence (white), potential post-translationally modified residues (PTM∗, dark blue), and fully labeled stable isotope residue (SIS∗, red). Along with a control digestion (pH 8 Tris, S/E 50, 37 °C for 16 h), two sets of experiments that affected digestion efficiency were conducted in triplicate: a trypsin digestion time course from 0 min to 21 h (across 10 time points) and digestion stressors, which varied temperature (room temperature or 45 °C), pH of Tris buffer (pH 6 or pH 7), protease used (no addition of Lys-C or a trypsin/Lys-C mix), or substrate-to-enzyme ratio used (S/E 25:1 or 100:1). After the digestion was quenched and desalted, the immuno-MRM targets were immunoaffinity enriched, and targets from both assays were analyzed separately by LC-MRM-MS. LC-MRM-MS analysis included conventional measurements of endogenous tryptic “light” and tryptic “heavy” SIS (hT) peptides as well as novel measurements of undigested, extended SIS (hE) peptides. LC, liquid chromatography; MRM, multiple reaction monitoring; MS, mass spectrometry.
Fig. 2
Fig. 2
Hydrolysis half-lives of extended SIS peptides calculated using apparent first order kinetic rate constants. Plot displaying individual extended SIS peptide hydrolysis half-lives or 50% hydrolyzed extended SIS peptides, as well as calculated times for extended SIS peptides to reach 75% or 95% hydrolyzed for direct-MRM and immuno-MRM targets. Hydrolysis or disappearance of extended SIS peptides across both assays were categorized as fast, medium, slow, or pre-digested by Lys-C (not included in plot) by rate constants calculated using apparent first order kinetics. Time (hours) displayed in logarithmic scale. Dotted references lines indicate conventional overnight proteolytic digestion times of >16 h or >24 h, with the 16-h time point defined as the control digestion. MRM, multiple reaction monitoring; SIS, stable isotope-labeled standard.
Fig. 3
Fig. 3
Swarm-volcano plots fromstressor experiments display significance of peak area fold change compared to control. The log2 fold change of peak areas from (A) individual extended SIS (hE) and tryptic SIS (hT) peptides or (B) the ratio of paired extended SIS to tryptic heavy (hE/hT) were calculated from the peak areas averaged across process triplicates in each stressor condition compared to the control digestion (16-h, non-stressed digestion condition). For the direct-MRM assay, 398 heavy tryptic and 216 extended SIS peptides were included in the analysis, and for the immuno-MRM assay, 126 heavy tryptic and 37 extended SIS peptides were included. Circles depict individual peptides in (A) and SIS pairs in (B). Circle color represents the negative log of the p-value, ranging from blue (non-significant) to red (significant), with white reflecting a p value of 0.05. MRM, multiple reaction monitoring; SIS, stable isotope-labeled standard.
Fig. 4
Fig. 4
QC metrics can identify samples with suboptimal endogenous sensitivity and quantification fidelity. For the (A) direct-MRM assay and (B) immuno-MRM assay, QC results across the whole QC panel of SIS pairs are displayed as pie charts in the “combined” row, represented as a percentage of pass/fail/marginal QC. Color coding of pie charts depicts failed QC (red) as an hE/hT value greater than three SDs from the mean of the control digestion (16-h, non-stressed digestion condition), passed QC (green) as an hE/hT less than two SDs from the mean, and marginal QC (yellow) as an hE/hT between two and three SDs from the mean. Assay endogenous sensitivity was calculated as the percentage of the endogenous peak area in the inefficient digestion condition compared to the control. Assay quantification fidelity was calculated as the relative percent difference of the light to heavy PAR in the inefficient digestion condition and the control. Endogenous signals are reported for 39 (out of 398) direct-MRM targets and 78 (out of 126) immuno-MRM targets that were measured above LLOQ. Box plots show median (line), interquartiles (box), and 5 to 95th percentile (whiskers). Horizontal dashed lines in the assay endogenous sensitivity plots represent 25% (red), 50% (yellow), and 75% (green) of the control, and the black dashed lines in the assay quantification fidelity plots represent ± 20% error compared to the control. Axes are consistent within each of the sensitivity and fidelity plots for both assay (A and B) results except for overlayed fidelity plots in (A) showing unconstrained y-axes. LLOQ, lower limit of quantification; MRM, multiple reaction monitoring; PAR, peak area ratio; SIS, stable isotope-labeled standard; QC, quality control.

References

    1. Picotti P., Bodenmiller B., Aebersold R. Proteomics meets the scientific method. Nat. Methods. 2013;10:24–27. - PubMed
    1. Gillette M.A., Carr S.A. Quantitative analysis of peptides and proteins in biomedicine by targeted mass spectrometry. Nat. Methods. 2013;10:28–34. - PMC - PubMed
    1. Zhang B., Whiteaker J.R., Hoofnagle A.N., Baird G.S., Rodland K.D., Paulovich A.G. Clinical potential of mass spectrometry-based proteogenomics. Nat. Rev. Clin. Oncol. 2019;16:256–268. - PMC - PubMed
    1. Neubert H., Shuford C.M., Olah T.V., Garofolo F., Schultz G.A., Jones B.R., et al. Protein biomarker quantification by immunoaffinity liquid chromatography-tandem mass spectrometry: current state and future vision. Clin. Chem. 2020;66:282–301. - PubMed
    1. Rodriguez H., Zenklusen J.C., Staudt L.M., Doroshow J.H., Lowy D.R. The next horizon in precision oncology: proteogenomics to inform cancer diagnosis and treatment. Cell. 2021;184:1661–1670. - PMC - PubMed

Publication types

LinkOut - more resources