. 2023 Aug 2;145(30):16557-16572.
doi: 10.1021/jacs.3c03578. Epub 2023 Jul 21.

Integrated NMR/Molecular Dynamics Determination of the Ensemble Conformation of a Thermodynamically Stable CUUG RNA Tetraloop

Affiliations

Integrated NMR/Molecular Dynamics Determination of the Ensemble Conformation of a Thermodynamically Stable CUUG RNA Tetraloop

Andreas Oxenfarth et al. J Am Chem Soc. .

Abstract

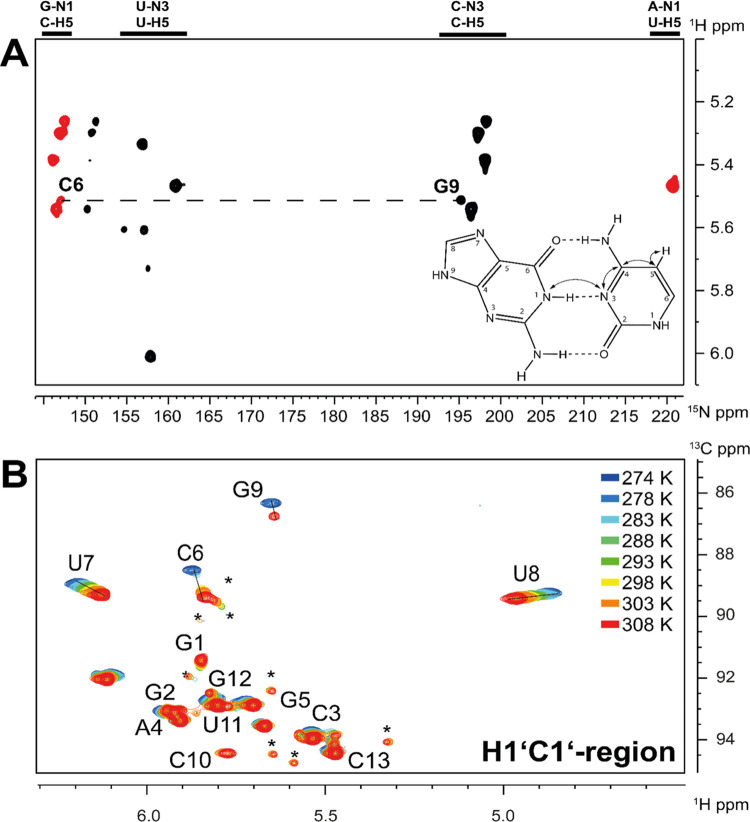
Both experimental and theoretical structure determinations of RNAs have remained challenging due to the intrinsic dynamics of RNAs. We report here an integrated nuclear magnetic resonance/molecular dynamics (NMR/MD) structure determination approach to describe the dynamic structure of the CUUG tetraloop. We show that the tetraloop undergoes substantial dynamics, leading to averaging of the experimental data. These dynamics are particularly linked to the temperature-dependent presence of a hydrogen bond within the tetraloop. Interpreting the NMR data by a single structure represents the low-temperature structure well but fails to capture all conformational states occurring at a higher temperature. We integrate MD simulations, starting from structures of CUUG tetraloops within the Protein Data Bank, with an extensive set of NMR data, and provide a structural ensemble that describes the dynamic nature of the tetraloop and the experimental NMR data well. We thus show that one of the most stable and frequently found RNA tetraloops displays substantial dynamics, warranting such an integrated structural approach.


Conflict of interest statement

The authors declare no competing financial interest.

Figures

Figure 1
Figure 1
Predicted stabilities for all 256 tetraloops in a 14 nts hairpin RNA with the indicated target sequence. Eight tetraloops are predicted to be stabilized by more than −8 kcal mol–1. The box plot covers all tetraloop sequences that are not shown in individual data points. ΔGs were predicted using the program mfold11. The stabilities of all 256 tetraloops with sequences 5′-ggcacXXXXgugcc-3′ were predicted (shown in black). In addition, the stabilities of all tetraloops with an inverted closing base pair (5′-ggcagXXXXcugcc-3′) were predicted (shown in red).
Figure 2
Figure 2
Overview of the dihedral angles in RNA.
Figure 3
Figure 3
Representative set of NMR spectra documenting the quality of the experimental data to extract structural information from torsion angle-dependent J-coupling constants, cross-correlated relaxation rates, NOEs, and residual dipolar couplings. If not stated otherwise, experimental data were measured at 308 K. (A) HNN-COSY was used to determine donor and acceptor nitrogen atoms involved in base pairs. (B) Aromatic and sugar region of 1H–1H-NOESY spectra. A larger version of the NOESY with annotated cross-peaks is shown in Figure S6. (C) Forward-directed HCC-TOCSY-CCH-E.COSY yields 3J(H,H) coupling constants for the ribose moieties of the nucleotides to determine torsion angles. Right of panel C, close-ups of examples of cross-peaks for stem and loop nucleotides are shown. (D) Cross- and reference spectra of the quantitative Γ-HCCH experiment yield cross-correlated relaxation rates to determine project angles of C–H dipolar vectors. From experimental data shown in panels C and D, the sugar pucker (pseudorotation phase and amplitude) was derived. (E) IPAP spectra from unaligned (isotropic) and phage-aligned (anisotropic) RNA samples yield 1D(C,H) residual dipolar couplings to determine C–H dipolar vector orientations.
Figure 4
Figure 4
Compilation of NMR restraints derived from the NMR parameters of the CUUG tetraloop. Panel (A) shows the canonical coordinates of the CUUG tetraloop determined from the 13C shifts of the ribose ring at 308 K. The x axis shows the pseudorotation phase P, while the y axis shows the γ angle. The entire loop nucleotide samples C2′-endo conformations, while stem nucleotides adapt C3′-endo conformations. Panel (B) shows the determination P based on the CCR. Red shows P determined from Γ(H1′C1′,H2′C2′)DD,DD, while the blue graph corresponds to Γ(H3′C3′,H4′C4′)DD,DD. The yellow graph shows the ratio of blue and red. For C6, a ratio could not be calculated since the Γ(H3′C3′,H4′C4′)DD,DD rate was outside of the possible parameter values, presumably due to too low signal-to-noise. (C) Derivation of the pseudorotation phase P based on the 3J(H1′,H2′) and 3J(H3′,H4′) couplings derived from the HCC-TOCSY-CCH-E.COSY experiment. 3J(H1′,H2′) couplings are shown in red, 3J(H3′,H4′) couplings are shown in blue, and 3J(H2′,H3′) couplings are shown in green. Panel (D) shows the Karplus-based determination of the ε angle of C3. The blue-colored graphs show the simulated 2J and 3J-couplings, while the red graph shows the lowest possible rmsJ for the angle C3. Panel (E) shows the determination of the angle χ based on CCR. The gray graph shows calculated values for χ for an S2 of 0.9. The red and blue graphs were generated using S2 values of 0.8 and 0.7, respectively. For all nucleotides except G9, the choice of the S2 value does not change the result of the determination of the angle χ. Panel (F) shows aromatic 1D(C,H) RDCs measured at 283 K (blue) and 308 K (red).
Figure 5
Figure 5
Experiments to detect the loop GC base pair at 308 K and temperature series of the C1′–H1′ region. (A) Spectra of the H(CC)NN-COSY experiment. The spectrum was measured at 308 K on a 13C, 15N CUUG 14mer sample in D2O. (B) the 1H13C-HSQC spectra were measured on the 13C, 15N CUUG 14mer sample in D2O from 278 to 308 K. All experiments were measured at 800 MHz. The asterisks indicate peaks originating from the low amount of duplex in the sample.
Figure 6
Figure 6
Comparison of simulation ensembles and structure bundles to experimental data. (A–D) Root-mean-squared-errors (RMSEs) between back-calculated and experimental (A) RDCs, (B) 3J-couplings, (C) CCRs, and (D) NOEs for the different ensembles and structure bundles. (E) Upper panel: experimental and back-calculated distributions of Γ(H1′C1′,H2′C2′)DD,DD and Γ(H3′C3′,H4′C4′)DD,DD CCRs of residue G5. Lower panel: distributions of the corresponding δ torsion angle. (F) Upper panel: RMSE in Hz between back-calculated and experimental measurements probing the δ torsion angle of residues G5 and C6 (i.e., CCRs: Γ(H1′C1′,H2′C2′)DD,DD, Γ(H3′C3′,H4′C4′)DD,DD; 3J-couplings: H1′H2′, H2′H3′, H3′H4′). Lower panel: C2′-endo population of residues G5 and C6. Asterisks mark values that are 0. Ensemble averages are shown as bars, while all NMR structures are shown individually (filled marker) with their respective average (nonfilled marker). Colors and markers are as follows: experimental (black square including errors), MD (dim-gray bars/solid line), MD+Exp (dark-gray bars/dashed line), bundle MD+Exp (lightgray bars/circles), bundle E (blue diamonds), bundle F (green hexagons), and 1RNG (red left-pointing triangles).
Figure 7
Figure 7
Structural analysis of the simulated ensembles and structure bundles. (A) Percentage of structures with the C6–G9 Watson–Crick base pair formed within MD ensembles and the different NMR structure bundles including the consensus structure 1RNG, as labeled. (B) U8–G9 outward stacking population and (C) U8–G9 upward stacking population. Asterisks mark values that are 0. (D–F) Structural representations of the three clusters after clustering the subsampled MD ensemble (bundle MD+Exp) with quality threshold clustering using the eRMSD metric. Loop residues C6 (blue), U7 (purple), U8 (pink), and G9 (salmon) are highlighted in color, and stem residues are gray. If shown, the 1RNG bundle is colored yellow. (G) eRMSD distribution within the cluster. (H) Average eRMSD of the MD starting structures to 1RNG (ref 1RNG), and error bars indicate the standard deviation over the five individual structures from 1RNG.
Figure 8
Figure 8
Comparison of the UUCG tetraloop and the CUUG MD subensemble. Dynamic secondary structure annotation following the Leontis–Westhof nomenclature and renders of the extended loop region (residues 5–10) of (A) 2KOC, (B) cluster 1, (C) cluster 2, and (D) cluster 3 from the subsampled MD ensemble. The color bar represents the population of each secondary structure element. In the renders, only the centroid structures are shown and residues are colored by base type (yellow, C; red, G; and turquoise, U). For each bundle or cluster, the most common hydrogen bonds are shown as blue dashed lines (>50% population).

References

    1. Al-Hashimi H. M.; Walter N. G. RNA Dynamics: It Is about Time. Curr. Opin. Struct. Biol. 2008, 18 (3), 321–329. 10.1016/j.sbi.2008.04.004. - DOI - PMC - PubMed
    1. Liu B.; Shi H.; Al-Hashimi H. M. Developments in Solution-State NMR Yield Broader and Deeper Views of the Dynamic Ensembles of Nucleic Acids. Curr. Opin. Struct. Biol. 2021, 70, 16–25. 10.1016/j.sbi.2021.02.007. - DOI - PMC - PubMed
    1. Rinnenthal J.; Buck J.; Ferner J.; Wacker A.; Fürtig B.; Schwalbe H. Mapping the Landscape of RNA Dynamics with NMR Spectroscopy. Acc. Chem. Res. 2011, 44 (12), 1292–1301. 10.1021/ar200137d. - DOI - PubMed
    1. Ferner J.; Villa A.; Duchardt E.; Widjajakusuma E.; Wöhnert J.; Stock G.; Schwalbe H. NMR and MD Studies of the Temperature-Dependent Dynamics of RNA YNMG-Tetraloops. Nucleic Acids Res. 2008, 36 (6), 1928–1940. 10.1093/nar/gkm1183. - DOI - PMC - PubMed
    1. Koplin J.; Mu Y.; Richter C.; Schwalbe H.; Stock G. Structure and Dynamics of an RNA Tetraloop: A Joint Molecular Dynamics and NMR Study. Structure 2005, 13 (9), 1255–1267. 10.1016/j.str.2005.05.015. - DOI - PubMed

Publication types