. 2023 Jul;11(7):e006948.
doi: 10.1136/jitc-2023-006948.

IgA antibody immunotherapy targeting GD2 is effective in preclinical neuroblastoma models

Affiliations

IgA antibody immunotherapy targeting GD2 is effective in preclinical neuroblastoma models

Marjolein C Stip et al. J Immunother Cancer. 2023 Jul.

Abstract

Background: Immunotherapy targeting GD2 is very effective against high-risk neuroblastoma, though administration of anti-GD2 antibodies induces severe and dose-limiting neuropathic pain by binding GD2-expressing sensory neurons. Previously, the IgG1 ch14.18 (dinutuximab) antibody was reformatted into the IgA1 isotype, which abolishes neuropathic pain and induces efficient neutrophil-mediated antibody-dependent cellular cytotoxicity (ADCC) via activation of the Fc alpha receptor (FcαRI/CD89).

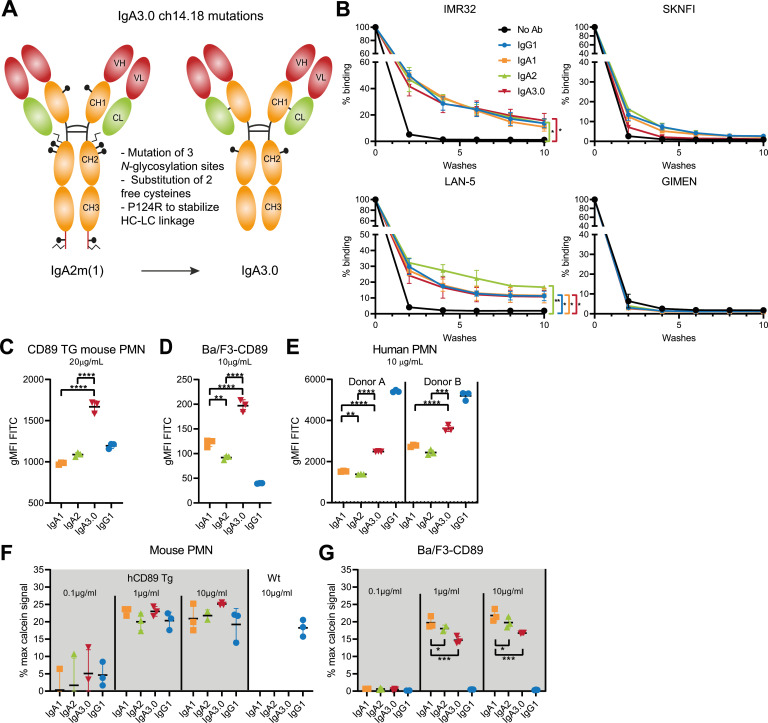
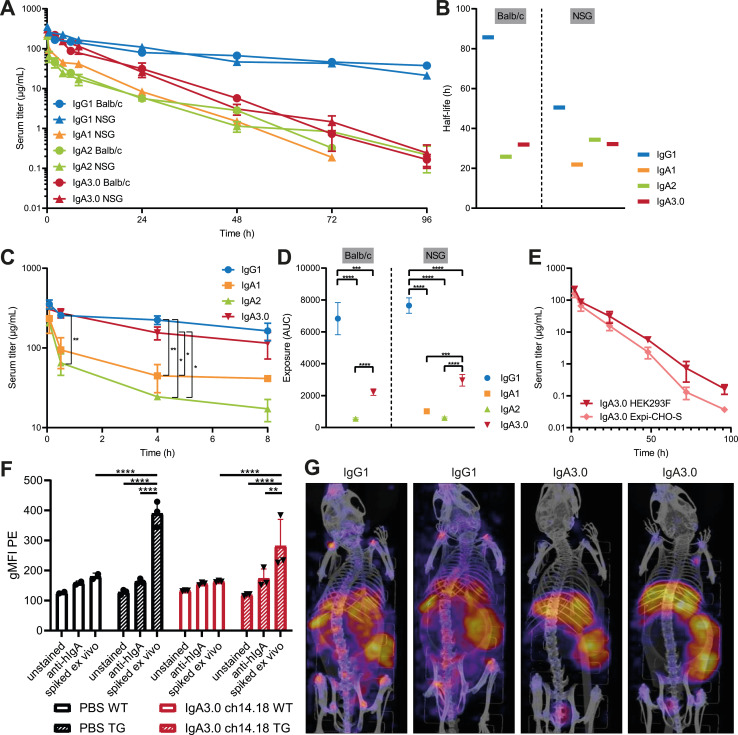
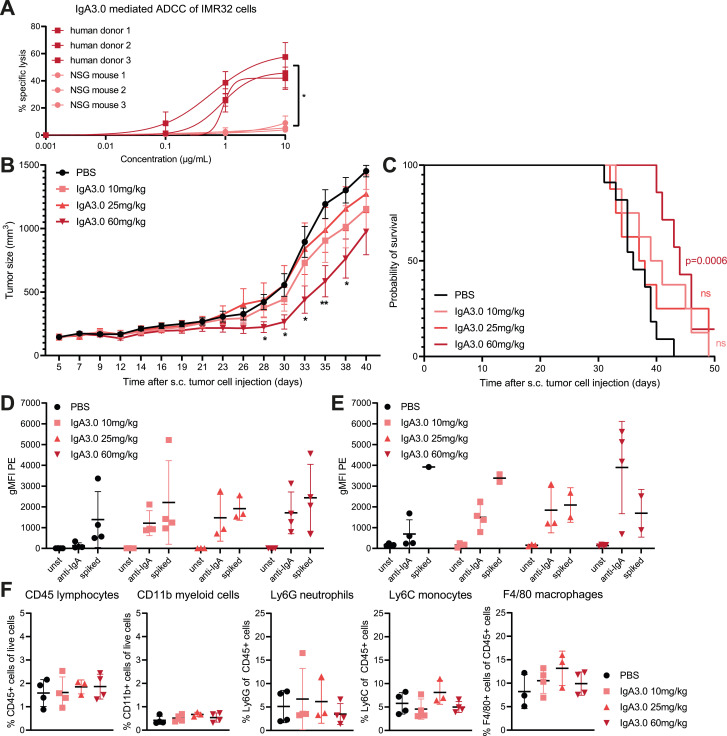
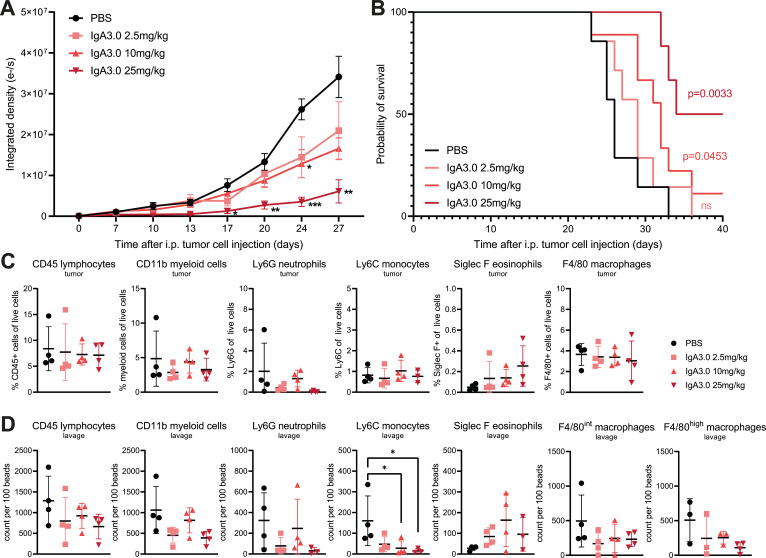
Methods: To generate an antibody suitable for clinical application, we engineered an IgA molecule (named IgA3.0 ch14.18) with increased stability, mutated glycosylation sites and substituted free (reactive) cysteines. The following mutations were introduced: N45.2G and P124R (CH1 domain), C92S, N120T, I121L and T122S (CH2 domain) and a deletion of the tail piece P131-Y148 (CH3 domain). IgA3.0 ch14.18 was evaluated in binding assays and in ADCC and antibody-dependent cellular phagocytosis (ADCP) assays with human, neuroblastoma patient and non-human primate effector cells. We performed mass spectrometry analysis of N-glycans and evaluated the impact of altered glycosylation in IgA3.0 ch14.18 on antibody half-life by performing pharmacokinetic (PK) studies in mice injected intravenously with 5 mg/kg antibody solution. A dose escalation study was performed to determine in vivo efficacy of IgA3.0 ch14.18 in an intraperitoneal mouse model using 9464D-GD2 neuroblastoma cells as well as in a subcutaneous human xenograft model using IMR32 neuroblastoma cells. Binding assays and PK studies were compared with one-way analysis of variance (ANOVA), ADCC and ADCP assays and in vivo tumor outgrowth with two-way ANOVA followed by Tukey's post-hoc test.

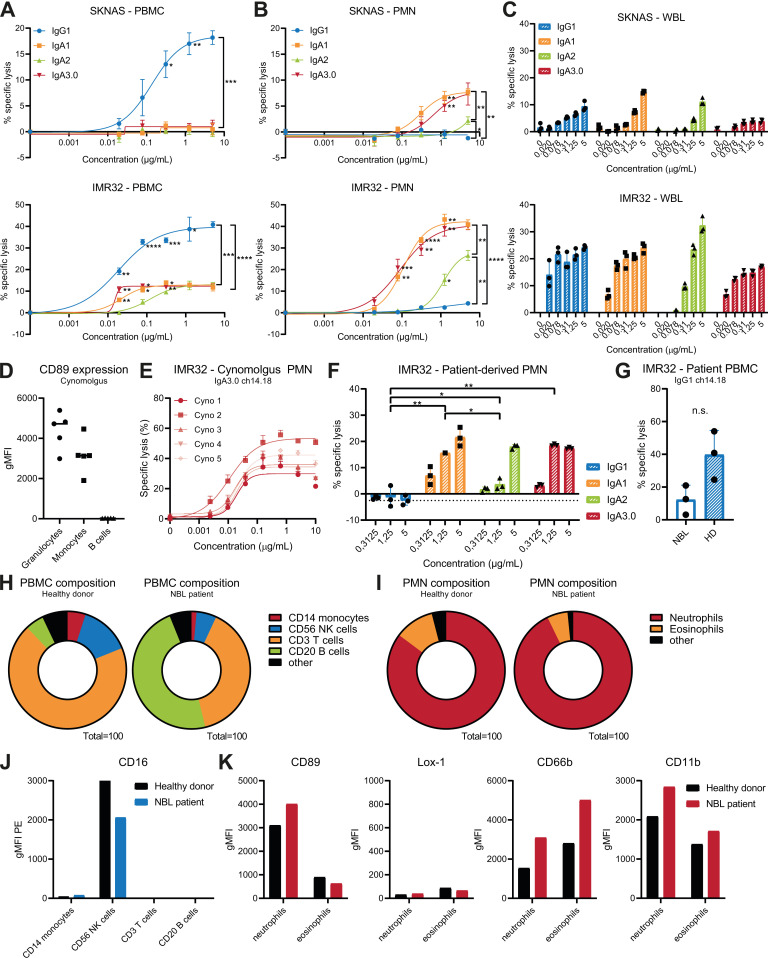
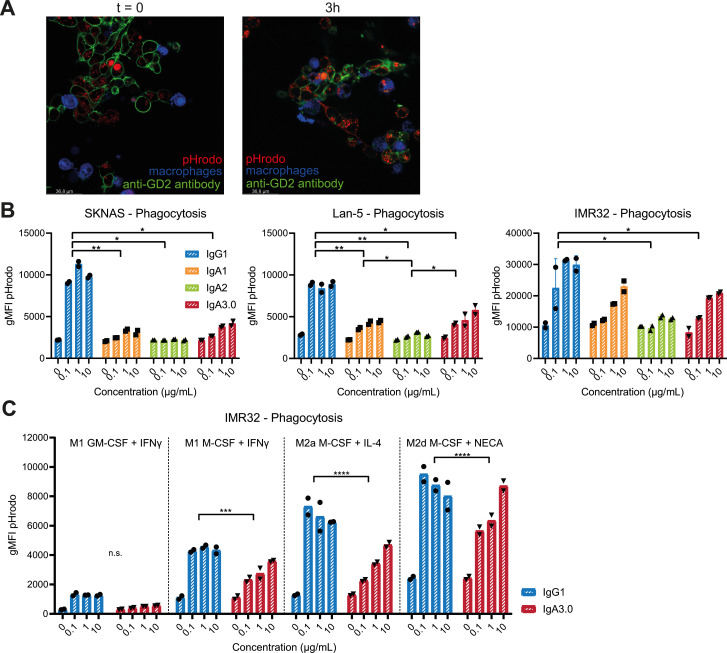
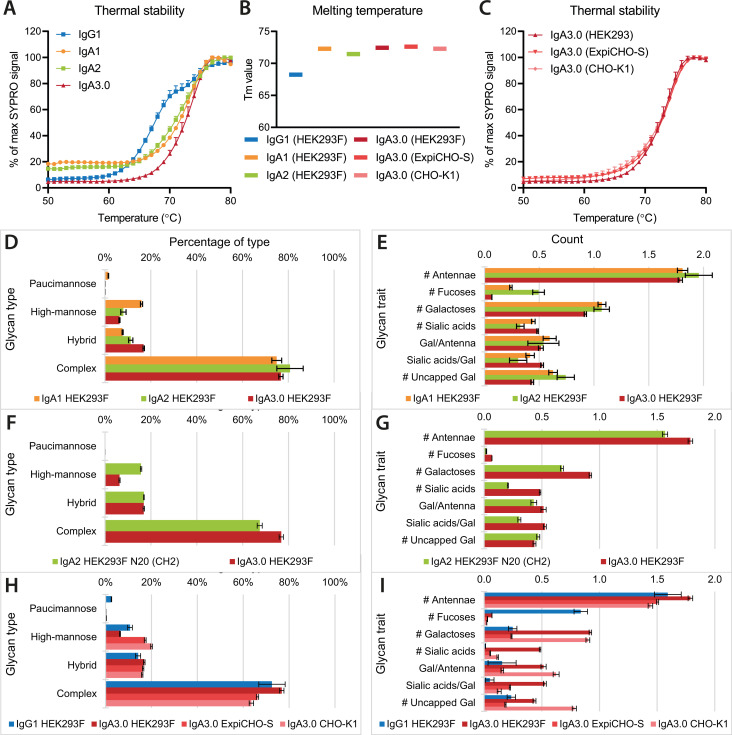
Results: ADCC and ADCP assays showed that particularly neutrophils and macrophages from healthy donors, non-human primates and patients with neuroblastoma are able to kill neuroblastoma tumor cells efficiently with IgA3.0 ch14.18. IgA3.0 ch14.18 contains a more favorable glycosylation pattern, corresponding to an increased antibody half-life in mice compared with IgA1 and IgA2. Furthermore, IgA3.0 ch14.18 penetrates neuroblastoma tumors in vivo and halts tumor outgrowth in both 9464D-GD2 and IMR32 long-term tumor models.

Conclusions: IgA3.0 ch14.18 is a promising new therapy for neuroblastoma, showing (1) increased half-life compared to natural IgA antibodies, (2) increased protein stability enabling effortless production and purification, (3) potent CD89-mediated tumor killing in vitro by healthy subjects and patients with neuroblastoma and (4) antitumor efficacy in long-term mouse neuroblastoma models.

Keywords: Antibody Glycosylation; Antibody Immunotherapy; GD-2; IgA; Neuroblastoma; Neutrophils; Tumor Immunology.


Conflict of interest statement

Competing interests: JL and MdB are co-founder of TigaTx and JL is principal investigator on a research collaboration partially funded by TigaTx. ME, MN, ES, MJ and GvT were (partially) employed by TigaTx during the project and SK and RR are/were employed by Milabs. JL, GvT, ME are inventors on patent applications WO2019059771 and WO2020197400.

Figures

Figure 1
Figure 1
Characterization of IgA3.0 ch14.18 target (Fab) and Fc binding. (A) Description of mutations in the IgA3.0 molecule compared to the original IgA2m(1) antibody. (B) Target-specific binding was measured by incubating calcein-labeled neuroblastoma cells on antibody-coated plates and measuring residual fluorescence after several washes. Binding was compared using a Repeated Measurements one-way ANOVA. Monomeric Fc-binding to CD89 was assessed by incubating ch14.18 antibodies with (C) CD89 transgenic mouse neutrophils, (D) Ba/F3-CD89 cells or (E) human PMN followed by detection with FITC anti-human kappa antibody. Binding of complexed IgA to CD89 was assessed by incubating calcein-labeled (F) CD89 transgenic mouse neutrophils or (G) Ba/F3-CD89 cells on antibody-coated plates and measuring remaining fluorescence after 10 washes. Monomeric binding was compared using a one-way and complexed binding using a two-way ANOVA. Data as shown are mean±SD, n=3 for all experiments. GD2 binding experiments were repeated five times, CD89 binding experiments were repeated twice. *p<0.05, **p<0.01, ***p<0.001 and ****p<0.0001. ANOVA, analysis of variance; FITC, fluorescein isothiocyanate; hCD89 Tg, human CD89 transgenic mice; PMN, polymorphonuclear leukocytes; Wt, wild type mice.
Figure 2
Figure 2
IgA3.0-mediated ADCC is similar to IgA1 and superior to IgA2. Efficiency of antibodies in inducing ADCC against neuroblastoma target cells in 51Cr-release assays with either (A) PBMC, (B) PMN or (C) WBL as effector cells. ADCCs were compared using two-way ANOVA. (D) Flow cytometry analysis of CD89 expression on cynomolgus leukocytes. (E) 51Cr-release assays with cynomolgus PMN as effector cells against IMR32 cells. (F) 51Cr-release assays with neuroblastoma patient PMN against IMR32 cells. Dotted line is the no antibody background. Means were compared using two-way ANOVA. (G) 51Cr-release assays with neuroblastoma patient PBMC and healthy donor PBMC from three different donors/patients against IMR32 cells. Means were compared using a paired t-test. (H) PBMC and (I) PMN composition in healthy donor and neuroblastoma patient blood. (J) CD16 expression in healthy donor and neuroblastoma patient blood. (K) Expression of neutrophil activation markers in healthy donor and neuroblastoma patient blood. Data as shown are mean±SD, n=3 for all ADCC assays. Healthy donor and patient ADCCs were performed three times and cynomolgus ADCC once. *p<0.05, **p<0.01, ***p<0.001 and ****p<0.0001. ADCC, antibody-dependent cell-mediated cytotoxicity; ANOVA, analysis of variance; gMFI, geometric mean fluorescence intensity; NBL, neuroblastoma; NK, natural killer; PBMC, peripheral blood mononuclear cells; PE, phycoerythrin; PMN, polymorphonuclear leukocytes; WBL, whole blood leukocytes.
Figure 3
Figure 3
IgA3.0 ch14.18 induces ADCP in both M0, M1 and M2 macrophages. (A) Confocal images before and after 3 hours incubation of pHrodo-labeled target cells with FITC-labeled anti-GD2 antibody and CTV-labeled macrophages. (B) The efficiency of antibodies in inducing phagocytosis against pHrodo-labeled human neuroblastoma target cells by M-CSF-differentiated, monocyte-derived macrophages as effector cells. (C) The efficiency of antibodies in inducing phagocytosis by macrophages polarized with IFN-γ, IL-4, or 5 µM NECA. Antibodies were compared using two-way ANOVA. Data as shown are means, n=2. Phagocytosis assays were performed twice. *p<0.05, **p<0.01, ***p<0.001 and ****p<0.0001. ADCP, antibody-dependent cell-mediated phagocytosis; ANOVA, analysis of variance; CTV, CellTrace Violet; FITC, fluorescein isothiocyanate; GM-CSF, granulocyte-macrophage colony-stimulating factor, gMFI, geometric mean fluorescence intensity; IFN, interferon; IL, interleukin; M-CSF, macrophage colony-stimulating factor.
Figure 4
Figure 4
IgA3.0 mutations result in improved stability and in a favorable glycosylation pattern. (A) Sypro orange thermal shift assays for ch14.18 antibody variants. (B) Tm values as calculated by transforming temperature values to log(10) followed by non-linear regression on the transformed data from thermal shift assays. (C) Sypro orange thermal shift assays for ch14.18 IgA3.0 produced in different production cell lines. Mass spectrometry analysis (D, E) of overall glycosylation in IgA ch14.18 variants, (F, G) of glycosylation at the N20 site in the CH2 domain and (H, I) of glycosylation of IgA3.0 ch14.18 produced in HEK293F, Expi-CHO-S or CHO-K1. Data as shown are mean±SD, n=3.
Figure 5
Figure 5
PK and biodistribution studies for ch14.18 antibody isotypes in Balb/c and NSG mice. (A) CD89 transgenic Balb/c and NSG mice were injected i.v. with 5 mg/kg antibody solution (HEK293F produced) and serum concentrations over time were determined using ELISA on blood samples collected from the submandibular vein. (B) Half-life values calculated for the elimination phase (24–96 hour). (C) Distribution phase of the ch14.18 antibody variants. A mixed models analysis was performed on 30 min, 4-hour and 8-hour time points. (D) Cumulative antibody exposure in NSG mice as calculated by AUC analysis. AUC was compared with one-way ANOVA analysis. (E) Serum concentrations in Balb/c mice over time after i.v. injection of 5 mg/kg HEK293F produced and Expi-CHO-S produced IgA3.0 ch14.18. Means were compared using a mixed models analysis. (F) Circulating neutrophils of mice treated with PBS or 25 mg/kg IgA3.0 ch14.18 were isolated, incubated ex vivo with IgA3.0 ch14.18 and/or stained with PE-labeled anti-hIgA antibodies to determine monomeric CD89 binding. (G) Overlay of SPECT/CT scans displaying the biodistribution after 24 hours of 111In-labeled ch14.18 antibodies in CD89 transgenic mice bearing an IMR32 neuroblastoma tumor. Data as shown are mean±SD, n=3 for PK studies and monomeric binding, n=2 for biodistribution scans. * as p<0.05, ** as p<0.01, *** as p<0.001 and **** as p<0.0001. AUC, area under the curve; CHO, Chinese hamster ovarian cells; gMFI, geometric mean fluorescence intensity; HEK293F cells, human293 cells; NSG, NOD SCID gamma mice; PBS, phosphate-buffered saline, PE, phycoerythrin; TG, transgenic mice; WT, wild type mice.
Figure 6
Figure 6
Subcutaneous IMR32 tumor outgrowth in NSG mice is halted by IgA3.0 ch14.18. (A) Comparison of human PMN and NSG mouse neutrophil ADCC against neuroblastoma target cells with IgA3.0 ch14.18 in 51Cr-release assays. (B) NSG mice were injected s.c. with 2.5×10⁶ IMR32 tumor cells and treated thrice a week with PBS or increasing dosages of IgA3.0 ch14.18 from day 5 onwards. Tumor outgrowth was measured thrice a week until the end point (tumor size of 1500 mm3) was reached. Tumor sizes were compared using a two-way ANOVA. Asterisks indicate significance compared with PBS control group. (C) Kaplan-Meier curve of tumor-specific survival. Log-rank test for trend p=0.0092. PBS/ IgA3.0 10 mg/kg ns, PBS/IgA3.0 25 mg/kg ns, PBS 60 mg/kg p=0.0006 (log-rank test). Single-cell suspensions derived from IMR32 tumors were stained with anti-hIgA antibodies to determine (D) tumor cell opsonization and (E) Fc-mediated, cytophilic binding to intratumoral neutrophils by flow cytometry. (F) Immune cell composition of IMR32 tumors at the end point was determined by flow cytometry on tumor single cell suspension. PBS and treatment groups were compared with one-way ANOVA. Data as shown are mean±SEM for tumor measurements and mean±SD for flow cytometry data. N=10 for PBS, n=8 for 10 mg/kg and 25 mg/kg and n=7 for 60 mg/kg. *p<0.05, **p<0.01, ***p<0.001 and ***p<0.0001. ADCC, antibody-dependent cell-mediated cytotoxicity; ANOVA, analysis of variance; gMFI, geometric mean fluorescence intensity; NSG, NOD SCID gamma mice; PBS, phosphate-buffered saline; PE, phycoerythrin; PMN, polymorphonuclear leukocytes; s.c., subcutaneous; Unst, unstained.
Figure 7
Figure 7
IgA3.0 ch14.18 is reducing outgrowth of intraperitoneal 9464D-GD2 tumors. Tumor outgrowth was measured twice a week until the end point (BLI signal of 30×106) was reached. (A) Tumor sizes were compared using a mixed-effects model analysis. Asterisks indicate significance compared with PBS control group. (B) Kaplan-Meier curve of tumor-specific survival. Log-rank test for trend p=0.0002. PBS/ IgA3.0 2.5 mg/kg ns, PBS/IgA3.0 10 mg/kg 0.0453, PBS 25 mg/kg p=0.0033 (log-rank test). Immune cell composition of (C) 9464D-GD2 tumors (D) and peritoneal lavage at the end point was determined by flow cytometry analysis on single cell suspension. PBS and treatment groups were compared with one-way ANOVA. Data as shown are mean±SEM for tumor measurements and mean±SD for flow cytometry data. N=7 for PBS, n=8 for 2.5 mg/kg, n=9 for 10 mg/kg and n=6 for 60 mg/kg. *p<0.05, **p<0.01, ***p<0.001 and ****p<0.0001. ANOVA, analysis of variance; BLI, bioluminescence imaging; i.p., intraperitoneal; PBS, phosphate-buffered saline.

References

    1. De Preter K, Vandesompele J, Heimann P, et al. . Human fetal neuroblast and neuroblastoma transcriptome analysis confirms neuroblast origin and highlights neuroblastoma candidate genes. Genome Biol 2006;7:R84. 10.1186/gb-2006-7-9-r84 - DOI - PMC - PubMed
    1. Matthay KK, Villablanca JG, Seeger RC, et al. . Treatment of high-risk neuroblastoma with intensive chemotherapy, radiotherapy, autologous bone marrow transplantation, and 13-cis-retinoic acid. N Engl J Med 1999;341:1165–73. 10.1056/NEJM199910143411601 - DOI - PubMed
    1. Berthold F, Boos J, Burdach S, et al. . Myeloablative megatherapy with autologous stem-cell rescue versus oral maintenance chemotherapy as consolidation treatment in patients with high-risk neuroblastoma: a randomised controlled trial. Lancet Oncol 2005;6:649–58. 10.1016/S1470-2045(05)70291-6 - DOI - PubMed
    1. Yu AL, Gilman AL, Ozkaynak MF, et al. . Anti-GD2 antibody with GM-CSF, interleukin-2, and isotretinoin for neuroblastoma. N Engl J Med 2010;363:1324–34. 10.1056/NEJMoa0911123 - DOI - PMC - PubMed
    1. Mueller I, Ehlert K, Endres S, et al. . Tolerability, response and outcome of high-risk neuroblastoma patients treated with long-term infusion of anti-GD2 antibody Ch14.18/CHO. MAbs 2018;10:55–61. 10.1080/19420862.2017.1402997 - DOI - PMC - PubMed

Publication types