. 2023 Jul 21;11(1):39.
doi: 10.1038/s41413-023-00272-x.

Tppp3+ synovial/tendon sheath progenitor cells contribute to heterotopic bone after trauma

Affiliations

Tppp3+ synovial/tendon sheath progenitor cells contribute to heterotopic bone after trauma

Ji-Hye Yea et al. Bone Res. .

Abstract

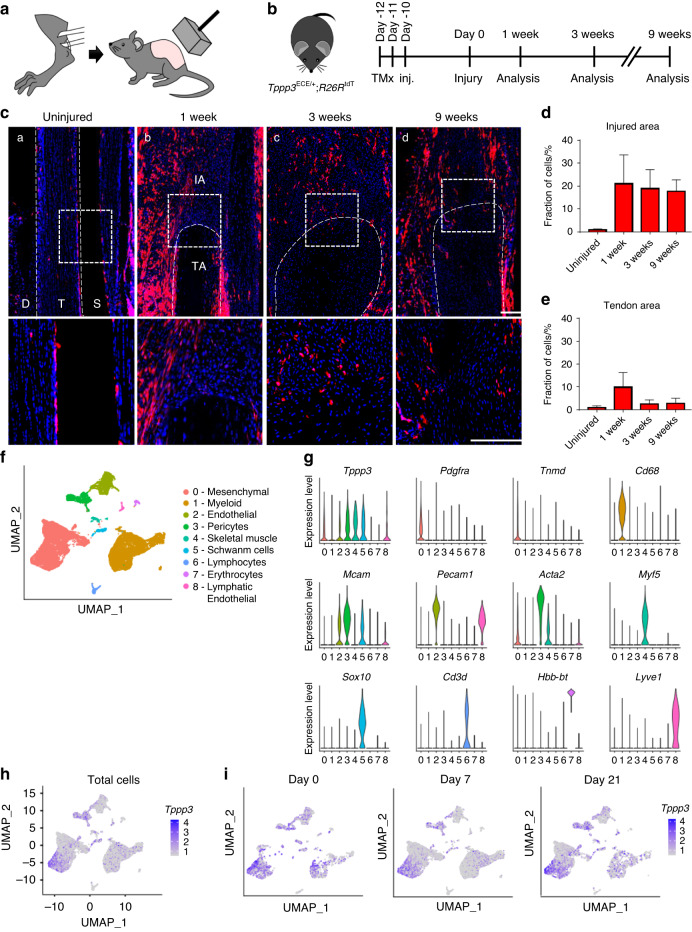
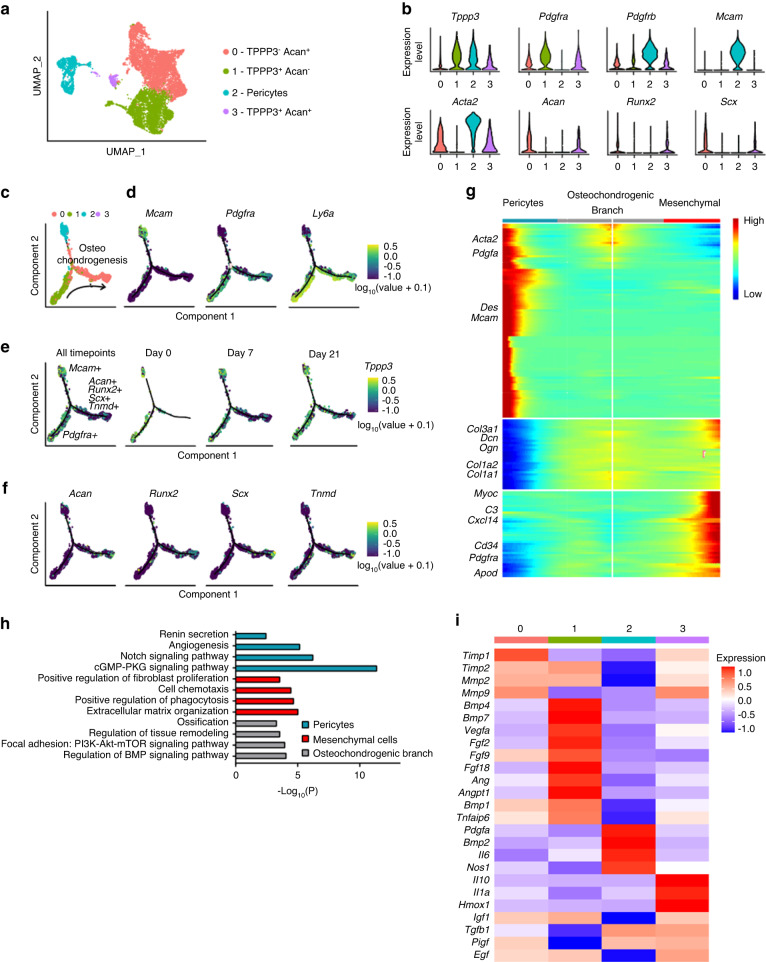
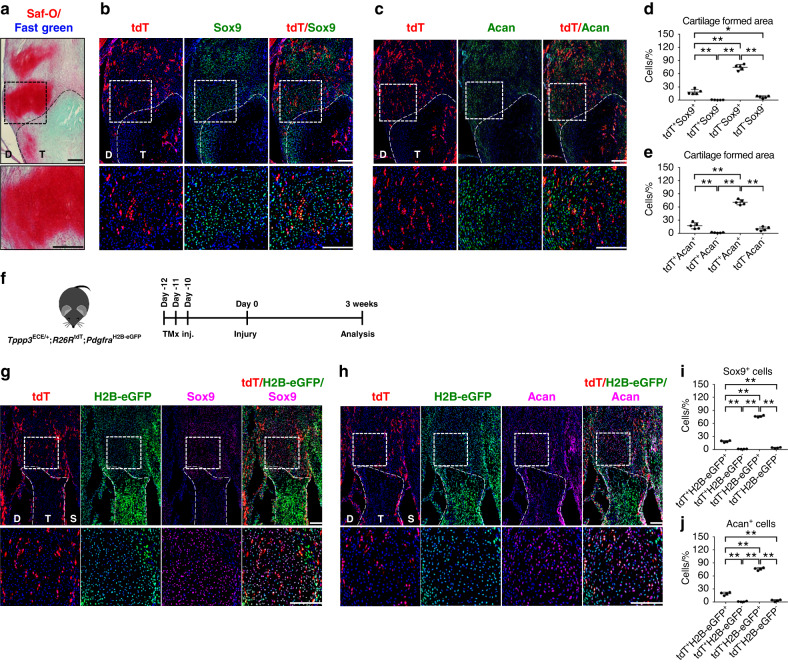
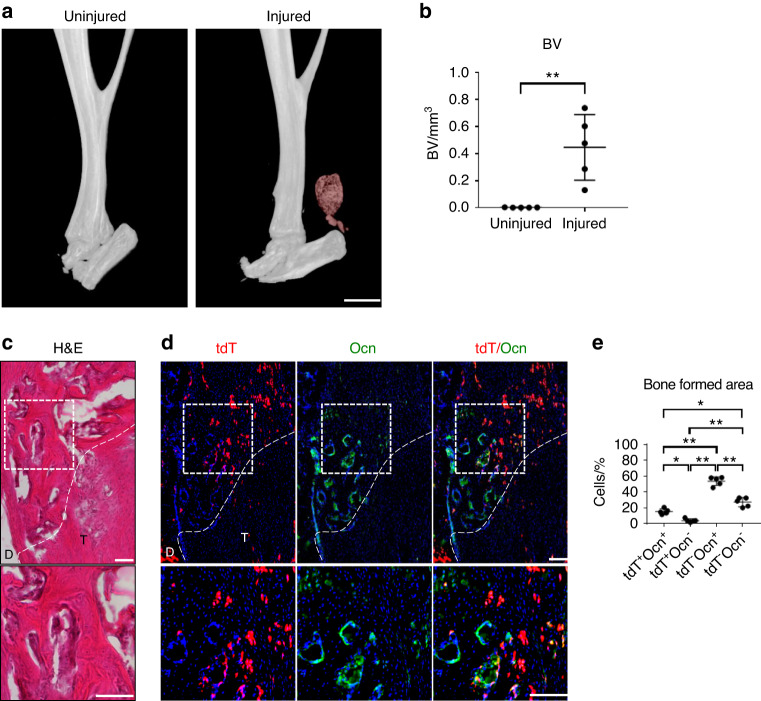
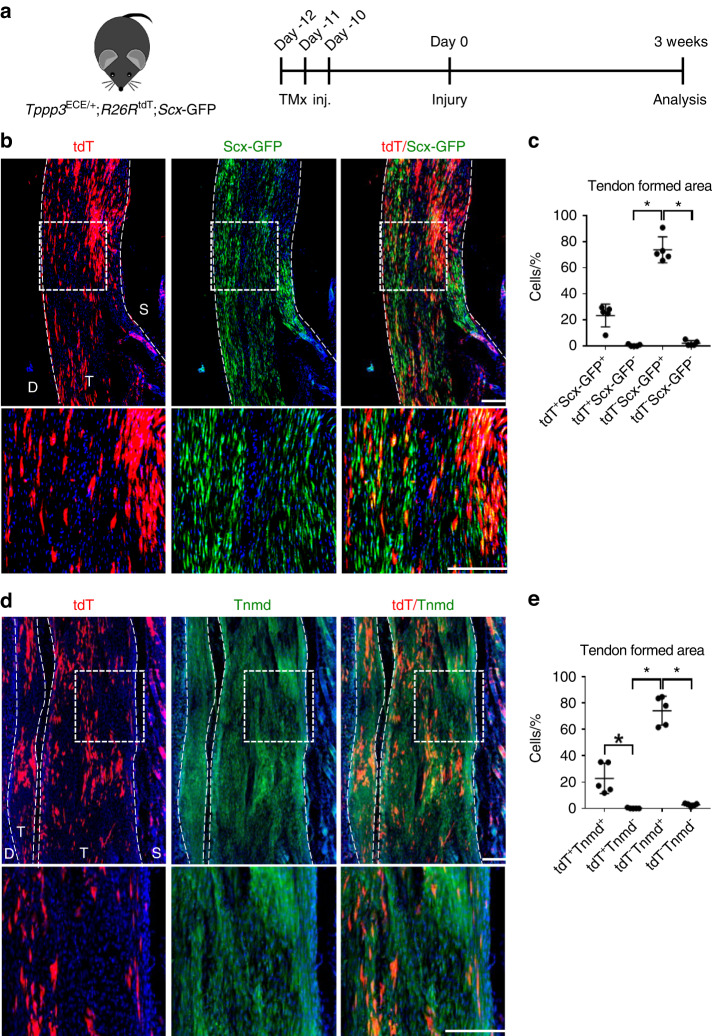
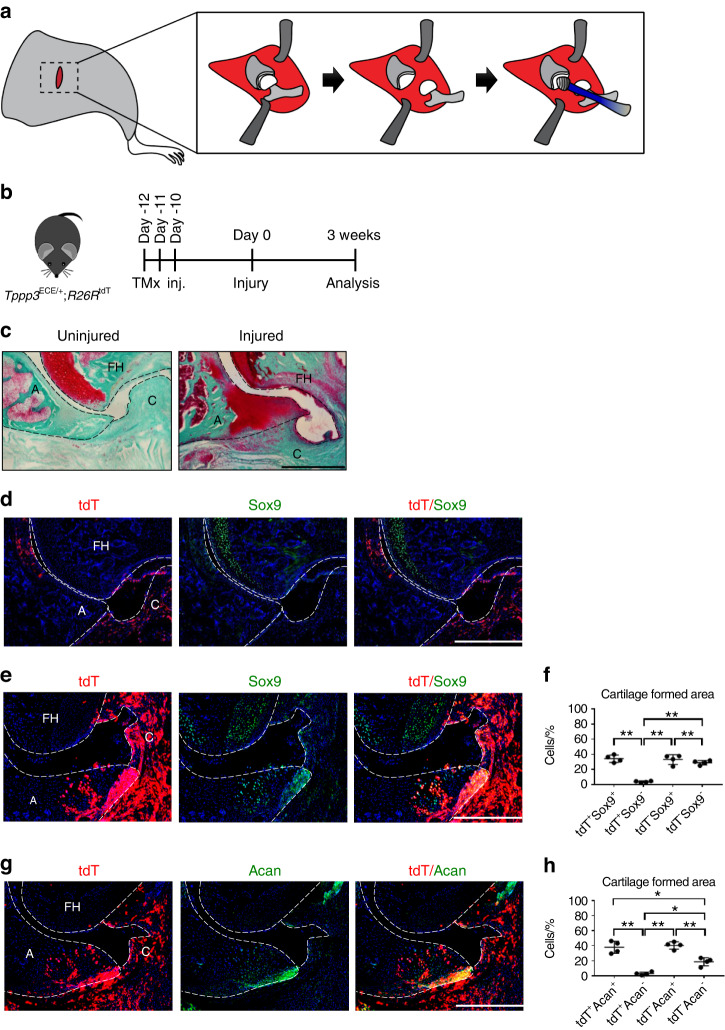
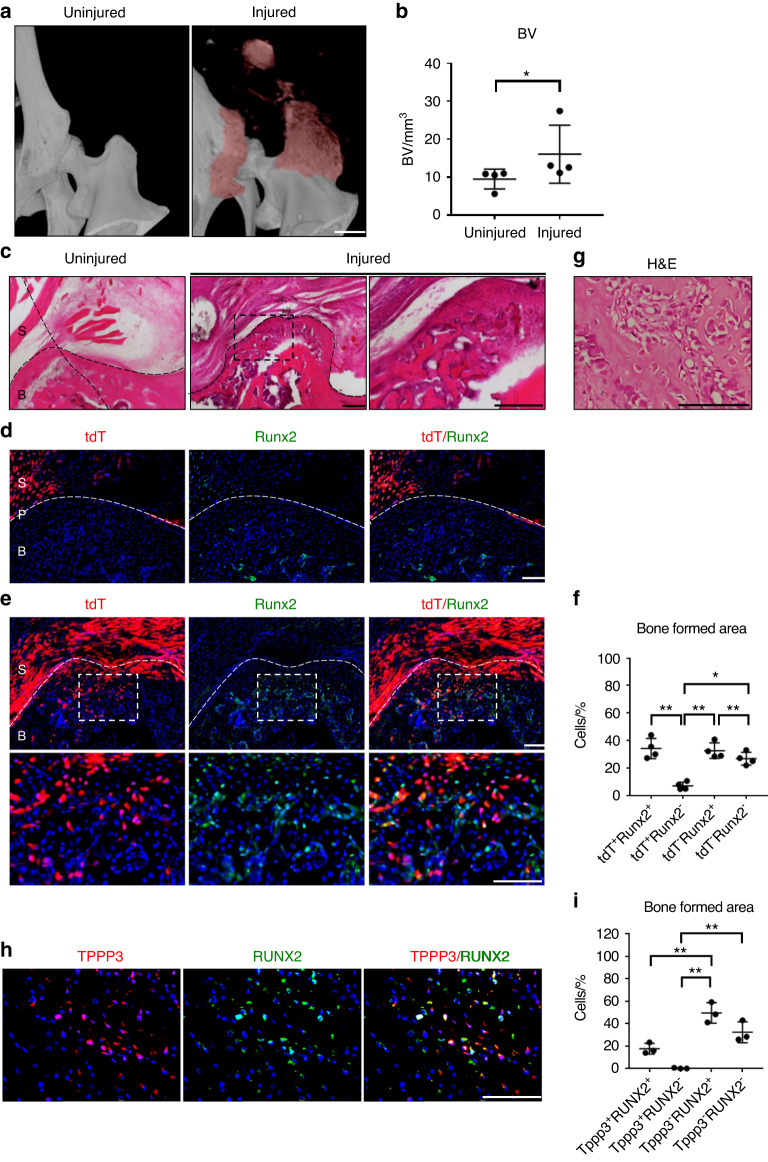
Heterotopic ossification (HO) is a pathological process resulting in aberrant bone formation and often involves synovial lined tissues. During this process, mesenchymal progenitor cells undergo endochondral ossification. Nonetheless, the specific cell phenotypes and mechanisms driving this process are not well understood, in part due to the high degree of heterogeneity of the progenitor cells involved. Here, using a combination of lineage tracing and single-cell RNA sequencing (scRNA-seq), we investigated the extent to which synovial/tendon sheath progenitor cells contribute to heterotopic bone formation. For this purpose, Tppp3 (tubulin polymerization-promoting protein family member 3)-inducible reporter mice were used in combination with either Scx (Scleraxis) or Pdgfra (platelet derived growth factor receptor alpha) reporter mice. Both tendon injury- and arthroplasty-induced mouse experimental HO models were utilized. ScRNA-seq of tendon-associated traumatic HO suggested that Tppp3 is an early progenitor cell marker for either tendon or osteochondral cells. Upon HO induction, Tppp3 reporter+ cells expanded in number and partially contributed to cartilage and bone formation in either tendon- or joint-associated HO. In double reporter animals, both Pdgfra+Tppp3+ and Pdgfra+Tppp3- progenitor cells gave rise to HO-associated cartilage. Finally, analysis of human samples showed a substantial population of TPPP3-expressing cells overlapping with osteogenic markers in areas of heterotopic bone. Overall, these data demonstrate that synovial/tendon sheath progenitor cells undergo aberrant osteochondral differentiation and contribute to HO after trauma.


Conflict of interest statement

Ji-Hye Yea (N), Mario Gomez-Salazar (N), Sharon Onggo (N), Masnsen Cherief (N), Zhao Li (N), Stefano Negri (N), Robert Joel Tower (N), Chen-Ming Fan (N), Benjamin Levi (N), Aaron W. James (Scientific advisory board, Novadip LLC; Consultant, Lifesprout LLC and Novadip LLC; Editorial Board, Bone Research, American Journal of Pathology).

Figures

Fig. 1
Fig. 1
Tppp3+ tendon sheath progenitors expand at the heterotopic ossification (HO) induction site after Achilles tendon injury. a Schematic representation of HO induction, including complete Achilles tenotomy (left) and dorsal burn (right). b Tppp3ECE/+;R26RtdT animals were administered tamoxifen (TMx) for three continuous days, followed by a 10-day washout period before HO induction. Reporter activity was examined at 1, 3 and 9 weeks after injury. c tdT+ (Tppp3) cells (red) in the defect area were visualized using sagittal sections of the distal tenotomy site after injury. tdT+ cells were present outside of the tendon (epitenon) in the uninjured condition, and the cells expanded into the defect area of the tendon after injury. The dashed white line indicates the margins of the Achilles tendon, and the dashed white box in the upper panels is magnified in the lower panels (scale bars: 200 µm). D: deep; T: tendon; S: superficial, IA: injured area, TA: tendon area. d Fraction of tdT+ cells in the injured area. e Fraction of tdT+ cells in the residual tendon area (under dashed white line). f UMAP visualization of cell clusters from the HO induction site at 0, 7, and 21 d post-injury. g Violin plots showing the expression of markers for cell type identification. h UMAP of Tppp3 expression across all clusters (all time points together). i UMAP showing the expression of Tppp3 in cell clusters across time points. n = 3 animals per timepoint for histology; for scRNA-seq, n = 4 animals per timepoint; 3 678, 13 358 and 5 366 cells at timepoints 0, 7 and 21 d, respectively
Fig. 2
Fig. 2
Cell subclustering and pseudotemporal trajectory analysis reveal a hierarchy of osteochondrogenic progenitors in relation to Tppp3 expression. a UMAP visualization of mesenchymal and pericyte subclusters. Three subclusters were found among mesenchymal cells: Cluster 0 (Tppp3- Acan+), Cluster 1 (Tppp3+ Acan-) and Cluster 3 (Tppp3+ Acan+). b Expression of mesenchymal (Pdgfra), pericyte (Pdgfrb, Mcam, Acta2) and tenocyte-like cells (Scx) and osteochondrogenic markers (Runx2, Acan) in each cell subcluster. c Pseudotime trajectory analysis of the four subclusters. d Expression of pericyte and mesenchymal markers across pseudotime. e Expression of Tppp3 across pseudotimes at all timepoints or individually at each time point. f Expression of tenocyte (Scx, Tnmd), chondrocyte (Acan) and osteoblast-related genes (Runx2) across pseudotime. g Heatmap of the pseudotime trajectory of pericytes (left), mesenchymal cells (right), and their common osteochondrogenic branch (center). h GO term analysis of clusters identified with pseudotime analysis, including pericytes, mesenchymal cells, and osteochondrogenic cells. i Heatmap showing the expression of secreted factors that regulate heterotopic ossification in the four cell subclusters. n = 4 biological replicates per time point. Animals and 1 460 (0 d), 6 317 (7 d) and 3 484 (21 d) mesenchymal cells per timepoint for scRNA-seq
Fig. 3
Fig. 3
Tppp3+ cells give rise to cartilage after HO induction in the Achilles tendon. a Cartilage area was visualized using Saf-O/Fast Green staining. Cartilage-like matrix appears red. The dashed black line indicates the margins of the tendon. The dashed black box in the upper panels is magnified in the lower panels (scale bars in panels: 200 µm). D, deep; T, tendon. b, c tdT+ cells and Sox9 or Acan immunohistochemical staining within representative sagittal sections of the distal tenotomy site. The dashed white line indicates the margins of the remaining tendon tissue. The dashed white box in the upper panels is magnified in the lower panels (scale bars in panels: 200 µm). D: deep; T: tendon. d, e Quantification of tdT+ and Sox9+ or Acan+ cells within the cartilage-formed area (n = 5 animals per group). f Schematic of the experiment: Tppp3ECE/+;R26RtdT;PdgfraH2B-eGFP animals were administered TMx for three continuous days, and reporter activity was examined at 3 weeks after injury. g, h tdT+ and H2B-eGFP (Pgdfra) + cells and Sox9 or Acan immunohistochemical staining within representative sagittal sections of the distal tenotomy site. The dashed white line indicates the margins of the remaining tendon tissue. The dashed white box in the upper panels is magnified in the lower panels (scale bars in panels: 200 µm). D, deep side; T, tendon area; S, superficial side. i, j Quantification of tdT+ and H2B-eGFP+ Sox9 or Acan expressing cells within the cartilage-formed area (n = 4 animals per group). For all graphs, each dot represents a single animal, with the mean ± 1 SD indicated. Statistical analysis was performed using one-way ANOVA with Tukey’s post hoc test. *P < 0.05 and **P < 0.01
Fig. 4
Fig. 4
Tppp3+ cell contribution to bone areas within the HO induction site of the Achilles tendon. a µCT reconstruction of the injured Achilles tendon at 9 weeks post-injury. Heterotopic bone appears red, while native bone appears white (scale bar: 1 mm). b µCT quantification of heterotopic bone volume (BV) of the distal tenotomy site (n = 5 animals per group). c The bone formed area was visualized using H&E staining within representative sagittal sections of the distal tenotomy site. The dashed white line indicates the margins of the remaining tendon tissues. The dashed white box in the upper panels is magnified in the lower panels (scale bar in the upper panel: 200 µm, scale bar in the lower panel: 100 µm). d tdT+ cells and Ocn immunohistochemical staining within representative sagittal sections of the distal tenotomy site. The dashed white line indicates the margins of the tendon tissue. The dashed white box in the upper panels is magnified in the lower panels (scale bars in upper panels: 200 µm, scale bars in lower panels: 100 µm). e Quantification of tdT+ and Ocn+ cells within the bone-formed area (n = 5 animals per group). D: deep; T: tendon. For all graphs, each dot represents a single animal, with the mean ± 1 SD indicated. Statistical analysis for (b) was performed using two-tailed Student’s t test. Statistical analysis for (e) was performed using one-way ANOVA with Tukey’s post hoc test. *P < 0.05 and **P < 0.01
Fig. 5
Fig. 5
Tppp3+ cells give rise to a portion of tenocytes in the HO site. a Schematic of the experiment: Tppp3ECE/+;R26RtdT;Scx-GFP animals were administered TMx for 3 continuous d, and reporter activity was examined at 3 weeks after injury. b tdT+ and Scx-GFP expression within representative sagittal sections of the middle area of the tenotomy site. The dashed white line indicates the margins of tendon-like tissue. The dashed white box in the upper panels is magnified in the lower panels (scale bars in panels: 200 µm). c Quantification of tdT+ and Scx-GFP+ cells within the tendon-formed area (n = 5 animals per group). d tdT+ cells and Tnmd immunofluorescence staining within representative sagittal sections of the middle tenotomy site. The dashed white line indicates the margins of tendon-like tissue. The dashed white box in the upper panels is magnified in the lower panels. e Quantification of tdT+ and Tnmd+ cells within the tendon-formed area (n = 4 animals per group) (scale bars in panels: 200 µm). D: deep; T: tendon; S: superficial. For all graphs, each dot represents a single animal, with the mean ± 1 SD indicated. Statistical analysis was performed using the Kruskal‒Wallis test with Dunn’s post hoc multiple comparisons test. *P < 0.05
Fig. 6
Fig. 6
Tppp3+ cells in heterotopic cartilage formed an area at an intracapsular site at 3 weeks after HO induction in a hip postarthroplasty HO model. a Schematic representation of hip HO induction. b Tppp3ECE/+;R26RtdT animals were administered tamoxifen (TMx) for three d, followed by a 10 d washout period before HO induction. Reporter activity was examined at 3 weeks after injury. c The cartilage-formed area was visualized using Saf-O/Fast Green staining at the intracapsular site. Cartilage-like matrix appears red. d, e, g tdT+ and Sox9 or Acan immunohistochemical staining within representative transverse sections of hips. The image in (d) is the contralateral side, and the images in (e, g) are the injured side of the hips. A acetabulum, FH femoral head, C capsule. f, h Quantification of tdT+ and Sox9+ or Acan+ cells within the cartilage-formed area (n = 4 animals per group). Scale bars: 500 µm. For all graphs, each dot represents a single animal, with the mean±1 SD indicated. Statistical analysis was performed using one-way ANOVA with Tukey’s post hoc test. *P < 0.05 and **P < 0.01
Fig. 7
Fig. 7
Tppp3+ cell contribution to periosteal sites after HO induction in a hip postarthroplasty HO model. a µCT reconstruction of bone formation at 3 weeks after injury. Heterotopic bone appears red, while native bone appears white. b µCT quantification of heterotopic BV (scale bar: 1 mm, n = 4 animals per group). c The bone formed area was visualized using H&E staining at the periosteal site of the femoral bone. The dashed black line indicates the margins of heterotopic bone. The dashed black box in the upper panels is magnified in the lower panels (scale bars in panels: 200 µm). d, e tdT+ and Runx2 immunohistochemical staining at periosteal sites of femoral bone (scale bars in panels: 100 µm). The image in (d) represents the contralateral control side, and the image in (e) represents the injured side. Dashed white lines indicate margins of bone. The dashed white box in the upper panels is magnified in the lower panels. S: synovium; B: bone; P: periosteum. f Quantification of tdT+ and Runx2+ cells within the bone area (n = 4 animals per group). g H&E staining showed human heterotopic ossification of a human sample (scale bar in panel: 200 µm). h TPPP3 and RUNX2 immunofluorescence staining within human heterotopic ossification in a hip joint (scale bar in panel: 200 µm). i Quantification of TPPP3+ and RUNX2+ cells within the bone area (n = 3 slides per group). For all graphs, each dot represents a single sample, with the mean±1 SD indicated. Statistical analysis for (b) was performed using the Mann-Whitney test. Statistical analysis for (f, i) was performed using one-way ANOVA with post hoc Tukey’s test. *P < 0.05 and **P < 0.01

References

    1. Negri S, et al. Acetabular reaming is a reliable model to produce and characterize periarticular heterotopic ossification of the hip. Stem Cell Transl. Med. 2022;11:876–888. doi: 10.1093/stcltm/szac042. - DOI - PMC - PubMed
    1. McCarthy E, Sundaram M. Heterotopic ossification: a review. Skeletal Radiol. 2005;34:609–619. doi: 10.1007/s00256-005-0958-z. - DOI - PubMed
    1. Lin L, Shen Q, Xue T, Yu C. Heterotopic ossification induced by Achilles tenotomy via endochondral bone formation: expression of bone and cartilage related genes. Bone. 2010;46:425–431. doi: 10.1016/j.bone.2009.08.057. - DOI - PubMed
    1. Meyers C, et al. Heterotopic Ossification: A Comprehensive Review. JBMR Plus. 2019;3:e10172. doi: 10.1002/jbm4.10172. - DOI - PMC - PubMed
    1. Wittenberg RH, Peschke U, Botel U. Heterotopic ossification after spinal-cord injury-epidemiology and risk-factors. J. Bone Joint Surgery-British Volume. 1992;74:215–218. doi: 10.1302/0301-620X.74B2.1544955. - DOI - PubMed