. 2023 Jul 21;9(1):35.
doi: 10.1038/s41540-023-00298-1.

Growth exponents reflect evolutionary processes and treatment response in brain metastases

Affiliations

Growth exponents reflect evolutionary processes and treatment response in brain metastases

Beatriz Ocaña-Tienda et al. NPJ Syst Biol Appl. .

Abstract

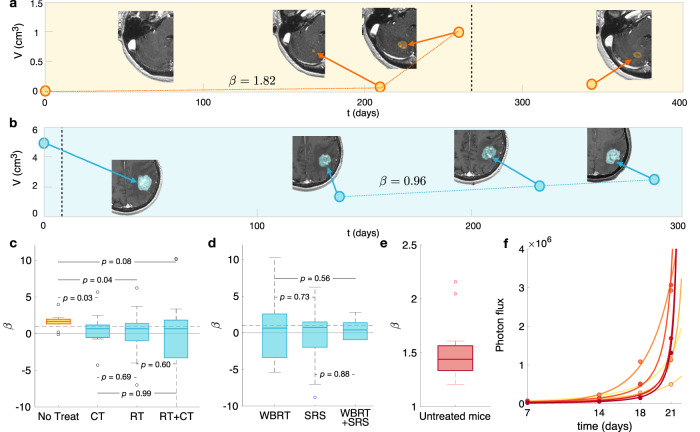
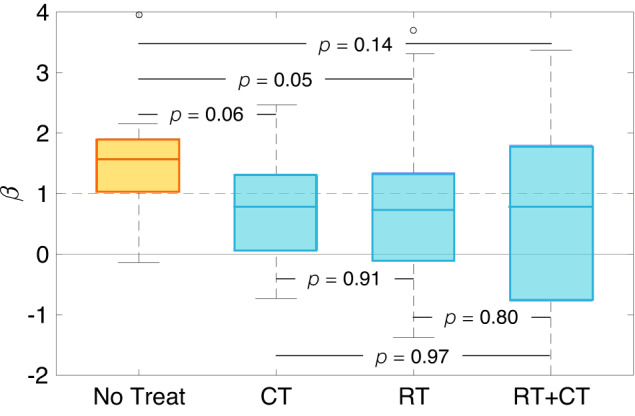
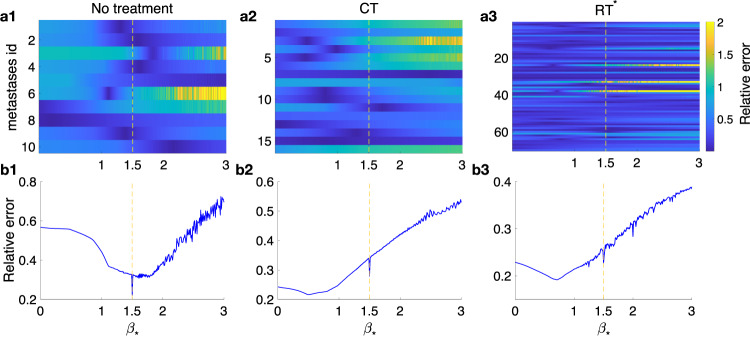
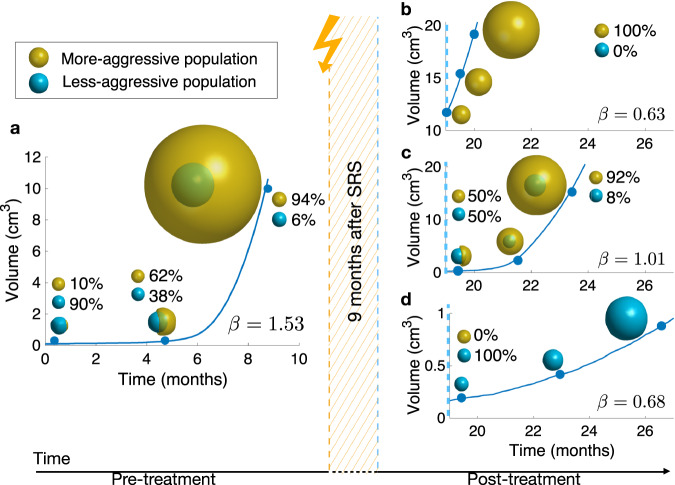
Tumor growth is the result of the interplay of complex biological processes in huge numbers of individual cells living in changing environments. Effective simple mathematical laws have been shown to describe tumor growth in vitro, or simple animal models with bounded-growth dynamics accurately. However, results for the growth of human cancers in patients are scarce. Our study mined a large dataset of 1133 brain metastases (BMs) with longitudinal imaging follow-up to find growth laws for untreated BMs and recurrent treated BMs. Untreated BMs showed high growth exponents, most likely related to the underlying evolutionary dynamics, with experimental tumors in mice resembling accurately the disease. Recurrent BMs growth exponents were smaller, most probably due to a reduction in tumor heterogeneity after treatment, which may limit the tumor evolutionary capabilities. In silico simulations using a stochastic discrete mesoscopic model with basic evolutionary dynamics led to results in line with the observed data.


Conflict of interest statement

The authors declare no competing interests.

Figures

Fig. 1
Fig. 1. Growth dynamics of untreated and post-treatment relapsing BMs.
Longitudinal dynamics observed in a an untreated breast cancer BM and b a relapsing post-SRS lung cancer BM. SRS treatment times are marked with a vertical dashed black line. Dots are the measured volumes and the dashed orange and blue lines are the links between points used for growth exponent computation. Axial slices of the contrast-enhanced T1-weighted MRI sequences are displayed. c Box plots comparing the growth exponents β of the different groups: untreated (n = 10), growing during chemotherapy treatment (CT, n = 16), recurrent BMs receiving only radiation therapy (RT, n = 30), or both (RT+CT, n = 40). Growth exponents were obtained for each BM using Eq. (3). p-values correspond to the Kruskal–Wallis test. d Box plots of the growth exponent β for BMs after RT: WBRT (n = 16), SRS (n = 44) and both (n = 10). The Kruskal–Wallis test gives non-significant p-values, showing no differences between growth exponents β in these groups. e Box plot of the growth exponents β in mice (n = 20) injected with an human lung adenocarcinoma brain tropic model (H2030-BrM). f Total tumor mass growth curves for some of the studied mice where dots correspond to the measured values and lines are the fittings by Eq. (4). The boxplots depict the median (center line), interquartile range (bounds of the box), the range of typical data values (whiskers, extending 1.5 times the interquartile range), and outliers (represented by circles).
Fig. 2
Fig. 2. Growth dynamics of untreated and post-treatment relapsing BMs that successfully met the sensitivity analysis criteria.
Box plots comparing the growth exponents β of the different groups after a sensitivity analysis: untreated (n = 9), growing during chemotherapy treatment (CT, n = 14), recurrent BMs receiving only radiation therapy (RT, n = 27), or both (RT+CT, n = 29). p-values correspond to the Kruskal–Wallis test. The boxplots depict the median (center line), interquartile range (bounds of the box), the range of typical data values (whiskers, extending 1.5 times the interquartile range), and outliers (represented by circles).
Fig. 3
Fig. 3. Growth exponent best fitting the dynamics for the dataset of untreated, CT and RT groups.
Relative errors obtained when the β growth exponent is fixed. a Errors computed for each metastasis in the different groups: untreated (a1), CT (a2), RT* (a3). b Cumulative errors for each subgroup of BMs as a function of β* for each of the different groups: untreated (b1), CT (b2), RT* (b3). The yellow dashed line indicates the value β* = 1.5.
Fig. 4
Fig. 4. Simulations of longitudinal growth of heterogeneous BMs with two initial populations (turquoise: less aggressive, and ocher: more aggressive).
a Pre-treatment and bd post-treatment cases. The more aggressive population carries an advantage of 80% in proliferation speed and 92.5% in migration speed, compared to the less aggressive population. In a the BM is composed of 10% of more aggressive cells, and 90% of less aggressive cells. After eight months, the more aggressive population has overcome its counterpart, becoming dominant. Then, three different situations that can happen after treatment are illustrated: b the less aggressive population is completely removed from the tumor; c both populations remain in a balanced state, and d the more aggressive population is completely removed from the tumor. The betas were computed by choosing a random time point from each third of the total simulated time and are shown on each subplot.
Fig. 5
Fig. 5. Growth exponents β obtained from a parameter sweep varying the advantages in migration and proliferation.
Simulations were carried out for different combinations of coefficients vdiv (advantage in proliferation; values explored range from 1.11 to 5) and vmig (advantage in migration; values explored range from 1.05 to 5). a Poor-effectiveness treatment case (proportion of aggressive cells after treatment is 20%). The largest exponent β obtained is equal to 1.615, for a vdiv = 1.33 and a vmig = 1.05. b Medium-effectiveness treatment case (proportion of aggressive cells after treatment is 10%). The largest exponent β achieved was 1.758, for a vdiv = 1.25 and a vmig = 1.05. c High-effectiveness treatment case (proportion of aggressive cells after treatment is 1%). The largest exponent β achieved was equal to 1.99, for a vdiv = 1.1765 and a vmig = 1.05. Gray lines correspond to β = 1.
Fig. 6
Fig. 6. Interpretation of the growth exponent β.
a Growth behavior for several values of the growth exponent β when fixing initial and final volumes and times. The growth exponent gives information about the shape of the curves. b Growth behavior for the same values of the growth exponent β than in a when fixing initial volumes and α. c Growth behavior when fixing β = 1 and the initial volume, showing different growth curves with different α but the same exponent. d Growth behavior when fixing β = 5 and the initial volume, showing different growth curves with different values of α.
Fig. 7
Fig. 7. Growth exponent β for different types of growth: exponential, cubic, Gompertz and logistic.
a Growth function in blue with a ±20 % error in green. b Computed β from Eq (1) for the different growth without error. c Computed β when a random error is taken into account.

References

    1. Kuang, Y., Nagy, J. D. & Eikenberry, S. E. Introduction to mathematical oncology (Chapman & Hall/CRC; 2016).
    1. Benzekry S, et al. Classical mathematical models for description and prediction of experimental tumor growth. PLoS Comput. Biol. 2014;10:e1003800. doi: 10.1371/journal.pcbi.1003800. - DOI - PMC - PubMed
    1. Jarrett AM, et al. Mathematical models of tumor cell proliferation: a review of the literature. Expert Rev. Anticancer Ther. 2018;18:1271–1286. doi: 10.1080/14737140.2018.1527689. - DOI - PMC - PubMed
    1. Gerlee P. The model muddle: In search of tumor growth laws. Cancer Res. 2013;73:2407–2411. doi: 10.1158/0008-5472.CAN-12-4355. - DOI - PubMed
    1. West J, Newton PK. Cellular interactions constrain tumor growth. Proc. Natl Acad. Sci. USA. 2019;116:1918–1923. doi: 10.1073/pnas.1804150116. - DOI - PMC - PubMed

Publication types